Kotlikoff Discusses Proposals for U.S. Banking Overhaul: Video
the whole system is corrupt … told by Laurence Kotlikoff
Kotlikoff Says Banks Should Operate Same as Mutual Funds: Video
Larry Kotlikoff: Why I Support Sovereign Money
Larry Kotlikoff on the Clash of Generations
‘US hides real debt, in worse shape than Greece’
The 2008 Financial Crisis: Crash Course Economics #12
The Last Days Of Lehman Brothers Moral Hazard 2008
Global Financial Meltdown – One Of The Best Financial Crisis Documentary Films
Crash Begins! PETER SCHIFF (DEC 2018) Economic Collapse Of U.S on 2018. Timeline to Dollar Collapse
Peter Schiff: The markets are going to collapse due to Fed raising rates
Ep. 428: The Fed’s Deal with the Devil
Why the Worst Market Crash EVER Will Happen in 2018
Debt bomb: Are we on the brink of another global financial crisis?
EXCLUSIVE!! JIM ROGERS EXPLAINS HOW BAD THE DEPRESSION WILL BE AND THE TRADE WAR WITH CHINA!
Alert! JIM ROGERS: The economic collapse will occur 100% / Last warning for December, 2018
Will there be a recession in 2019?
How Did America Go Bankrupt? Slowly, At First, Then All At Once!
The US federal debt has again been on the move, as of mid-week up to a fresh record of $20.7 trillion. But, really, without some sort of reference point, what does that mean?
Typically, the metrics of total debt or federal debt divided by GDP (Gross Domestic Product, or the total value of goods produced and services provided in the US annually) are used (chart below). Still, that’s a bit ethereal to most folks.
So, I thought I’d make this simpler. The chart below shows federal debt (red line) versus total full-time employees (blue line) since 1970. Clearly, debt has surged since 2000 and particularly since 2008 versus decelerating net full-time jobs growth. The number of full-time employees is economically critical as, generally speaking, only these jobs offer the means to be a home buyer or build savings and wealth in a consumer-driven economy. Part-time employment generally offers only subsistence level earnings.
But if we look at the change over those periods highlighted in the chart above, we get a clear picture (chart below). Full-time jobs are being added at a rapidly declining rate while federal debt is surging in the absence of the growth of full-time employees.
The fiscal gap is a measure of a government’s total indebtedness proposed by economists Laurence Kotlikoff and Alan Auerbach, who define it as the difference between the present value of all of government’s projected financial obligations, including future expenditures, including servicing outstanding official federal debt, and the present value of all projected future tax and other receipts, including income accruing from the government’s current ownership of financial assets.[1] According to Kotlikoff and Auerbach, the “fiscal gap” accounting method can be used to calculate the percentage of necessary tax increases or spending reductions needed to close the fiscal gap in the long-run.
Generational accounting, an accounting method closely related to the fiscal gap, has been proposed by the same authors as a measure of the future burden of closing the fiscal gap. The “generational accounting” assumes that current taxpayers are neither asked to pay more in taxes nor receive less in transfer payments than current policy suggests and that successive younger generations’ lifetime tax payments net of transfer payments received rise in proportion to their labor earnings.
According to Kotlikoff and Auerbach, “fiscal gap accounting” and “generational accounting” reports have been done for roughly 40 developed and developing countries either by their treasury departments, finance ministries, or central banks, or by the IMF, the World Bank, or other international agencies, or by academics and think tanks.
Size of the U.S. fiscal gap
Fiscal gap accounting is not new to the U.S. government.[citation needed] The Social Security Trustees and Medicare Trustees have been presenting such calculations for their own systems for years in their annual reports.[citation needed] And generational accounting has been included in the President’s Budget on three occasions.[citation needed]
Based on calculations using the 2012 Alternative Fiscal Scenario long-term projections by the Congressional Budget Office, some estimate the U.S. fiscal gap stands to be $222 trillion – more than 13 times larger than the reported U.S. National Debt.[citation needed] According to the same estimates, the gap grew $11 trillion from 2011 to 2012.[citation needed] Eliminating the entire U.S. fiscal gap through revenue alone would require a permanent 64% increase in all federal taxes.[citation needed] Alternatively, closing the gap through spending reductions alone would require a permanent 40% cut in all federal purchases and transfer payments.[2]
Criticism of fiscal gap accounting
The proposed “fiscal gap” accounting method has been criticized as fundamentally flawed by economists Dean Baker,[3]Bradford DeLong,[4] and Paul Krugman.[5] Their critiques, referenced above, center on the fact that fiscal gap accounting calculates the growth future debt in current account terms, without taking into account the fact that future GDP will also grow proportionately, with the result that future debt will fall on generations with substantially larger incomes to cover the debt, obviating the seeming fiscal impossibility of covering the gap.
Kotlikoff’s thesis examined, in a life-cycle simulation model, the impact of intergenerational redistribution on the long-run position of the economy. He also studied whether the rich spend a larger or smaller share of their lifetime resources than do the poor. And he provided a new empirical approach to understanding the impact of Social Security on saving. At UCLA, Kotlikoff wrote a paper with Avia Spivak on intra-family risk-sharing entitled “The Family as an Incomplete Annuities Market.”[2]
He also wrote a widely cited paper with Lawrence Summers questioning the importance of saving for retirement in determining total U.S. wealth accumulation.[3] The publication suggested that most of U.S. wealth accumulation was not attributed to life-cycle saving, but rather to private intergenerational transfers (whether intended or unintended).[3] The article was the subject of a lively debate between Kotlikoff and Franco Modigliani, who won the Nobel Prize in part for his work on the life-cycle model.[4]
Kotlikoff, together with Alan Auerbach and Jagadeesh Gokhale, pioneered Generational Accounting, which measures the fiscal burdens facing today’s and tomorrow’s children.[5] Kotlikoff’s work on the relativity of fiscal language claims to show that conventional fiscal measures, including the government’s deficit, are not well defined from the perspective of economic theory.[citation needed]
According to Kotlikoff, their measurement reflects economically arbitrary fiscal labeling conventions.[citation needed] He argues that an “Economics labeling problem,” as he calls it, has led to gross misreadings of the fiscal positions of different countries, starting with the United States, which has a relatively small debt-to-GDP ratio, but, he argues, is in worse fiscal shape than any other developed country.[citation needed] In 1991, Kotlikoff, together with Alan Auerbach and Jagadeesh Gokhale, produced the first set of generational accounts for the United States.[citation needed]
Their study claimed to find a major fiscal gap separating future government spending commitments and its means of paying for those commitments, portending dramatic increases in the lifetime net tax burdens facing young and future generations.[citation needed] The generational accounting and fiscal gap accounting developed by Auerbach, Gokhale, and Kotlikoff is a means of assessing the sustainability of fiscal policy and how different countries intend to treat their next generations.[citation needed] Recent generational accounting by the IMF and fiscal gap accounting by Kotlikoff claim to confirm the truly severe long-run fiscal problems facing the U.S.[citation needed]
In the late 1970s, Kotlikoff, together with Berkeley economist, Alan J. Auerbach, developed the first large-scale computable general equilibrium life-cycle model that can track the behavior, over time, of economies comprising large numbers of overlapping generations.[6] The model and its offspring have been used extensively to study future fiscal and demographic transitions in the U.S. and abroad.[citation needed] Demographically realistic overlapping generations models, in which agents can live for up to, say, 100 years, are very complicated mathematical structures.[citation needed]
Agents who are young would, if they were rational and precognitive, consider all future interest rates and wage rates in deciding how much to save and work in the current as well as in their remaining future years.[citation needed] This path of interest rates and wage rates will, in turn, depend on the course of the economy’s relative supplies of capital and labor, since these relative supplies determine whether capital or labor is relatively scarce in any given future year and, therefore, what these factors of production will get paid in the competitive market.[citation needed]
The paths of capital and labor will be determined by the aggregation of the saving and labor supply decisions of the individual agents alive through time.[citation needed] Thus a young person’s decision about consuming and working today depends, in part, on what he believes will be the interest and wage rates when he’s middle age and old, for example, age 90.[citation needed] But the value of these factor prices when he’s age 90 depend on how much capital and labor will be around in that year.[citation needed]
This depends, in part, on the saving and labor supply of unborn generations who will be saving and working when he reaches old age.[citation needed] In short, the economic decisions of one generation are interlinked with those of others because of general equilibrium considerations in which each year’s collective supplies of capital and labor must equal that year’s aggregate demands for these inputs.[citation needed] And the path of interest and wage rates must be such as to clear (equate supplies to their respective demands) these factor markets at each point in time.[citation needed]
Under standard assumptions about the nature of technology and in the simplest framework (which can be extended to more than two inputs), this problem devolves into a 200-plus order non-linear difference equation in the ratio of capital to labor.[citation needed] This ratio summaries both the relative supplies of and demands for the two factors. In equilibrium, the ratio of factor inputs supplied each year must equal the ratio of factor inputs demanded.[citation needed]
Since the path of the capital-labor ratio determines the path of the interest and wage rate, which determine both the annual supply of and demand for the two factors of production, the problem boils down to finding the precise path of the capital-labor ratio that will draw forth from extant households each year aggregate supplies of capital and labor that exactly match each year’s respective aggregate demands for capital and labor by firms.[citation needed]
There are no mathematical techniques for calculating the exact solution of high order non-linear difference equations.[citation needed] (The Scarf Algorithm cannot be used in this context because the number of markets is infinite; i.e., there is no assumed end of the world.) Auerbach and Kotlikoff devised an iterative solution method that entails guessing how the economy’s ratio of capital to labor will evolve and then updating the guesses based on deviations of annual capital and labor supplies from their respective annual demands and continuing in this manner until the economy’s capital-labor transition path converges to a fixed-point path (more precisely, until the guessed ratio of the annual demands for capital relative to labor equal the annual supplies of capital relative to labor).[citation needed]
Prior to the development of the Auerbach-Kotlikoff model, economists had no means of assessing how a realistic life-cycle economy would evolve, including the timing of its responses to a wide range of fiscal and demographic changes.[citation needed] For example, economists had no means of saying how much capital would be available to the economy in each future year were the government to increase its consumption on a permanent basis and finance that higher level of consumption by raising income tax rates.[citation needed]
One of the latest incarnations of the Auerbach-Kotlikoff model – a paper by Hans Fehr, Sabine Jokisch, and Laurence Kotlikoff entitled “Dynamic Globalization and Its Potentially Alarming Prospects for Low-Wage Workers,” includes five regions (the U.S., Europe, Japan, China, and India), six goods, region-specific fiscal policy and demographics, and the endogenous determination of the pattern of specialization.[citation needed]
The general relativity of fiscal language
In 1984, Kotlikoff wrote a fundamental paper entitled “Deficit Delusion”, which appeared in The Public Interest. This was the first of a series of papers and books (see, e.g., Generational Accounting and Generational Policy) by Kotlikoff, including work with co-authors, showing, via examples, that in economic models featuring rational agents, “the” deficit is a figment of language, not economics. I.e., the deficit is not economically well defined. Instead, what governments measure as “the” deficit is entirely a result of the language they use to label government receipts and payments.[citation needed]
If the government calls a receipt a “tax,” this lowers the reported deficit. If, instead, it calls the receipt “borrowing,” it raises the reported deficit. Thus, if you give the government, say, $1,000 this year, it can say it is taxing you $1,000 this year. Alternatively, it can say it is borrowing $1,000 from you this year and will be taxing you in, say, five years the $1,000 plus accrued interest and using this future tax to pay you the principal plus interest due on the current borrowing. With one set of words the deficit is $1,000 larger this year than with the other set of words.[citation needed]
If it so chose, the government could say it was taxing you $1,000 this year and also, this year, borrowing $1 trillion from you for, say, five years, making a transfer payment to you this year of $1 trillion, and taxing you in five years an amount equal to principal plus interest on the $1 trillion and using it to pay principal plus interest on the $1 trillion it is now borrowing. With this alternative choice of words, the reported deficit is $1 trillion larger than with the first set of words. But in all three examples, you hand over $1,000 this year and receive and pay zero on net in the future.[original research?]
Einstein taught us that neither time, nor distance are well-defined physical concepts. Instead, their measurement is relative to our frame of reference – how fast we were traveling in the universe and in what direction. Our physical frame of reference can be viewed as our language or labeling convention. Einstein showed that neither time nor distance were well-defined concepts, but could be measured in an infinite number of ways. The same is true of the deficit. Just like absolute time and distance are not well defined, the deficit and related conventional fiscal measures has no economic meaning.[citation needed][original research?]
Kotlikoff, along with Harvard’s Jerry Green, offered a general proof of the proposition that deficits and a number of other conventional fiscal measures are, economically speaking, content-free, concluding that the deficit is simply an arbitrary figment of language in all economic models involving rational agents.[7]
Such models can feature all manner of individual and aggregate uncertainty, incomplete markets, distortionary fiscal policy, asymmetric information, borrowing constraints, time-inconsistent government policy, and a host of other problems, yet “the” deficit will still bear no theoretical connection to real policy-induced economic outcomes.[citation needed][original research?] The reason, again, is that there is no single deficit, but rather an infinity of deficit or surplus policy paths that can be announced (by the government or any private agent) simply by choosing the “right” fiscal labels.[citation needed][original research?]
Frames of reference
According to Kotlikoff, using the deficit as a guide to fiscal policy is like driving in Los Angeles with a map of New York City.[citation needed] For unlike in our physical world in which we are all using the same language (have the same frame of reference), in the world of economics, we are each free to adopt our own frame of reference – our own labeling convention. Thus, if Joe wants to claim that the U.S. federal government ran enormous surpluses for the last 50 years, he can simply choose appropriate words to label historic receipts and payments to produce that time series.[citation needed]
If Sally wishes to claim the opposite, there are words she can find to justify her view of the past stance of fiscal policy. And if Sam wishes to claim that that economy has experienced fluctuations from deficits to surpluses of arbitrary magnitude from year to year, he can do so. Language is extremely flexible. And there is nothing in economic theory that pins down how we discuss economic theory.[citation needed]
Kotlikoff and Green claim that fiscal variables in all mathematical economic models involving rational agents can be labeled freely and tell us nothing about the models themselves (no more than does choosing to discuss the models in French or English), and this means that the multitudinous econometric studies relating well-defined economic variables, such as interest rates or aggregate personal consumption, to “the” deficit are, economically speaking, content free.[citation needed]
According to Kotlikoff, the deficit is not the only variable that is not well defined.[citation needed] An economy’s aggregate tax revenue, its aggregate transfer payments, its disposable income, its personal and private saving rates, and its level of private wealth – all are non-economic concepts that have, from the perspective of economic theories with rational agents, no more purchase on economic reality than does the emperor’s clothes in Hans Christian Andersen’s famous children’s story.[citation needed]
Kotlikoff chose the title of his paper with Green not to suggest in the slightest any comparison of intellect with Einstein,[original research?] but rather because of what seemed to him to be a strikingly similar message about confusing linguistics for substance.[citation needed] An example here is the definition of a capitalistic economy as one in which capital is primarily owed by the private sector. Kotlikoff claims that an economy which is described as having predominately privately owned wealth can just as well be described as one in which wealth is predominantly or, for that matter, entirely state-owned.[citation needed] Hence, “deficit delusion” implies that economic theory offers no precise measure/definition of capitalism, socialism, or communism.[citation needed]
Intergenerational altruism
Kotlikoff has done pioneering[peacock term] work testing intergenerational altruism[citation needed] – the proposition that current generations care about their descendants enough to ensure that government redistribution from their descendants to themselves will be offset by private redistribution back to the descendants either in the form of bequests or intervivos gifts. This proposition dates to David Ricardo, who raised it as a theoretical, but empirically irrelevant proposition.[citation needed]
In 1974, Robert Barro revived “Ricardian Equivalence” by showing in a simple, elegant framework that each generation’s caring about its children leads current generations to be altruistically linked to all their descendants. Hence, a government policy of transferring resources to current older generations at a cost to generations born, say, in 100 years would induce the current elderly to simply increase their gifts and bequests to their children who would pass the resources onward until it reached those born in 100 years.[citation needed]
This inter-linkage of current and future generations devolves into a mathematical model which is isomorphic to one in which all agents are infinitely lived (i.e., they act as if they live for ever in so far as their progeny are front and center in their preferences). The infinitely-lived model was originally posited by Frank Ramsey in the 1920s. It’s aggregation properties make it very convenient for teaching macro economics because one does not have to deal with the messiness of upwards of 100 overlapping generations acting independently, but also interdependently. Consequently, it has become a mainstay in graduate macroeconomics training and underlies the work by Economics Nobel Laureate Ed Prescott and other economists on Real Business Cyclemodels.[citation needed]
Kotlikoff’s singly and jointly authored work in the 1980s and 1990 called this model into question on both theoretical and empirical grounds. In a paper entitled “Altruistic Linkages within the Extended Family: A Note (1983),” which appears in Kotlikoff’s 1989 MIT Press book What Determines Savings? Kotlikoff showed that when agents take each other’s transfers as given, marriage generates intergenerational linkages between unrelated individuals.[citation needed]
I.e., if you, Steve, are altruistic toward your daughter, Sue, and your daughter marries John, who is altruistically linked to his father Ed, who has a daughter Sara who is altruistic toward her husband David, who cares about his sister Ida, who’s cares about her father-in-law Frank, you Steve are altrusitically linked to Frank. Furthermore, if Frank loses a dollar and you gain a dollar, Barro’s model implies that you Steve will take your new found dollar and hand it to Frank. Kyle Bagwell and Douglas Bernheim independently reached Kotlikoff’s conclusion, namely that the Barro model had patently absurd implications.[citation needed]
Together with Assaf Razin and Robert Rosenthal, Kotlikoff showed in [4] that dropping the unrealistic assumption that transfers are taken as given and permitting individuals to refuse transfers (e.g., refusing your mother’s offer of an extra helping of cabbage) invalidates Barro’s proposition of Ricardian Equivalence. I.e., they showed that Barro’s model was a combination of a plausible set of preferences (altruism toward one’s children) and an implausible assumption about the game being played by donors and donees. In a series of empirical papers with Stanford economist Michael Boskin, University of Pennsylvania economist Andrew Abel, Yale economist Joseph Altonji, and Tokyo University economist Fumio Hayashi, Kotlikoff and his co-authors showed that there was little, if any, empirical support for Barro’s very special model of intergenerational altruism.[citation needed]
Generational redistribution
In life-cycle models without operative intergenerational altruism, the young are the big savers because of every dollar they receive, they save a larger percentage than do the elderly for the simple reason that the elderly are closer to the ends of their lives and want to use it before they lose it. The unborn are, of course, the biggest savers because giving them an extra dollar (that they will be able to collect with interest when they arrive) leads them to consume nothing more in the present because they aren’t yet alive.[citation needed]
So taking from the young and unborn and giving to the elderly should lead to a decline in national saving. In a 1996 paper with Jagadeesh Gokhale and John Sablehaus, Kotlikoff showed that the ongoing massive redistribution from young and future savers to old savers was responsible for the postwar decline in U.S. saving.[8]
Notwithstanding his many studies overturning Ricardian Equivalence, on both theoretical and empirical grounds, Kotlikoff has a paper showing why intergenerational transfers may have no impact on the economy in a world of purely selfish life-cycle agents. The argument presented is simple. Once younger generations have been maximally exploited by older generations (who are assumed to have the ability to redistribute from the young to themselves), older generations can no longer extract resources for free, meaning they can no longer leave higher fiscal burdens for future generations without handing over a quid pro quo. At such an extreme, intergenerational transfers, per se, are no longer feasible because the young will refuse to accept them.[citation needed]
Kotlikoff has been a supporter of the FairTax proposal as a replacement for the federal tax code, contributing to research of plan’s effects and the required rate for revenue neutrality.[10] In 2010, Kotlikoff offered his own tax proposal, titled the Purple Tax (a blend of red and blue), a consumption levy that he says cleans up some problems with the FairTax.[11][12]
His plan calls for a 15% final (17.5% nominal) sales tax. The FICA tax ceiling is gone and the 7.65% of the employees contribution is applied on everything after $40,000 but the employer pays 7.65% on the employees entire salary.[13]
Finance
Kotlikoff’s proposed reform of the financial system,[14][15][16] discussed in Jimmy Stewart Is Dead, called Limited Purpose Banking, transforms all financial companies with limited liability, including incorporated banks, insurance companies, financial exchanges, and hedge funds, into pass-through mutual funds, which do not borrow to invest in risky assets, but, instead, allows the public to directly choose what risks it wishes to bear by purchasing more or less risky mutual funds.[17] According to Kotlikoff, Limited Purpose Banking keeps banks, insurance companies, hedge funds and other financial corporations from borrowing short and lending long, which leaves the public to pick up the pieces when things go south.[17] Instead, Kotlikoff argues Limited Purpose Banking forces financial intermediaries to limit their activities to their sole legitimate purpose—financial inter-mediation.[17] It would substitute the vast array of extant federal and state financial regulatory bodies with a single financial regulator called the Federal Financial Authority (FFA), which would have a narrow purpose namely to verify, disclosure, and oversee the independent rating and custody off all securities purchased and sold by mutual funds.[17]
Healthcare
In his 2007 book, The Healthcare Fix, Kotlikoff proposed a major reform of the U.S. healthcare system, subsequently dubbed “The Purple Health Plan”,[18] that would do away with Medicare, Medicaid, employer-based healthcare, and health exchanges established under the Affordable Care Act.[19] In their place, every American would receive a voucher for a basic health insurance policy, whose coverages would be established by a panel of doctors such that the total cost of all vouchers remained within a fixed share, e.g., 10 percent, of GDP.[18][19] The voucher would be provided by the government at no cost and its amount would be individually risk-adjusted, i.e., sicker people would receive larger vouchers.[18][19] No health insurance company providing the basic insurance plan could turn anyone away and those who could afford supplemental health insurance plans would be free to purchase them.[18][19]
According to Kotlikoff, the plan provides universal basic health insurance, retains private provision of healthcare, limits government healthcare spending to a fixed share of GDP, and avoids adverse selection.[18][19] Kotlikoff has denounced critics of the plan such as economist Paul Krugman and President Obama for demagoguery over word voucher—arguing that the current health care law relies on vouchers.[20] He argues that the current Medicare program is unsustainable and that we have no choice but to embrace a plan with vouchers.[21] In order to highlight his Purple Plans, Kotlikoff ran for the nomination of the Americans Elect platform in its short-lived effort to field a third party candidate in the 2012 Presidential election.
Political parties
Kotlikoff fervently dislikes both political parties and has called for a third party.[22] In January 2012, Kotlikoff announced his plans to run as a third party candidate for President of the United States in 2012. Kotlikoff said he would seek the presidential nomination of the non-partisan advocacy group Americans Elect.[1][23][24] He announced in May that he would also seek the nomination of the Reform Party of the United States,[25] but ended the bid after the Americans Elect board decided to not field a 2012 presidential ticket.[26]
Other ventures
Kotlikoff is the President of Economic Security Planning, Inc., a company that markets ESPlanner, an economics-based personal financial planning software program,[27] a simplified version of which is available on-line for free use by the public,[28] and “Maximize My Social Security”, a software program that helps Americans decide which Social Security benefits to take and when, to get the highest lifetime benefits.[29]
Books
The Economic Consequences of the Vickers Commission, Civitas, 2012.
The Clash of Generations, (with Scott Burns), MIT Press, 2012.
Jimmy Stewart is Dead – Ending the World’s Ongoing Financial Plague with Limited Purpose Banking. John Wiley and Sons, 2010.
Spend ‘Til the End – The Revolutionary Guide to Raising Your Living Standard, Today and When You Retire. Simon & Schuster, (with Scott Burns), 2008.
The Healthcare Fix – Universal Insurance for All Americans, MIT Press, 2007.
The Coming Generational Storm, (with Scott Burns), MIT Press, 2004.
Generational Policy, The 2002 Caroli Lectures, MIT Press, 2003.
Essays on Saving, Bequests, Altruism, and Life-Cycle Planning, MIT Press, 2001.
Generational Accounting Around the World, co-edited with Alan Auerbach and Willi Leibfritz, NBER volume, University of Chicago Press, 1999.
Macroeconomics: An Integrated Approach Second Edition, (with Alan Auerbach), MIT Press, 1998.
Macroeconomics: An Integrated Approach (with Alan Auerbach), Southwestern Publishing Co., 1994.
Generational Accounting, The Free Press, 1992.
What Determines Savings, MIT Press, 1989.
The Wage Carrot and the Pension Stick: Retirement Benefits and Labor Force Participation(with David Wise), The W. E. Upjohn Institute for Employment Research, 1989.
Dynamic Fiscal Policy (with Alan Auerbach), Cambridge University Press, 1987.
Pensions in the American Economy (with Daniel Smith), University of Chicago Press, 1983.
Get What’s Yours: The Secrets to Maxing Out Your Social Security (with Philip Moeller and Paul Solman), Simon and Schuster, 2015.[30]
Laurence J. Kotlikoff and Scott Burns (2004). The Coming Generational Storm: What You Need to Know about America’s Economic Future’. MIT Press. ISBN0-262-11286-8. Descriptionand chapter-preview links, p. vii.
Laurence J. Kotlikoff and Scott Burns, 2008. Spend ’til the End: The Revolutionary Guide to Raising Your Living Standard – Today and When You Retire’, Simon & Schuster. Descriptionand Preview link to chapter links, via right-arrow at top to pp. 11–12.
^Gokhale, Jagadeesh; Kotlikoff, Laurence J.; Sabelhaus, John (May 1996). “Understanding the Postwar Decline in U.S. Saving: A Cohort Analysis”. NBER Working Paper No. 5571. doi:10.3386/w5571.
^ Jump up to:abcdKotlikoff, Laurence (April 5, 2011). Jimmy Stewart Is Dead: Ending the World’s Ongoing Financial Plague with Limited Purpose Banking. Wiley. ISBN978-1118011331.
The national debt exceeded $21 trillion for the first time on Thursday, a little more than six months after it hit first $20 trillion on Sept. 8.
The national debt was $21.031 trillion on Thursday. The government releases total debt figures each business day, but it lags by one day.
Federal borrowing has been on the rise again since February, when Congress passed legislation to suspend the debt ceiling. That move allowed the government to borrow as much as it needs to fund the activities approved by Congress.
Under the law passed in February, the government will not face any borrowing limit until March 1, 2019. At its current pace, the government is on track to add at least $1 trillion to the national debt by then.
For example, the debt grew by more than half a trillion dollars in the six weeks since the debt ceiling was lifted on Feb. 9.
A large part of the national debt reflects the federal budget deficit, or the amount of spending above the revenues collected by the government. But the debt is rising faster than the amount of the budget deficit, as it also reflects things like federal lending for student loans and mortgage programs.
Peter G. Peterson Foundation President Michael Peterson said the milemarker is just the beginning, as Congress has just agreed to spend even more.
“Our national debt reached a staggering $21 trillion today, having grown by $1 trillion in just the past six months,” he said. “Worse yet, this unfortunate milestone has only just begun to include the effects of the recent fiscally irresponsible tax and spending legislation, which added more debt on top of an already unsustainable trajectory.”
World’s Greatest Memory and Trump’s La la Land | David Stockman’s Warning
Published on Apr 29, 2017
You can also check out the following:
David Stockman’s Warning
Jim Sinclair
James Turk
Web bot
Silver News
Gold
Bix Weir
RoadToRoota
Road To Roota
Kyle Bass
Realist News
Greg Mannarino
Rob Kirby
Reluctant Preppers
The Next Newss
Info Wars
Maneco64
Mike Maloney
Gold Silver
Eric Sprott
Jim Rickards
David Morgan
Peter Schiff
Max Keiser
Robert Kiyosaki
SilverDoctors
Finance and Liberty
Nomi Prins
Jim Willie
Clif High
Martin Armstrong
Ron Paul
Pastor Williams
Bill Holter
Bo Polny
Jim Sinclair
James Turk
Clif High
Stockman on Trump’s Tax Plan: ‘Borrowing Money Is Not the Way to Prosperity’
David Stockman: National debt is ticking time bomb
David Stockman: Trump doesn’t know anything about tax policy
David Stockman: We’re wasting money on defense
David Stockman on Trump’s wall: I think it’s a stupid idea
David Stockman: Economy is on the edge of ruin
David Stockman: We’ll have a fiscal bloodbath, not fiscal stimulus
David Stockman Trumps Efforts To Drain The Swamp
David Stockman – Trump Will Create A Debt Crisis Like Never Before – 28 Feb 17 | Gazunda
David Stockman – Global Deflation As A Result Of Massive Over-investment – 9 Feb 16 | Gazunda
David Stockman Speaks on Shakeup Expected At The White House. #TheWhiteHouse
David Stockman: We are at peak debt headed for a recession
David Stockman on Trump’s infrastructure spending
RTD News: “A 20 Trillion Ticking Time Bomb…” – David Stockman
David Stockman: We have a massive bubble in the market
David Stockman -Trump Can’t Stop Market Crash Predicts Reagan’s Budget Director
Stockman: U.S. election is Brexit on steroids
[74] David Stockman | One Big Fat Ugly Bubble
David Stockman: Lester Holt was in the tank for Hillary Clinton
Stockman: Janet Yellen is a clueless economist
David Stockman: What the Fed and the Feds Have Done to Us, and How to Reverse It
David Stockman: Why a Trump Presidency Is Very Possible
What Trump Should Do – With David Stockman
David Stockman Bubbles, Economic Collapse Coming 1
Robert Kiyosaki David Stockman discuss the biggest financial crisis in US history present,future
David Stockman: The US Is Fiscally, Morally, Intellectually Bankrupt
RTD News: “There Will Be No Rescue Out Of Washington This Time” – David Stockman
David Stockman – Conversations with Casey
How Crony Capitalism Corrupts the Free Market | David Stockman
The Forgotten Cause of Sound Money | David Stockman
Stockman: Market Will Not Be Pretty Under Trump
[Ed. Note: To see exactly what this former Reagan insider has to say about Trump and specifically what he believes must be done to drain the swamp, David Stockman is sending out a copy of his book Trumped! A Nation on the Brink of Ruin… And How to Bring It Back out to any American willing to listen. To learn how to get your free copy CLICK HERE.]
As bonds break a three day win streak and the U.S market hitting new record highs with a trifecta of records, CNBC was roaring about what to expect going forward. The Daily Reckoning contributor David Stockman joined Courtney Reagan to discuss what to expect going forward.
After the CNBC host positioned the critiques offered by David Stockman of the Trump administration she asked whether that would continue given the state of the market. Stockman did not mix words beginning the conversation with, “What’s going on today is complete insanity. The market is apparently pricing in a huge Trump stimulus package, when if you just look at the real world out there the only thing that is going to happen is a fiscal bloodbath and a White House train wreck like never before in U.S history.
How much more evidence do these so called traders need? Trump is lost in Twitter-land and he is out of control. He is turning out to be a complete jackass in the Oval Office. Co-President Bannon is off the deep end on terrorism, travel bans, Mexican walls, immigrant bashing and protectionism.”
David Stockman is a former Reagan Administration official who was the Office of Management and Budget Director. He also served as a two-term Congressman from the great state of Michigan. His latest book, Trumped! A Nation on the Brink of Ruin… And How to Bring It Back is out now. It offers his insight and exclusive analysis on exactly what the newly elected president must do in order to succeed in the White House. To get your own FREE copy, CLICK HERE to learn how.
“[They are] having nothing to do with the economic agenda and Trump has got an empty economic bench. He’s got no Secretary of the Treasury, no Office of Management and Budget, no Council of Economic Advisor Chairman. By this time, when I was there with the Reagan Administration, the plan was ready to go and he was going to Congress within a couple of days into February. We have a debt ceiling freight train coming down the road which will hit March 15 and then the cash will start running out and the system will be on edge. All of the continuing resolutions expire in April.”
“They are going to spend the year trying to repeal and replace Obamacare and it will be a fiasco. Nothing is going to happen this year. I don’t even think they can pass the budget resolution. There is going to be no tax action this year. If there is any bill next year it is going to be deficit neutral. Which means it is not going to add $15 to earnings like these crazy people expect.”
“Why would you be trading in this market, with this kind of chaos emerging everywhere at twenty six times trailing earnings? That’s where we are. It is completely crazy and it is only a question of how many more days or weeks that this kind of fantasy land can last.”
Courtney Reagan then pressed back asking, “At what point do you give in and admit that [Trump] is atypical but maybe he could get things done? I mean, look at all of the CEO’s that Trump has met with.” The former Reagan insider remarked that, “CEO’s come and go with every president. They came in with Reagan, they tell a president what they want to hear. These guys are just selling the song and dance about how many jobs they’re going to create in the next five years. They have no clue.”
“If we have a recession in the next five years, which surely we will, because recessions have not been outlawed and we haven’t had one for ten years. None of this stuff is going to happen. This is meaningless. What is meaningful is that Trump is out of control. This tweeting and getting off track on all of this terrorism stuff. This is a sign that there is going to be no governing coalition and that all of this fiscal stimulus expected by Wall Street is a complete fantasy. It can’t happen.”
Rickards’ Reaction: A Model For Predicting Financial Collapse
Jim Rickards’ reveals the only model you need to safe guard your wealth from the next financial crisis. In this 5-part exclusive framework a former Wall Street and intelligence community insider breaks down his analysis into a model to warm of impending financial collapse. The model is designed to offer the easiest and fastest way to apply hard facts, science and good sound analysis. Sign up for the Daily Reckoning e-letter today and receive your FREE report.
We will NOT share your email address
When CNBC then turned over the camera to a day trader who asked about the positive sentiment that exists within the market regarding Trump and his plan to deregulate Stockman stayed true to message. “Trump is just putting out press releases and the guise of Executive Orders. All of this stuff is going to get litigated, it goes through a rulemaking process, that takes years. So the relief on regulation will be important, but it way down the road and it won’t be that impactful.”
“The second thing, is we’re at 92 months in this expansion already. It is running out of gas. You can’t expect it to run forever. That is seemingly what is priced in by the market.”
“The third thing is, we have a giant debt and deficit problem. The debt ceiling is coming back into play it will be 20 trillion when it freezes in on March 15th. I’ll tell you this, people aren’t paying attention to the fact that Trump will never get a debt ceiling increase through the Congress without a government shutdown. When that happens it is, “bar the doors” because nobody is expecting it. We need to look at the facts, not the hopes.”
As the CNBC affirmed, it is not clear that the market is just going to drop tomorrow and history will repeat itself, Stockman repositioned. “The market it clearly factoring in a big Trump stimulus and I think anybody down there would admit if it doesn’t happen, if we get zero tax cuts, if we get a fiscal bloodbath in the Washington I am describing – the market is not going to stay where it is today at these absurd multiples of earnings.”
“This is all based on the idea that there is going to be a surge of economic growth and that profits are going to come back from about $89 a share by basis, where they were during the last twelve months, to a potential $110 or $130. My argument is there is not going to be any economic rebound. There is not going to be any profit surge. Therefore the market will be repricing dramatically downward once it is clear.”
Another CNBC analysis asked why – with the positive trends in jobless claims, manufacturing increasing, interest rates at near record lows – would the market not close out the year near record levels? “The market is assuming that profits are going to rebound. That we are not going to have any market dislocation and that nobody is going to be pushing back on Trump. It is hard to understand how people watching the day-to-day action down there could believe that.”
“Everybody is pushing back on Trump, he can’t even get his cabinet approved. He’s going to be bogged down in a Supreme Court fight, he’s going to be bogged down in a fight over a ridiculous travel ban. The idea that there is not going to be pushback is naive. What there is going to be is a train wreck. It is already clear that the people in the White House have no idea what they’re doing and it is only a matter of time before this honeymoon goodwill evaporates and the politicians get down to doing what they do best. Which is to undermine and obstruct anything that might be positive.”
When finally asked whether there is anything positive that would make him turn bullish in the near future he responded affirmably, “No, because Trump is inheriting thirty years of a disaster created by his predecessors. We have to take this $20 trillion of debt seriously. There is $10 trillion more built in under current policy, and that is without a dime of Trump tax cuts, infrastructure or stimulus. There is going to be a tremendous fiscal crisis in the years ahead which will prevent any of the kind of action that the “stimulus junkies” are looking for.
Stockman was born in Fort Hood, Texas, the son of Allen Stockman, a fruit farmer, and Carol (née Bartz).[2] He is of German descent, and his family’s surname was originally “Stockmann”.[3] He was raised in a conservative family, and his maternal grandfather, William Bartz, was a Republican county treasurer for 30 years.[4][5] Stockman was educated at public schools in Stevensville, Michigan. He graduated from Lakeshore High School in 1964[6] and received a B.A. in History from Michigan State University in 1968. He was a graduate student at Harvard University, 1968–1970 studying theology
Stockman was one of the most controversial OMB directors ever appointed, also known as the “Father of Reaganomics.” He resigned in August 1985. Committed to the doctrine of supply-side economics, he assisted in the passing of the “Reagan Budget” (the Gramm-Latta Budget), which Stockman hoped would curtail the “welfare state“. He thus gained a reputation as a tough negotiator with House Speaker Tip O’Neill‘s Democratic-controlled House of Representatives and Majority Leader Howard Baker‘s Republican-controlled Senate. During this period, Stockman became well known to the public during the contentious political wrangling concerning the role of the federal government in American society.
Stockman’s influence within the Reagan Administration was weakened after the Atlantic Monthly magazine published the infamous 18,246 word article, “The Education of David Stockman”,[7] in its December 1981 issue, based on lengthy interviews Stockman gave to reporter William Greider.
Stockman was quoted as referring to Reagan’s tax act in these terms: “I mean, Kemp-Roth [Reagan’s 1981 tax cut] was always a Trojan horse to bring down the top rate…. It’s kind of hard to sell ‘trickle down.’ So the supply-side formula was the only way to get a tax policy that was really ‘trickle down.’ Supply-side is ‘trickle-down’ theory.”[7] Of the budget process during his first year on the job, Stockman was quoted as saying, “None of us really understands what’s going on with all these numbers,” which was used as the subtitle of the article.[7]
After “being taken to the woodshed by the president” because of his candor with Greider, Stockman became concerned with the projected trend of increasingly large federal deficits and the rapidly expanding national debt. On 1 August 1985, he resigned from OMB and later wrote a memoir of his experience in the Reagan Administration titled The Triumph of Politics: Why the Reagan Revolution Failed in which he specifically criticized the failure of congressional Republicans to endorse a reduction of government spending to offset large tax decreases to avoid the creation of large deficits and an increasing national debt.
Fiscal legacy
President Jimmy Carter’s last fiscal year budget ended with a $79.0 billion budget deficit (and a national debt of $907,701,000,000 [8] as of September 30, 1980), ending during the period of David Stockman’s and Ronald Reagan’s first year in office, on October 1, 1981.[9] The gross federal national debt had just increased to $1.0 trillion during October 1981 ($998 billion on 30 September 1981, up from $907.7 billion during the last full fiscal year of the Carter administration[8]).
By 30 September 1985, four and a half years into the Reagan administration and shortly after Stockman’s resignation from the OMB during August 1985, the gross federal debt was $1.8 trillion.[8] Stockman’s OMB work within the administration during 1981 until August 1985 was dedicated to negotiating with the Senate and House about the next fiscal year’s budget, executed later during the autumn of 1985, which resulted in the national debt becoming $2.1 trillion at fiscal year end 30 September 1986.[8] Reaganomics had just begun.
In 1981, Stockman received the Samuel S. Beard Award for Greatest Public Service by an Individual 35 Years or Under, an award given out annually by Jefferson Awards.[10]
Business career
After leaving government, Stockman joined the Wall St. investment bank Salomon Brothers and later became a partner of the New York–based private equity company, the Blackstone Group.[11]:125–127 His record was mixed at Blackstone, with some very good investments, such as American Axle, but also failures, including Haynes International and Republic Technologies.[11]:144–147 During 1999, after Blackstone CEO Stephen A. Schwarzman curtailed Stockman’s role in managing the investments he had developed,[11]:146 Stockman resigned from Blackstone to start his own private equity fund company, Heartland Industrial Partners, L.P., based in Greenwich, Connecticut.[12]
On the strength of his investment record at Blackstone, Stockman and his partners raised $1.3 billion of equity from institutional and other investors. With Stockman’s guidance, Heartland used a contrarian investment strategy, buying controlling interests in companies operating in sectors of the U.S. economy that were attracting the least amount of new equity: auto parts and textiles. With the help of about $9 billion in Wall Street debt financing, Heartland completed more than 20 transactions in less than 2 years to create four portfolio companies: Springs Industries, Metaldyne, Collins & Aikman, and TriMas. Several major investments performed very poorly, however. Collins & Aikman filed for bankruptcy during 2005 and when Heartland sold Metaldyne to Asahi Tec Corp. during 2006, Heartland lost most of the $340 million of equity it had invested in the business.[13]
Collins & Aikman Corp.
During August 2003, Stockman became CEO of Collins & Aikman Corporation, a Detroit-based manufacturer of automotive interior components. He was ousted from that job days before Collins & Aikman filed for bankruptcy under Chapter 11 on May 17, 2005.
Criminal and civil charges
On March 26, 2007, federal prosecutors in Manhattan indicted Stockman in “a scheme… to defraud [Collins & Aikman]’s investors, banks and creditors by manipulating C&A’s reported revenues and earnings.” The United States Securities and Exchange Commission also brought civil charges against Stockman related to actions that he performed while CEO of Collins & Aikman.[14] Stockman suffered a personal financial loss, over $13 million, along with losses suffered by as many as 15,000 Collins & Aikman employees worldwide.
Stockman said in a statement posted on his law firm’s website that the company’s end was the consequence of an industry decline, not due to fraud.[15] On January 9, 2009, the US Attorney’s Office announced that it did not intend to prosecute Stockman for this case.[16]
Web site
In March 2014 Stockman launched a web based daily periodical, David Stockman’s Contra Corner featuring both his own articles and those from leading contrarian thinkers on geopolitics, economics, and finance.
This page is a candidate to be copied to Wikiquote using the Transwiki process. If the page can be expanded into an encyclopedic article, rather than a list of quotations, please do so and remove this message.
“[Social Security] has to be means-tested. And Medicare needs to be means-tested […] Let the Bush tax cuts expire. Let the capital gains go back to the same rate as ordinary income.”[20]
“The Republican Party has totally abdicated its job in our democracy, which is to act as the guardian of fiscal discipline and responsibility. They’re on an anti-tax jihad — one that benefits the prosperous classes.”[21]
“I invest in anything that Bernanke can’t destroy, including gold, canned beans, bottled water and flashlight batteries.”[22]
“Ninety-two percent of the wealth is owned by five percent of the people.” (Bloomberg TV 2013)
“[T]he Republican Party was hijacked by modern imperialists during the Reagan era. As a consequence, the conservative party cannot perform its natural function as watchdog of the public purse because it is constantly seeking legislative action to provision a vast war machine of invasion and occupation.” [23]
Bibliography
The Reagan Economic Plan, 1981
The Triumph of Politics: Why the Reagan Revolution Failed, Harper & Row, 1986, ISBN 9780060155605
The Great Deformation: The Corruption of Capitalism in America, PublicAffairs, 2013, ISBN 9781586489120
Trumped!: A Nation on the Brink of Ruin, and How to Bring it Back, 2016
^ Jump up to:ab“Collins & Aikman seeks to emerge from bankruptcy,” Bloomberg News article by Jeff Bennett, published in the newspaper The Advocate of Stamford and (identical version, perhaps with changes by the local editor in the common business section for both newspapers) in the Greenwich Time on September 5, 2006, page A7, The Advocate
Jump up^David Carey and Lou Whiteman, “PE firms find buyer for Metaldyne,” The Deal, Sept. 1, 2006.
What the Fed’s interest rate hike means for the economy
Stocks rally on Fed rate hike
Fed Hikes Rates, Signals More Coming
Is the Federal Reserve behind the curve?
What The Fed Rate Hike Means For Consumers
We Are Dangerously Close to a Recession
MARC FABER World Economy Grinding to a Halt. Don’t Trade With Leverage
Marc Faber : Volatility will pick up ‘massively’ , 30.1.2017
Marc Faber Warns : The Market is on the verge of a meaningful correction
Trump, China & World War 3 – Jim Rogers
The Whole System is Riddled With Corruption – James Dale Davidson Interview
Keiser Report: Rise of the Machines (E1043)
Keiser Report: Bloodletting Among Retailers (E1044)
David Stockman Interview Trump to Face Imploding Economy in 2017
David A. Stockman’s TEARS APART Trump’s Economic Plan
The Coming Big Freeze – Jim Rickards – The Daily Reckoning – Road to Ruin
James Rickards 2017 The Fed is Tapped Out & End Result is Ice Nine for Gold
AMTV Truth Exposed Prepare For The Imminent Global Economic Collapse 2017 Stock MARKET CRA
Fed rate hike: Central bank signals faster pace in 2017
Milton Friedman – The Federal Reserve Caused Great Depression
Milton Friedman on the Great Depression, Bank Runs & the Federal Reserve
Milton Friedman – Abolish The Fed
Milton Friedman: The Future of Freedom
Milton Friedman – Why Economists Disagree
Milton Friedman – The role of government in a free society
Milton Friedman Interview with Dallas Fed President Richard W. Fisher
Ep. 228: Inflation Finally Rears Its Head
What happens when the Fed raises rates
How Interest Rates Affect the Market
When Interest Rates Rise: Winners and Losers
ECONOMIC COLLAPSE: Trump to Declare Bankruptcy on U.S.
What’s all the Yellen About? Monetary Policy and the Federal Reserve: Crash Course Economics #10
The Federal Reserve Explained in 3 Minutes
Quantitative Easing Explained
The Collapse of The American Dream Explained in Animation
Who Controls the Money Controls the World
The Story of Your Enslavement
Financial Balance
“The Bernanke” explains Financial Repression
Financial Repression
Carmen Reinhart: Financial Repression Requires A Captive Audience | McAlvany Commentary
50 YEAR OLD CARTOON PREDICTS THE FUTURE !!! NWO !!!
Yellen Calms Fears Fed’s Policy Trigger Finger Is Getting Itchy
by Rich Miller, Christopher Condon , and Jeanna Smialek
March 15, 2017, 1:00 PM CDT March 15, 2017, 5:02 PM CDT
Policy makers still project three total rate hikes for 2017
FOMC sticks with ‘gradual’ plan for removing accommodation
Fed Raises Benchmark Lending Rate a Quarter Point
Federal Reserve Chair Janet Yellen sought to reassure investors that the central bank’s latest interest-rate increase wasn’t a paradigm shift to a trigger-happy policy driven by fears of faster inflation.
Speaking to reporters after the Fed’s quarter percentage-point move on Wednesday, Yellen said the central bank was willing to tolerate inflation temporarily overshootingits 2 percent goal and that it intended to keep its policy accommodative for “some time.”
“The simple message is the economy’s doing well. We have confidence in the robustness of the economy and its resilience to shocks,” she said.
As a result, the Fed is sticking with its policy of gradually raising interest rates, Yellen said. In their first forecasts in three months, Fed policy makers penciled in two more quarter-point rate increases this year and three in 2018, unchanged from their projections in December.
Today’s decision “does not represent a reassessment of the economic outlook or of the appropriate course for monetary policy,” the Fed chief said.
Speculation of a more aggressive Fed had mounted in recent days after a host of central bank officials, including Yellen herself, went out of their way to telegraph to financial markets that a rate hike was imminent. The expectations were further fueled by news of rising inflation.
Stocks Advance
Stocks rose and bond yields fell as investors viewed the statement from the Federal Open Market Committee and Yellen’s remarks afterward as a sign that the Fed isn’t in a hurry to remove monetary stimulus. The FOMC raised the target range for the federal funds rate to 0.75 percent to 1 percent, as expected, but Yellen’s lack of urgency to snuff out inflation was a surprise.
R.J. Gallo, a fixed-income investment manager at Federated Investors in Pittsburgh, said the chorus of Fed speakers before this meeting led investors to expect a move up in the number of projected rate hikes this year, and even upgrades by Fed officials in the levels of inflation and growth they anticipated.
None of that materialized.
“You didn’t get any of those things,” Gallo said, which explains why Treasury yields quickly dropped after the Fed released the FOMC statement and a new set of economic projections. “The expectation that Fed was getting more hawkish had to come out of the market.”
The U.S. economy has mostly met the central bank’s goals of full employment and stable prices, and may get further support if President Donald Trump delivers promised fiscal stimulus. Investor and business confidence has soared since Trump won the presidency in November, buoyed by his vows to cut taxes, lift infrastructure spending and ease regulations.
Still, the data don’t show an economy that’s heating up rapidly — a point Yellen herself made after the third rate hike since the 2007-2009 recession ended. In fact, the economy may have “more room to run,” she said.
Stronger business and consumer confidence hasn’t yet translated into increased investment and spending, said Yellen.
“It’s uncertain just how much sentiment actually impacts spending decisions, and I wouldn’t say at this point that I have seen hard evidence of any change in spending decisions,” said the Fed Chair. “Most of the business people that we’ve talked to also have a wait-and-see attitude.”
Retail sales in February grew at the slowest pace since August, a government report showed earlier Wednesday. The Atlanta Fed’s model for GDP predicts an expansion of 0.9 percent in the first quarter, less than a third the pace Trump is aiming for.
Fiscal Stimulus
Asked about the potential for a fiscal boost, Yellen made clear the Fed is still waiting for more concrete policy plans to emerge from the Trump administration before adapting monetary policy in reaction.
“There is great uncertainty about the timing, the size and the character of policy changes that may be put in place,” Yellen said. “I don’t think that’s a decision or set of decisions that we need to make until we know more about what policy changes will go into effect.”
Yellen disputed suggestions that the Fed was on a collision course with the Trump administration over its plans to foster faster economic growth through tax cuts and deregulation. “We would welcome stronger economic growth in the context of price stability,” she said.
She said she had met Trump briefly and had gotten together a couple of times with Treasury Secretary Steven Mnuchin to discuss the economy and financial regulation.
Further underscoring their lack of urgency, Fed officials repeated a commitment to maintain their balance-sheet reinvestment policy until rate increases were well under way. Yellen said officials had discussed the process of reducing the balance sheet gradually, but had made no decisions and would continue to debate the topic.
Policy makers forecast inflation will reach 1.9 percent in the fourth quarter this year, and 2 percent in both 2018 and 2019, according to quarterly median estimates released with the FOMC statement. The Fed’s preferred measure of inflation rose 1.9 percent in the 12 months through January, just shy of its target.
Yellen pointed out, though, that core inflation continues to run somewhat further below 2 percent. That rate, which strips out food and energy costs, stood at 1.7 percent in January. The Fed’s new forecast for the core rate at the end of this year edged up to 1.9 percent, from 1.8 percent in December.
“The committee will carefully monitor actual and expected inflation developments relative to its symmetric inflation goal,” the Fed said. Discussing the word symmetric in the statement, Yellen said during her press conference that the Fed was not shooting to push inflation over 2 percent but recognized that it could temporarily go above it. Two percent is a target, she reiterated, not a ceiling.
By Evan Tarver | Updated March 10, 2017 — 3:35 PM EST
SHARE
Changes in the federal funds rate will always affect the U.S. dollar. When the Federal Reserve increases the federal funds rate, it normally reduces inflationary pressure and works to appreciate the dollar.
Since June 2006, however, the Fed has maintained a federal funds rate of close to 0%. In the wake of the 2008 financial crisis, the federal funds rate fluctuated between 0-0.25%, and is now 0.75%.
The Fed used this monetary policy to help achieve maximum employment and stable prices. Now that the 2008 financial crisis has largely subsided, the Fed will look to increase interest rates to continue to achieve employment and to stabilize prices.
Inflation of the U.S. Dollar
The best way to achieve full employment and stable prices is to set the inflation rate of the dollar at 2%. In 2011, the Fed officially adopted a 2% annual increase in the price index for personal consumption expenditures as its target. When the economy is weak, inflation naturally falls; when the economy is strong, rising wages increase inflation. Keeping inflation at a growth rate of 2% helps the economy grow at a healthy rate.
Adjustments to the federal funds rate can also affect inflation in the United States. The Fed controls the economy by increasing interest rates when the economy is growing too fast. This encourages people to save more and spend less, reducing inflationary pressure. Conversely, when the economy is in a recession or growing too slowly, the Fed reduces interest rates to stimulate spending, which increases inflation.
During the 2008 financial crisis, the low federal funds rate should have increased inflation. Over this period, the federal funds rate was set near 0%, which encouraged spending and would normally increase inflation.
However, inflation is still well below the 2% target, which is contrary to the normal effects of low interest rates. The Fed cites one-off factors, such as falling oil prices and the strengthening dollar, as the reasons why inflation has remained low in a low interest environment.
The Fed believes that these factors will eventually fade and that inflation will increase above the target 2%. To prevent this eventual increase in inflation, hiking the federal funds rate reduces inflationary pressure and cause inflation of the dollar to remain around 2%.
Appreciation of the U.S. Dollar
Increases in the federal funds rate also result in a strengthening of the U.S. dollar. Other ways that the dollar can appreciate include increases in average wages and increases in overall consumption. However, although jobs are being created, wage rates are stagnant.
Without an increase in wage rates to go along with a strengthening job market, consumption won’t increase enough to sustain economic growth. Additionally, consumption remains subdued due to the fact that the labor force participation rate was close to its 35-year low in 2015. The Fed has kept interest rates low because a lower federal funds rate supports business expansions, which leads to more jobs and higher consumption. This has all worked to keep appreciation of the U.S. dollar low.
However, the U.S. is ahead of the other developed markets in terms of its economic recovery. Although the Fed raises rates cautiously, the U.S. could see higher interest rates before the other developed economies.
Overall, under normal economic conditions, increases in the federal funds rate reduce inflation and increase the appreciation of the U.S. dollar.
Not to be confused with economic repression, a type of political repression.
Financial repression refers to “policies that result in savers earning returns below the rate of inflation” in order to allow banks to “provide cheap loans to companies and governments, reducing the burden of repayments”.[1] It can be particularly effective at liquidating government debtdenominated in domestic currency.[2] It can also lead to a large expansions in debt “to levels evoking comparisons with the excesses that generated Japan’s lost decade and the Asian financial crisis” in 1997.[1]
Creation or maintenance of a captive domestic market for government debt, achieved by requiring banks to hold government debt via capital requirements, or by prohibiting or disincentivising alternatives.
Government restrictions on the transfer of assets abroad through the imposition of capital controls.
These measures allow governments to issue debt at lower interest rates. A low nominal interest rate can reduce debt servicing costs, while negative real interest rates erodes the real value of government debt.[5] Thus, financial repression is most successful in liquidating debts when accompanied by inflation and can be considered a form of taxation,[6] or alternatively a form of debasement.[7]
The size of the financial repression tax for 24 emerging markets from 1974 to 1987. Their results showed that financial repression exceeded 2% of GDP for seven countries, and greater than 3% for five countries. For five countries (India, Mexico, Pakistan, Sri Lanka, and Zimbabwe) it represented approximately 20% of tax revenue. In the case of Mexico financial repression was 6% of GDP, or 40% of tax revenue.[8]
Financial repression is categorized as “macroprudential regulation“—i.e., government efforts to “ensure the health of an entire financial system.[2]
Examples
After World War II
Financial repression “played an important role in reducing debt-to-GDP ratios after World War II” by keeping real interest rates for government debt below 1% for two-thirds of the time between 1945 and 1980, the United States was able to “inflate away” the large debt (122% of GDP) left over from the Great Depression and World War II.[2] In the UK, government debt declined from 216% of GDP in 1945 to 138% ten years later in 1955.[9]
China
China‘s economic growth has been attributed to financial repression thanks to “low returns on savings and the cheap loans that it makes possible”. This has allowed China to rely on savings-financed investments for economic growth. However, because low returns also dampens consumer spending, household expenditures account for “a smaller share of GDP in China than in any other major economy”.[1] However, as of December 2014, the People’s Bank of China “started to undo decades of financial repression” and the government now allows Chinese savers to collect up to a 3.3% return on one-year deposits. At China’s 1.6% inflation rate, this is a “high real-interest rate compared to other major economies”.[1]
After the 2008 economic recession
In a 2011 NBER working paper, Carmen Reinhart and Maria Belen Sbrancia speculate on a possible return by governments to this form of debt reduction in order to deal with high debt levels following the 2008 economic crisis.[5]
Critics[who?] argue that if this view was true, investors (i.e., capital-seeking parties) would be inclined to demand capital in large quantities and would be buying capital goods from this capital. This high demand for capital goods would certainly lead to inflation and thus the central banks would be forced to raise interest rates again. As a boom pepped by low interest rates fails to appear these days in industrialized countries, this is a sign that the low interest rates seem to be necessary to ensure an equilibrium on the capital market, thus to balance capital-supply—i.e., savers—on one side and capital-demand—i.e., investors and the government—on the other. This view argues that interest rates would be even lower if it were not for the high government debt ratio (i.e., capital demand from the government).
Free-market economists argue that financial repression crowds out private-sector investment, thus undermining growth. On the other hand, “postwar politicians clearly decided this was a price worth paying to cut debt and avoid outright default or draconian spending cuts. And the longer the gridlock over fiscal reform rumbles on, the greater the chance that ‘repression’ comes to be seen as the least of all evils”.[11]
Also, financial repression has been called a “stealth tax” that “rewards debtors and punishes savers—especially retirees” because their investments will no longer generate the expected return, which is income for retirees.[10][12] “One of the main goals of financial repression is to keep nominal interest rates lower than they would be in more competitive markets. Other things equal, this reduces the government’s interest expenses for a given stock of debt and contributes to deficit reduction. However, when financial repression produces negative real interest rates (nominal rates below the inflation rate), it reduces or liquidates existing debts and becomes the equivalent of a tax—a transfer from creditors (savers) to borrowers, including the government.”[2]
The interest rate that the borrowing bank pays to the lending bank to borrow the funds is negotiated between the two banks, and the weighted average of this rate across all such transactions is the federal funds effective rate.
The federal funds target rate is determined by a meeting of the members of the Federal Open Market Committee which normally occurs eight times a year about seven weeks apart. The committee may also hold additional meetings and implement target rate changes outside of its normal schedule.
Financial Institutions are obligated by law to maintain certain levels of reserves, either as reserves with the Fed or as vault cash. The level of these reserves is determined by the outstanding assets and liabilities of each depository institution, as well as by the Fed itself, but is typically 10%[4] of the total value of the bank’s demand accounts (depending on bank size). In the range of $9.3 million to $43.9 million, for transaction deposits (checking accounts, NOWs, and other deposits that can be used to make payments) the reserve requirement in 2007-2008 was 3 percent of the end-of-the-day daily average amount held over a two-week period. Transaction deposits over $43.9 million held at the same depository institution carried a 10 percent reserve requirement.
For example, assume a particular U.S. depository institution, in the normal course of business, issues a loan. This dispenses money and decreases the ratio of bank reserves to money loaned. If its reserve ratio drops below the legally required minimum, it must add to its reserves to remain compliant with Federal Reserve regulations. The bank can borrow the requisite funds from another bank that has a surplus in its account with the Fed. The interest rate that the borrowing bank pays to the lending bank to borrow the funds is negotiated between the two banks, and the weighted average of this rate across all such transactions is the federal funds effective rate.
The nominal rate is a target set by the governors of the Federal Reserve, which they enforce by open market operations and adjusting the interest paid on required and excess reserve balances. That nominal rate is almost always what is meant by the media referring to the Federal Reserve “changing interest rates.” The actual federal funds rate generally lies within a range of that target rate, as the Federal Reserve cannot set an exact value through open market operations.
Another way banks can borrow funds to keep up their required reserves is by taking a loan from the Federal Reserve itself at the discount window. These loans are subject to audit by the Fed, and the discount rate is usually higher than the federal funds rate. Confusion between these two kinds of loans often leads to confusion between the federal funds rate and the discount rate. Another difference is that while the Fed cannot set an exact federal funds rate, it does set the specific discount rate.
The federal funds rate target is decided by the governors at Federal Open Market Committee (FOMC) meetings. The FOMC members will either increase, decrease, or leave the rate unchanged depending on the meeting’s agenda and the economic conditions of the U.S. It is possible to infer the market expectations of the FOMC decisions at future meetings from the Chicago Board of Trade (CBOT) Fed Funds futures contracts, and these probabilities are widely reported in the financial media.
Applications
Interbank borrowing is essentially a way for banks to quickly raise money. For example, a bank may want to finance a major industrial effort but may not have the time to wait for deposits or interest (on loan payments) to come in. In such cases the bank will quickly raise this amount from other banks at an interest rate equal to or higher than the Federal funds rate.
Raising the federal funds rate will dissuade banks from taking out such inter-bank loans, which in turn will make cash that much harder to procure. Conversely, dropping the interest rates will encourage banks to borrow money and therefore invest more freely.[5] This interest rate is used as a regulatory tool to control how freely the U.S. economy operates.
By setting a higher discount rate the Federal Bank discourages banks from requisitioning funds from the Federal Bank, yet positions itself as a lender of last resort.
Comparison with LIBOR
Though the London Interbank Offered Rate (LIBOR) and the federal funds rate are concerned with the same action, i.e. interbank loans, they are distinct from one another, as follows:
The target federal funds rate is a target interest rate that is set by the FOMC for implementing U.S. monetary policies.
The (effective) federal funds rate is achieved through open market operations at the Domestic Trading Desk at the Federal Reserve Bank of New York which deals primarily in domestic securities (U.S. Treasury and federal agencies’ securities).[6]
LIBOR is based on a questionnaire where a selection of banks guess the rates at which they could borrow money from other banks.
LIBOR may or may not be used to derive business terms. It is not fixed beforehand and is not meant to have macroeconomic ramifications.[7]
Predictions by the market
Considering the wide impact a change in the federal funds rate can have on the value of the dollar and the amount of lending going to new economic activity, the Federal Reserve is closely watched by the market. The prices of Option contracts on fed funds futures (traded on the Chicago Board of Trade) can be used to infer the market’s expectations of future Fed policy changes. Based on CME Group 30-Day Fed Fund futures prices, which have long been used to express the market’s views on the likelihood of changes in U.S. monetary policy, the CME Group FedWatch tool allows market participants to view the probability of an upcoming Fed Rate hike. One set of such implied probabilities is published by the Cleveland Fed.
As of December 16, 2008, the most recent change the FOMC has made to the funds target rate is a 75 to 100 basis point cut from 1.0% to a range of zero to 0.25%. According to Jack A. Ablin, chief investment officer at Harris Private Bank, one reason for this unprecedented move of having a range, rather than a specific rate, was because a rate of 0% could have had problematic implications for money market funds, whose fees could then outpace yields.[8] This followed the 50 basis point cut on October 29, 2008, and the unusually large 75 basis point cut made during a special January 22, 2008 meeting, as well as a 50 basis point cut on January 30, 2008, a 75 basis point cut on March 18, 2008, and a 50 basis point cut on October 8, 2008.[9]
Explanation of federal funds rate decisions
When the Federal Open Market Committee wishes to reduce interest rates they will increase the supply of money by buying government securities. When additional supply is added and everything else remains constant, price normally falls. The price here is the interest rate (cost of money) and specifically refers to the Federal Funds Rate. Conversely, when the Committee wishes to increase the Fed Funds Rate, they will instruct the Desk Manager to sell government securities, thereby taking the money they earn on the proceeds of those sales out of circulation and reducing the money supply. When supply is taken away and everything else remains constant, price (or in this case interest rates) will normally rise.[10]
The Federal Reserve has responded to a potential slow-down by lowering the target federal funds rate during recessions and other periods of lower growth. In fact, the Committee’s lowering has recently predated recessions,[9] in order to stimulate the economy and cushion the fall. Reducing the Fed Funds Rate makes money cheaper, allowing an influx of credit into the economy through all types of loans.
The charts linked below show the relation between S&P 500 and interest rates.
Bill Gross of PIMCO suggested that in the prior 15 years ending in 2007, in each instance where the fed funds rate was higher than the nominal GDP growth rate, assets such as stocks and/or housing fell.[24]
This article’s lead section may not adequately summarize key points of its contents. Please consider expanding the lead to provide an accessible overview of all important aspects of the article. Please discuss this issue on the article’s talk page.(September 2010)
Monetary policy concerns the actions of a central bank or other regulatory authorities that determine the size and rate of growth of the money supply.
In the United States, the Federal Reserve is in charge of monetary policy, and implements it primarily by performing operations that influence short-term interest rates.
The money supply has different components, generally broken down into “narrow” and “broad” money, reflecting the different degrees of liquidity (‘spendability’) of each different type, as broader forms of money can be converted into narrow forms of money (or may be readily accepted as money by others, such as personal checks).[1]
For example, demand deposits are technically promises to pay on demand, while savings deposits are promises to pay subject to some withdrawal restrictions, and Certificates of Deposit are promises to pay only at certain specified dates; each can be converted into money, but “narrow” forms of money can be converted more readily. The Federal Reserve directly controls only the most narrow form of money, physical cash outstanding along with the reserves of banks throughout the country (known as M0 or the monetary base); the Federal Reserve indirectly influences the supply of other types of money.[1]
Broad money includes money held in deposit balances in banks and other forms created in the financial system. Basic economics also teaches that the money supply shrinks when loans are repaid;[2][3] however, the money supply will not necessarily decrease depending on the creation of new loans and other effects. Other than loans, investment activities of commercial banks and the Federal Reserve also increase and decrease the money supply.[4] Discussion of “money” often confuses the different measures and may lead to misguided commentary on monetary policy and misunderstandings of policy discussions.[5]
Monetary policy in the US is determined and implemented by the US Federal Reserve System, commonly referred to as the Federal Reserve. Established in 1913 by the Federal Reserve Act to provide central banking functions,[6] the Federal Reserve System is a quasi-public institution. Ostensibly, the Federal Reserve Banks are 12 private banking corporations;[7][8][9] they are independent in their day-to-day operations, but legislatively accountable to Congress through the auspices of Federal Reserve Board of Governors.
The Board of Governors is an independent governmental agency consisting of seven officials and their support staff of over 1800 employees headquartered in Washington, D.C.[10] It is independent in the sense that the Board currently operates without official obligation to accept the requests or advice of any elected official with regard to actions on the money supply,[11]and its methods of funding also preserve independence. The Governors are nominated by the President of the United States, and nominations must be confirmed by the U.S. Senate.[12]
The presidents of the Federal Reserve Banks are nominated by each bank’s respective Board of Directors, but must also be approved by the Board of Governors of the Federal Reserve. The Chairman of the Federal Reserve Board is generally considered to have the most important position, followed by the president of the Federal Reserve Bank of New York.[12] The Federal Reserve System is primarily funded by interest collected on their portfolio of securities from the US Treasury, and the Fed has broad discretion in drafting its own budget,[13] but, historically, nearly all the interest the Federal Reserve collects is rebated to the government each year.[14]
The Federal Reserve has three main mechanisms for manipulating the money supply. It can buy or sell treasury securities. Selling securities has the effect of reducing the monetary base (because it accepts money in return for purchase of securities), taking that money out of circulation. Purchasing treasury securities increases the monetary base (because it pays out hard currency in exchange for accepting securities). Secondly, the discount rate can be changed. And finally, the Federal Reserve can adjust the reserve requirement, which can affect the money multiplier; the reserve requirement is adjusted only infrequently, and was last adjusted in 1992.[15]
In practice, the Federal Reserve uses open market operations to influence short-term interest rates, which is the primary tool of monetary policy. The federal funds rate, for which the Federal Open Market Committee announces a target on a regular basis, reflects one of the key rates for interbank lending. Open market operations change the supply of reserve balances, and the federal funds rate is sensitive to these operations.[16]
In theory, the Federal Reserve has unlimited capacity to influence this rate, and although the federal funds rate is set by banks borrowing and lending funds to each other, the federal funds rate generally stays within a limited range above and below the target (as participants are aware of the Fed’s power to influence this rate).
Assuming a closed economy, where foreign capital or trade does not affect the money supply, when money supply increases, interest rates go down. Businesses and consumers have a lower cost of capital and can increase spending and capital improvement projects. This encourages short-term growth. Conversely, when the money supply falls, interest rates go up, increasing the cost of capital and leading to more conservative spending and investment. The Federal reserve increases interest rates to combat Inflation.
When money is deposited in a bank, it can then be lent out to another person. If the initial deposit was $100 and the bank lends out $100 to another customer the money supply has increased by $100. However, because the depositor can ask for the money back, banks have to maintain minimum reserves to service customer needs. If the reserve requirement is 10% then, in the earlier example, the bank can lend $90 and thus the money supply increases by only $90. The reserve requirement therefore acts as a limit on this multiplier effect. Because the reserve requirement only applies to the more narrow forms of money creation (corresponding to M1), but does not apply to certain types of deposits (such as time deposits), reserve requirements play a limited role in monetary policy.[17]
Currently, the US government maintains over US$800 billion in cash money (primarily Federal Reserve Notes) in circulation throughout the world,[18][19] up from a sum of less than $30 billion in 1959. Below is an outline of the process which is currently used to control the amount of money in the economy. The amount of money in circulation generally increases to accommodate money demanded by the growth of the country’s production. The process of money creation usually goes as follows:
Banks go through their daily transactions. Of the total money deposited at banks, significant and predictable proportions often remain deposited, and may be referred to as “core deposits.” Banks use the bulk of “non-moving” money (their stable or “core” deposit base) by loaning it out.[20] Banks have a legal obligation to keep a certain fraction of bank deposit money on-hand at all times.[21]
In order to raise additional money to cover excess spending, Congress increases the size of the National Debt by issuing securities typically in the form of a Treasury Bond[22] (see United States Treasury security). It offers the Treasury security for sale, and someone pays cash to the government in exchange. Banks are often the purchasers of these securities, and these securities currently play a crucial role in the process.
The 12-person Federal Open Market Committee, which consists of the heads of the Federal Reserve System (the seven Federal governors and five bank presidents), meets eight times a year to determine how they would like to influence the economy.[23] They create a plan called the country’s “monetary policy” which sets targets for things such as interest rates.[24]
Every business day, the Federal Reserve System engages in Open market operations.[25] If the Federal Reserve wants to increase the money supply, it will buy securities (such as U.S. Treasury Bonds) anonymously from banks in exchange for dollars. If the Federal Reserve wants to decrease the money supply, it will sell securities to the banks in exchange for dollars, taking those dollars out of circulation.[26][27] When the Federal Reserve makes a purchase, it credits the seller’s reserve account (with the Federal Reserve). The money that it deposits into the seller’s account is not transferred from any existing funds, therefore it is at this point that the Federal Reserve has created High-powered money.
By means of open market operations, the Federal Reserve affects the free reserves of commercial banks in the country.[28] Anna Schwartz explains that “if the Federal Reserve increases reserves, a single bank can make loans up to the amount of its excess reserves, creating an equal amount of deposits”.[26][27][29]
Since banks have more free reserves, they may loan out the money, because holding the money would amount to accepting the cost of foregone interest[28][30] When a loan is granted, a person is generally granted the money by adding to the balance on their bank account.[31]
This is how the Federal Reserve’s high-powered money is multiplied into a larger amount of broad money, through bank loans; as written in a particular case study, “as banks increase or decrease loans, the nation’s (broad) money supply increases or decreases.”[3] Once granted these additional funds, the recipient has the option to withdraw physical currency (dollar bills and coins) from the bank, which will reduce the amount of money available for further on-lending (and money creation) in the banking system.[32]
In many cases, account-holders will request cash withdrawals, so banks must keep a supply of cash handy. When they believe they need more cash than they have on hand, banks can make requests for cash with the Federal Reserve. In turn, the Federal Reserve examines these requests and places an order for printed money with the US Treasury Department.[33] The Treasury Department sends these requests to the Bureau of Engraving and Printing (to make dollar bills) and the Bureau of the Mint (to stamp the coins).
The U.S. Treasury sells this newly printed money to the Federal Reserve for the cost of printing.[citation needed] This is about 6 cents per bill for any denomination.[34] Aside from printing costs, the Federal Reserve must pledge collateral (typically government securities such as Treasury bonds) to put new money, which does not replace old notes, into circulation.[35]This printed cash can then be distributed to banks, as needed.
Though the Federal Reserve authorizes and distributes the currency printed by the Treasury (the primary component of the narrow monetary base), the broad money supply is primarily created by commercial banks through the money multiplier mechanism.[29][31][36][37] One textbook summarizes the process as follows:
“The Fed” controls the money supply in the United States by controlling the amount of loans made by commercial banks. New loans are usually in the form of increased checking account balances, and since checkable deposits are part of the money supply, the money supply increases when new loans are made …[38]
This type of money is convertible into cash when depositors request cash withdrawals, which will require banks to limit or reduce their lending.[39][32] The vast majority of the broad money supply throughout the world represents current outstanding loans of banks to various debtors.[38][40][41] A very small amount of U.S. currency still exists as “United States Notes“, which have no meaningful economic difference from Federal Reserve notes in their usage, although they departed significantly in their method of issuance into circulation. The currency distributed by the Federal Reserve has been given the official designation of “Federal Reserve Notes.”[42]
In 2005, the Federal Reserve held approximately 9% of the national debt[43] as assets against the liability of printed money. In previous periods, the Federal Reserve has used other debt instruments, such as debt securities issued by private corporations. During periods when the national debt of the United States has declined significantly (such as happened in fiscal years 1999 and 2000), monetary policy and financial markets experts have studied the practical implications of having “too little” government debt: both the Federal Reserve and financial markets use the price information, yield curve and the so-called risk free rate extensively.[44]
Experts are hopeful that other assets could take the place of National Debt as the base asset to back Federal Reserve notes, and Alan Greenspan, long the head of the Federal Reserve, has been quoted as saying, “I am confident that U.S. financial markets, which are the most innovative and efficient in the world, can readily adapt to a paydown of Treasury debt by creating private alternatives with many of the attributes that market participants value in Treasury securities.”[45] In principle, the government could still issue debt securities in significant quantities while having no net debt, and significant quantities of government debt securities are also held by other government agencies.
Although the U.S. government receives income overall from seigniorage, there are costs associated with maintaining the money supply.[41][46] Leading ecological economist and steady-state theoristHerman Daly, claims that “over 95% of our [broad] money supply [in the United States] is created by the private banking system (demand deposits) and bears interest as a condition of its existence,”[41] a conclusion drawn from the Federal Reserve’s ultimate dependence on increased activity in fractional reserve lending when it exercises open market operations.[47]Economist Eric Miller criticizes Daly’s logic because money is created in the banking system in response to demand for the money,[48] which justifies cost.[citation needed]
Thus, use of expansionary open market operations typically generates more debt in the private sector of society (in the form of additional bank deposits).[49] The private banking system charges interest to borrowers as a cost to borrow the money.[3][31][50] The interest costs are borne by those that have borrowed,[3][31] and without this borrowing, open market operations would be unsuccessful in maintaining the broad money supply,[30] though alternative implementations of monetary policy could be used. Depositors of funds in the banking system are paid interest on their savings (or provided other services, such as checking account privileges or physical security for their “cash”), as compensation for “lending” their funds to the bank.
Increases (or contractions) of the money supply corresponds to growth (or contraction) in interest-bearing debt in the country.[3][30][41] The concepts involved in monetary policy may be widely misunderstood in the general public, as evidenced by the volume of literature on topics such as “Federal Reserve conspiracy” and “Federal Reserve fraud.”[51]
Uncertainties
A few of the uncertainties involved in monetary policy decision making are described by the federal reserve:[52]
While these policy choices seem reasonably straightforward, monetary policy makers routinely face certain notable uncertainties. First, the actual position of the economy and growth in aggregate demand at any time are only partially known, as key information on spending, production, and prices becomes available only with a lag. Therefore, policy makers must rely on estimates of these economic variables when assessing the appropriate course of policy, aware that they could act on the basis of misleading information. Second, exactly how a given adjustment in the federal funds rate will affect growth in aggregate demand—in terms of both the overall magnitude and the timing of its impact—is never certain. Economic models can provide rules of thumb for how the economy will respond, but these rules of thumb are subject to statistical error. Third, the growth in aggregate supply, often called the growth in potential output, cannot be measured with certainty.
In practice, as previously noted, monetary policy makers do not have up-to-the-minute information on the state of the economy and prices. Useful information is limited not only by lags in the collection and availability of key data but also by later revisions, which can alter the picture considerably. Therefore, although monetary policy makers will eventually be able to offset the effects that adverse demand shocks have on the economy, it will be some time before the shock is fully recognized and—given the lag between a policy action and the effect of the action on aggregate demand—an even longer time before it is countered. Add to this the uncertainty about how the economy will respond to an easing or tightening of policy of a given magnitude, and it is not hard to see how the economy and prices can depart from a desired path for a period of time.
The statutory goals of maximum employment and stable prices are easier to achieve if the public understands those goals and believes that the Federal Reserve will take effective measures to achieve them.
Although the goals of monetary policy are clearly spelled out in law, the means to achieve those goals are not. Changes in the FOMC’s target federal funds rate take some time to affect the economy and prices, and it is often far from obvious whether a selected level of the federal funds rate will achieve those goals.
Opinions of the Federal Reserve
The Federal Reserve is lauded by some economists, while being the target of scathing criticism by other economists, legislators, and sometimes members of the general public. The former Chairman of the Federal Reserve Board, Ben Bernanke, is one of the leading academic critics of the Federal Reserve’s policies during the Great Depression.[53]
Achievements
One of the functions of a central bank is to facilitate the transfer of funds through the economy, and the Federal Reserve System is largely responsible for the efficiency in the banking sector. There have also been specific instances which put the Federal Reserve in the spotlight of public attention. For instance, after the stock market crash in 1987, the actions of the Fed are generally believed to have aided in recovery. Also, the Federal Reserve is credited for easing tensions in the business sector with the reassurances given following the 9/11 terrorist attacks on the United States.[54]
Criticisms
The Federal Reserve has been the target of various criticisms, involving: accountability, effectiveness, opacity, inadequate banking regulation, and potential market distortion. Federal Reserve policy has also been criticized for directly and indirectly benefiting large banks instead of consumers. For example, regarding the Federal Reserve’s response to the 2007–2010 financial crisis, Nobel laureate Joseph Stiglitz explained how the U.S. Federal Reserve was implementing another monetary policy —creating currency— as a method to combat the liquidity trap.[55]
By creating $600 billion and inserting this directly into banks the Federal Reserve intended to spur banks to finance more domestic loans and refinance mortgages. However, banks instead were spending the money in more profitable areas by investing internationally in emerging markets. Banks were also investing in foreign currencies which Stiglitz and others point out may lead to currency wars while China redirects its currency holdings away from the United States.[56]
Auditing
The Federal Reserve is subject to different requirements for transparency and audits than other government agencies, which its supporters claim is another element of the Fed’s independence. Although the Federal Reserve has been required by law to publish independently auditedfinancial statements since 1999, the Federal Reserve is not audited in the same way as other government agencies. Some confusion can arise because there are many types of audits, including: investigative or fraud audits; and financial audits, which are audits of accounting statements; there are also compliance, operational, and information system audits.
The Federal Reserve’s annual financial statements are audited by an outside auditor. Similar to other government agencies, the Federal Reserve maintains an Office of the Inspector General, whose mandate includes conducting and supervising “independent and objective audits, investigations, inspections, evaluations, and other reviews of Board programs and operations.”[57] The Inspector General’s audits and reviews are available on the Federal Reserve’s website.[58][59]
The Government Accountability Office (GAO) has the power to conduct audits, subject to certain areas of operations that are excluded from GAO audits; other areas may be audited at specific Congressional request, and have included bank supervision, government securities activities, and payment system activities.[60][61] The GAO is specifically restricted any authority over monetary policy transactions;[60] the New York Times reported in 1989 that “such transactions are now shielded from outside audit, although the Fed influences interest rates through the purchase of hundreds of billions of dollars in Treasury securities.”[62] As mentioned above, it was in 1999 that the law governing the Federal Reserve was amended to formalize the already-existing annual practice of ordering independent audits of financial statements for the Federal Reserve Banks and the Board;[63] the GAO’s restrictions on auditing monetary policy continued, however.[61]
Congressional oversight on monetary policy operations, foreign transactions, and the FOMC operations is exercised through the requirement for reports and through semi-annual monetary policy hearings.[61] Scholars have conceded that the hearings did not prove an effective means of increasing oversight of the Federal Reserve, perhaps because “Congresspersons prefer to bash an autonomous and secretive Fed for economic misfortune rather than to share the responsibility for that misfortune with a fully accountable Central Bank,” although the Federal Reserve has also consistently lobbied to maintain its independence and freedom of operation.[64]
Fulfillment of wider economic goals
By law, the goals of the Fed’s monetary policy are: high employment, sustainable growth, and stable prices.[65]
Critics say that monetary policy in the United States has not achieved consistent success in meeting the goals that have been delegated to the Federal Reserve System by Congress. Congress began to review more options with regard to macroeconomic influence beginning in 1946 (after World War II), with the Federal Reserve receiving specific mandates in 1977 (after the country suffered a period of stagflation).
Throughout the period of the Federal Reserve following the mandates, the relative weight given to each of these goals has changed, depending on political developments.[citation needed] In particular, the theories of Keynesianism and monetarism have had great influence on both the theory and implementation of monetary policy, and the “prevailing wisdom” or consensus view of the economic and financial communities has changed over the years.[66]
Elastic currency (magnitude of the money multiplier): the success of monetary policy is dependent on the ability to strongly influence the supply of money available to the citizens. If a currency is highly “elastic” (that is, has a higher money multiplier, corresponding to a tendency of the financial system to create more broad money for a given quantity of base money), plans to expand the money supply and accommodate growth are easier to implement. Low elasticity was one of many factors that contributed to the depth of the Great Depression: as banks cut lending, the money multiplier fell, and at the same time the Federal Reserve constricted the monetary base. The depression of the late 1920s is generally regarded as being the worst in the country’s history, and the Federal Reserve has been criticized for monetary policy which worsened the depression.[67] Partly to alleviate problems related to the depression, the United States transitioned from a gold standard and now uses a fiat currency; elasticity is believed to have been increased greatly.[68]
Stable prices – While some economists would regard any consistent inflation as a sign of unstable prices,[71] policymakers could be satisfied with 1 or 2%;[72] the consensus of “price stability” constituting long-run inflation of 1-2% is, however, a relatively recent development, and a change that has occurred at other central banks throughout the world. Inflation has averaged a 4.22% increase annually following the mandates applied in 1977; historic inflation since the establishment of the Federal Reserve in 1913 has averaged 3.4%.[73] In contrast, some research indicates that average inflation for the 250 years before the system was near zero percent, though there were likely sharper upward and downward spikes in that timeframe as compared with more recent times.[74] Central banks in some other countries, notably the German Bundesbank, had considerably better records of achieving price stability drawing on experience from the two episodes of hyperinflation and economic collapse under the country’s previous central bank.
Inflation worldwide has fallen significantly since former Federal Reserve Chairman Paul Volcker began his tenure in 1979, a period which has been called the Great Moderation; some commentators attribute this to improved monetary policy worldwide, particularly in the Organisation for Economic Co-operation and Development.[75][76]BusinessWeek notes that inflation has been relatively low since mid-1980s[77] and it was during this time that Volcker wrote (in 1995), “It is a sobering fact that the prominence of central banks [such as the Federal Reserve] in this century has coincided with a general tendency towards more inflation, not less. By and large, if the overriding objective is price stability, we did better with the nineteenth-century gold standard and passive central banks, with currency boards, or even with ‘free banking.'”.
Sustainable growth – The growth of the economy may not be sustainable as the ability for households to save money has been on an overall decline[78] and household debt is consistently rising.[79]
Monetarists who believe that the Great Depression started as an ordinary recession but significant policy mistakes by monetary authorities (especially the Federal Reserve) caused a shrinking of the money supply which greatly exacerbated the economic situation, causing a recession to descend into the Great Depression.
Public confusion
The Federal Reserve has established a library of information on their websites, however, many experts have spoken about the general level of public confusion that still exists on the subject of the economy; this lack of understanding of macroeconomic questions and monetary policy, however, exists in other countries as well. Critics of the Fed widely regard the system as being “opaque“, and one of the Fed’s most vehement opponents of his time, Congressman Louis T. McFadden, even went so far as to say that “Every effort has been made by the Federal Reserve Board to conceal its powers….”[80]
There are, on the other hand, many economists who support the need for an independent central banking authority, and some have established websites that aim to clear up confusion about the economy and the Federal Reserve’s operations. The Federal Reserve website itself publishes various information and instructional materials for a variety of audiences.
Briefly, the theory holds that an artificial injection of credit, from a source such as a central bank like the Federal Reserve, sends false signals to entrepreneurs to engage in long-term investments due to a favorably low interest rate. However, the surge of investments undertaken represents an artificial boom, or bubble, because the low interest rate was achieved by an artificial expansion of the money supply and not by savings. Hence, the pool of real savings and resources have not increased and do not justify the investments undertaken.
These investments, which are more appropriately called “malinvestments”, are realized to be unsustainable when the artificial credit spigot is shut off and interest rates rise. The malinvestments and unsustainable projects are liquidated, which is the recession. The theory demonstrates that the problem is the artificial boom which causes the malinvestments in the first place, made possible by an artificial injection of credit not from savings.
According to Austrian economics, without government intervention, interest rates will always be an equilibrium between the time-preferences of borrowers and savers, and this equilibrium is simply distorted by government intervention. This distortion, in their view, is the cause of the business cycle. Some Austrian economists—but by no means all—also support full reserve banking, a hypothetical financial/banking system where banks may not lend deposits. Others may advocate free banking, whereby the government abstains from any interference in what individuals may choose to use as money or the extent to which banks create money through the deposit and lending cycle.
Reserve requirement
The Federal Reserve regulates banking, and one regulation under its direct control is the reserve requirement which dictates how much money banks must keep in reserves, as compared to its demand deposits. Banks use their observation that the majority of deposits are not requested by the account holders at the same time.
Currently, the Federal Reserve requires that banks keep 10% of their deposits on hand.[81] Some countries have no nationally mandated reserve requirements—banks use their own resources to determine what to hold in reserve, however their lending is typically constrained by other regulations.[82] Other factors being equal, lower reserve percentages increases the possibility of Bank runs, such as the widespread runs of 1931. Low reserve requirements also allow for larger expansions of the money supply by actions of commercial banks—currently the private banking system has created much of the broad money supply of US dollars through lending activity. Monetary policy reform calling for 100% reserves has been advocated by economists such as: Irving Fisher,[83]Frank Knight,[84] many ecological economists along with economists of the Chicago School and Austrian School. Despite calls for reform, the nearly universal practice of fractional-reserve banking has remained in the United States.
Criticism of private sector involvement
Historically and to the present day, various social and political movements (such as social credit) have criticized the involvement of the private sector in “creating money”, claiming that only the government should have the power to “make money”. Some proponents also support full reserve banking or other non-orthodox approaches to monetary policy. Various terminology may be used, including “debt money”, which may have emotive or political connotations. These are generally considered to be akin to conspiracy theories by mainstream economists and ignored in academic literature on monetary policy.
Story 1: American People’s Verdict On Democratic Socialist Debate: Lying Lunatic Left — Hillary Clinton — Bernie Sanders — Martin O’Malley — Lincoln Chaffee — Guilty As Charged — Indict or Nominate or Pardon Hillary Clinton — Biden Biding Time Until Benghazi Testimony of Clinton — Worse Economic Recovery Since Great Depression and 7 Years of Economic Stagnation Under Obama — No Change — No Hope — Videos
LAS VEGAS, NV – OCTOBER 13: (L-R) Democratic presidential candidates Jim Webb, U.S. Sen. Bernie Sanders (I-VT), Hillary Clinton, Martin O’Malley and Lincoln Chafee take the stage for a presidential debate sponsored by CNN and Facebook at Wynn Las Vegas on October 13, 2015 in Las Vegas, Nevada. The five candidates are participating in the party’s first presidential debate. (Photo by Joe Raedle/Getty Images)
Bernie Sanders vs. Hillary Clinton | Democratic Presidential Debate Analysis
Obama’s message to Democratic debate candidates
In a taped message to the Democratic candidates, President Barack Obama urged Democrats to work hard and fight to keep the White House in 2016.
Who were the winners and losers of the Democratic debate?
Bernie Sanders : People are sick of hearing about Hillary Clinton’s “damn emails”
Mom Of Benghazi Victim Demands Answers While Hillary Clinton Laughs Off Email Scandal
Winners and losers at first Democratic debate
Clinton and Sanders dominate first Democratic debate
The Best Moments From The First Democratic Primary Debate
Democratic debate CNN — democratic debate 2016 Full … Sanders,Clinton,Omalley,Webb,Chafee
Bernie Sanders continues to shock the political world
Hillary & Democrats May Not Cooperate With Benghazi Committee
Dem Debate #1: Mature Adults, Not Lunatics. Did Hillary or Bernie Win?
Emails Show Clinton Worked With George Soros To Run Shadow Gov’t
The real scandal surrounding Democratic presidential hopeful Hillary Clinton’s private email system may be that she was running, in concert with a private consulting firm tied closely to George Soros, an outsourced and parallel State Department answerable only to her and not President Obama, the Congress, or the American people.
Who Won The First Democratic Debate In Terms Of Body Language?
Carol Kinsey Goman
The major story of the first televised presidential debate in 1960 became the photogenic appeal of John F. Kennedy versus the sickly look of his opponent, Richard Nixon, who refused to wear makeup although his recent illness had left him with a pallid complexion. In addition, Kennedy looked directly at the camera when answering questions (rather that at the journalists who asked them), which made viewers see him as someone who was talking right to them and giving straight answers. To make matters worse, the cameras caught Nixon wiping perspiration from his forehead while Kennedy was pressing him on the issues.
When the debate ended, a large majority of television viewers recognized Kennedy as the winner. Radio listeners, who heard the debate but hadn’t seen it, gave the victory to Nixon.
Never again would politicians under estimate the importance of physical appearance and body language – especially when appearing on television. Today’s political figures are fully aware of, and heavily coached on, the impact of nonverbal communication.
And when it comes to nonverbal cues, everything matters: Gender, age, skin color, hair style, attractiveness, height, clothing, facial expressions, hand gestures, posture — audiences judge it all. Superficial? Maybe. But this potent (and often unconscious) process is also hardwired in the human brain.
There are two sets of nonverbal signals that are especially important for candidates to project: warmth and authority. Warmth cues project likeability and candor and authority cues denote power and status. The most appealing politicians (at least from a body language standpoint) are those whose behaviors encompass both sets of signals.
Which brings me to the first Democratic debate of the 2016 election cycle — and how I would grade the body language of the debaters.
Hillary Clinton, former secretary of state
Grade: A-
How she did it: Clinton is often described, by both supporters and critics, as strong, tough, and aggressive. So it was no surprise to see those qualities exhibited in her body language through expansive gestures, erect posture, and well-prepared responses.
Recommended by Forbes
MOST POPULAR Photos: The World’s Top-Earning YouTube Stars 2015
TRENDING ON FACEBOOK Bernie Sanders Clearly Won Tuesday’s Debate — On Twitter
SungardASVoice: How Cloud Orchestration Keeps Cloud Computing In Perfect Harmony
Leadership Presence And The GOP Debate
Hits And Misses From The Second GOP Debate
So, Who Won The First Republican Primary Debate of 2012? -Media Training
But Clinton’s body language won the debate by doing more than displaying authority. She successfully “warmed up” her image, with smiles, head nods in agreement/support of other’s comments, and (at one point) even laughter.
Visually, being the only woman on stage was also to her advantage. The contrast between Clinton and the rest of the (white, male) candidates was visually striking – especially for someone who wants to show how she would be different from previous presidents.
Bernie Sanders, senator of Vermont
Grade: B+
How he did it: Unlike Clinton, who (for better or worse) is a known national figure, Sanders needed to give the audience a clear picture of who he is and what he stands for – and he was very effective doing so last night. Sanders was animated and used gestures (like finger pointing and palms rotated down) to effectively emphasize his resolve – although at times, his movements were a bit jerky, instead of smooth. And for those who were wondering if a 74-year old could keep his energy high for two hours, the answer was a resounding “yes.”
Sanders nonverbal negatives include his leaning too often on the lectern (as if he needed physical support) and in his lack of warm cues. He is much more expressive when showing anger, disgust, and impatience – but rarely does he display joy or express optimism.
Martin O’Malley, former governor Maryland
Grade: C
How he did it: While he never had the “break through” moment his campaign was hoping for, nonverbally O’Malley had a significant nonverbal advantage: He looked fit and athletic – and he was the tallest person in the line up. Don’t discount the effect of these seemingly trivial facts. We are biased toward attractive, healthy people, and we unconsciously attribute leadership characteristics to tall people. (The effects of this are seen not only in politics, but in business. For example, in the U.S. population, 14.5% men are 6’ tall and over, but with CEOs of Fortune 500 companies, that statistic climbs to 58%.) But his softer, slower communication style often lacked the energy and passion needed to support his rhetoric. And his deadpan, almost angry expression when other candidates were speaking was tweeted about as the “death stare” – not a good look for someone who is usually seen as upbeat and happy.
Jim Webb, former senator of Virginia
Grade C-
How he did it: Webb is known as being “gruff” and “stiff,” and both of those qualities were displayed nonverbally: Outside of a slight lean backward and a shoulder shrug now and then, he rarely moved his body – adding to his stoic image.
Lincoln Chaffee, former governor of Rhode Island
Grade: D
How he did it: Chafee’s body language was filled with nervous facial gestures (lip licking was especially prevalent) and conflicting nonverbal messages, the most noticeable being a smile with tightened or compressed lips that made the otherwise warm signal look forced and inauthentic.
The only missing contender in last night’s debate was Vice President Joe Biden, who hasn’t declared his intention to run. Too bad. He is passionate and expressive. He would have been interesting to watch.
EVIDENCE SHOWS CLINTON RAN A PARALLEL, OUTSOURCED STATE DEPT.
Clinton received help from George Soros to run shadow gov’t
The real scandal surrounding Democratic presidential hopeful Hillary Clinton’s private email system may be that she was running, in concert with a private consulting firm tied closely to George Soros, an outsourced and parallel State Department answerable only to her and not President Obama, the Congress, or the American people.
The media has tried to separate two dubious operations of Mrs. Clinton while she was at the State Department. The first is the private email server located in her Chappaqua, New York residence. The second is the fact that her government-paid State Department personal assistant, Huma Abedin, wife of disgraced New York “sexting” congressman Anthony Weiner, was simultaneously on the payroll of Teneo, a corporate intelligence firm that also hired former President Bill Clinton and former British Prime Minister Tony Blair as advisers. Abedin has been linked to the Muslim Brotherhood, which has recently buried the hatchet with longtime rival Saudi Arabia and common cause against the Assad government in Syria, the Houthi rebels in Yemen, and Iran.
It is clear that Mrs. Clinton used her private email system to seek advice on major foreign policy issues, from her friend and paid Clinton Foundation adviser Sidney Blumenthal providing private intelligence on Libya’s post-Qaddafi government and possible business ventures to Clinton friend Lanny Davis seeking favors from Mrs. Clinton. It should be noted that Davis was a paid lobbyist for the military junta of Honduras that overthrew democratically-elected President Manuel Zelaya in 2009. It also should be noted that Mrs. Clinton voiced her personal dislike for the late Libyan leader Muammar Qaddafi, when, after he was assassinated by U.S.-armed jihadist rebels, boasted, “We came, we saw, he died!”
It was highly unusual for Abedin to receive a U.S. government paycheck while also receiving a consultant’s salary from Teneo. Teneo was founded in 2011 by Doug Band, a former counselor to Bill Clinton. Teneo, which is as much a private intelligence firm as it is an investment company and “governance” consultancy, has its headquarters in New York and branches in Washington DC, Brussels, São Paulo, London, Dublin, Dubai, Hong Kong, Beijing, and Melbourne. With the exception of its investment arm, Teneo closely resembles the former CIA-connected firm where Barack Obama worked after he graduated from Columbia, Business International Corporation (BIC). Teneo’s marketing claims match those made by BIC during its heyday: Teneo works “exclusively with the CEOs and senior leaders of many of the world’s largest and most complex companies and organizations.”
Teneo has staked a position in the international news media with its recent purchase of the London-based firm Blue Rubicon, formed in part by the former home news editor for Channel 4 News in the United Kingdom. Teneo also recently acquired London’s Stockwell Group, which provides consultancy services to the National Bank of Greece and Pireaus Bank. It appears that Mrs. Clinton’s friends are cashing in on the global banking austerity being levied against Greece.
The head of Teneo Intelligence is Jim Shinn, a former assistant secretary for Asia for the Defense Department. What is troubling is that Teneo has been offering statements to the media designed to heighten tensions between NATO and Turkey on one side and Russia on the other over Russia’s military attacks on the Islamic State in Syria. Shinn’s intelligence chief in Teneo’s London office, Wolfgango Piccoli, who has worked for the Soros-linked Eurasia Group consultancy, told CNN that Russia’s “reinforcement of the Assad regime and the consolidation of separate areas of control is more likely to prolong the conflict by forcing a stalemate.” The Teneo statement came in a CNN report that suggests members of the Bashar al Assad government in Syria and Russian President Vladimir Putin and his government could be charged by international or “national” tribunals for war crimes in a manner similar to those convened on members of the Yugoslavian and Serbian governments.
The entire International Criminal Court (ICC) in The Hague and in Africa has fallen under the control of George Soros and his operatives. Soros has made no secret of his support for overthrowing Assad and Putin and he has resorted to a “weapon of mass migration” of Syrian, Iraqi, and other refugees into Europe in order to destabilize the entire continent and endanger its Christian culture and social democratic traditions. Mrs. Clinton and Soros extensively used Mrs. Clinton’s private email system to exchange, among other things, information on the political situation in Albania, a country where Soros’s operatives are plentiful and powerful. Soros is a major donor to the Clinton Foundation and Mrs. Clinton’s presidential campaign.
Soros also pressed Mrs. Clinton for State Department support for his American University of Central Asia, which, as seen with Soros’s Central European University in Budapest and its graduate ranks of pro-U.S. leaders throughout central and eastern Europe, is designed to manufacture a new generation of pro-U.S. leaders in the Central Asian states of the former Soviet Union.
The “wiping” of Mrs. Clinton’s email systems’ hard drives appear to be part of a classic case of an intelligence operation destroying data after being exposed.
The Clinton outsourcing of U.S. foreign policy not only involves Teneo but also the Clinton Foundation, for which Mrs. Clinton solicited donations from foreign sources while she served as Secretary of State. Moreover, in a classic example of racketeering, Bill Clinton was paid by Teneo as an adviser while his Clinton Foundation hired Teneo as as a consultant. The Clinton Foundation is directed by Bill and Hillary Clinton, along with their daughter Chelsea Clinton Mezvinsky. Mrs. Clinton’s private email use also extended to Clinton Foundation chief financial officer Andrew Kessel and longtime Bill Clinton friend Bruce Lindsey.
One of the emails sent via Mrs. Clinton’s private system was from her State Department counsel Cheryl Mills to Amitabh Desai, the head of foreign policy for the Clinton Foundation. Mills wanted Desai to arrange a meeting between Rwandan dictator Paul Kagame with the Democratic Republic of Congo strongman Joseph Kabila during Kagame’s visit to Kinshasa in 2012. This effort was conducted outside the State Department with the sole exception that Assistant Secretary of State for African Affairs Johnnie Carson, a close friend of Mrs. Clinton, was involved in the email exchange with Mills and Desai.
Other private email use involved Hollywood magnate Haim Saban, Loews heir Andrew Tisch, and Lynn de Rothschild, all of whom were peddling Israel’s interests to Hillary and Bill Clinton in return for sizable donations to the Clinton Foundation and Mrs. Clinton’s presidential campaign.
Under the Clinton Giustra Enterprise Partnership, the Clinton Foundation received generous financial support totaling some $31 million from Frank Giustra, a Canadian uranium mining magnate. Giustra relied on the Clintons to use their influence to open up lucrative uranium exploitation opportunities in places like Kazakhstan and Africa.
Senator Chuck Grassley (R-IA) has been stonewalled in his attempt to obtain more information about Teneo’s relationship with Mrs. Clinton, the Clinton Foundation, and Bill Clinton.
Wayne Madsen is an investigative journalist who consistently exposes cover-ups from deep within the government. Want to be the first to learn the latest scandal? Go to WayneMadsenReport.com subscribe today!
Story 1: When Will Obama and Kerry Walk Like Men Out Of Negotiations With The World Leading Terrorist Nation The Islamic Republic of Iran? Never! — Yakety Yak– Where Is The Written Signed Agreement/Treaty Stopping Iran From Having Nuclear Weapons President Obama? — Time To Release Some Massive Ordnance Penetrators (MOPs) — Bunker Busters on Iran’s Nuclear Bomb Factories — Bombs Away — Videos
Divine – Walk Like A Man (1985) HQ
Walk Like a Man – The Four Seasons
“Walk Like A Man”
oo woo-oo-oo oo woo-oo-oo
(Wop wop wop wop)
oo woo-oo-oo oo woo-oo-oo
Walk like a manOh how you tried
To cut me down to size
by telling dirty lies to my friends
But my own father
Said give her up, don’t bother
The world isn’t coming to an endHe said walk like a man
Talk like a man
Walk like a man my son
No woman’s worth
Crawling on the earth
So walk like a man my sonoo woo-oo-oo oo woo-oo-oo
(Wop wop wop wop)
oo woo-oo-oo oo woo-oo-ooFine eyed baby
I don’t mean maybe
We’re gonna get along somehow
Soon you’ll be crying
On ‘count of all you’re lying
Oh yeah, just look who’s laughing nowI’m gonna walk like a man
Fast as I can
Walk like a man from you
I’ll tell the world
Forget about it girl
And walk like a man from youoo woo-oo-oo oo woo-oo-oo
(Wop wop wop wop)
oo woo-oo-oo oo woo-oo-oo
(Wop wop wop wop)
oo woo-oo-oo oo woo-oo-oo
(Wop wop wop wop)
oo woo-oo-oo oo woo-oo-oo
Walk Like a Man Frankie Valli & The Four Seasons Lyrics
July 2015 Breaking News USA ready to attack Iranian nuclear facilities with awe-inspiring plan B
30,000 Pound Bunker Buster Bomb designed to detour Iran Nuclear Threat
As negotiations with Iran continue towards a nuclear arms agreement, the United States still holds a trump card. The 30,000 Pound Boeing GBU-57 Bunker Buster bomb, the largest non-nuclear weapon in U.S. inventory, designed to destroy nuclear weapons bunkers in Iran and North Korea. The bunker buster, known as the Massive Ordnance Penetrator (MOP), is 30,000 pounds (13,608 kg.) and has been improved with “adjusted fuses to maximize its burrowing power, upgraded guidance systems to improve its precision and hi-tech equipment intended to allow it to evade Iranian air defenses in order to reach and destroy the Fordow nuclear enrichment complex.”
“Hopefully we never have to use it, but if we had to, it would work.”
The existence of a bomb that has the capability of destroying the underground facility from the air could also give the West extra bargaining power in nuclear negotiations with the Iran.
US officials believe the improved MOP will serve to convince Israel to hold off on unilaterally attacking Iran and give Washington more time to diplomatically neutralize the Iranian nuclear threat.
US military chiefs openly admitted the weapon was built to attack the fortified nuclear facilities of “rogue states” such as Iran and North Korea. Although the Pentagon insists that it is not aimed at a specific threat, unnamed officials within the ministry have repeatedly claimed the bomb is being tailor-made to disable Iranian nuclear facilities at Fordo.
Vienna talks on Iran nuclear deal will continue over weekend
U.S.’s Kerry says not in rush to get Iran nuclear deal
Iran Nuclear Deal Deadlocked Over Arms
Weapons of War: Pentagon Upgrades Biggest ‘Bunker Buster’ Bomb
Bunkers & Bunker Busting Bombs
MOP Massive Ordnance Penetrator GBU-57A-B Penetrator bunker buster bomb Iran United States
World War 3 Pentagon unveils 30,000 pound M O P Bunker Buster Bomb against Iran May 03, 2013
Boeing Delivers Massive Ordnance Penetrator (MOP) 37,000 LB Bombs To The USAF – GBU-57
Israel Air Force Refuels Mid-air
Only on AP: US Tankers Refuel for IS Fight
WATCH OUT IRAN Israeli Air Force unveils Refueling aircraft for possible Airstrike
Israel To Buy 25 More F-35 Lockheed Stealth Fighters: Sources
December 2014 Breaking News USA F35 Israel to buy second squadron of stealth F35 jets
News Wrap: As deadline looms, Kerry says Iran nuclear talks not ‘open-ended’
Frankie Valli & The Four Seasons In Concert Live
Frankie Valli And 4 Seasons Live on Ice 2008
The Coasters – Yakety Yak – ORIGINAL MONO VERSION
Yakety Yak – The Coasters with lyrics
Where Have all the Flowers Gone: Eve of Destruction
Iran Made Illegal Purchases of Nuclear Weapons Technology Last Month
The question is not whether Iran can be trusted to uphold the nuclear deal now being negotiated in Vienna (it can’t), but whether the Obama administration and its P5+1 partners can be trusted to punish Iran when it violates the agreement?
Experience shows that unless Iran violates the deal egregiously, the temptation will be to ignore it. For instance, Iran got away with selling more oil than it should have under the interim agreement. More ominously, Tehran repeatedly pushed the envelope on technical aspects of the agreement—such as caps on its uranium stockpile—and got away with it. The Obama administration and other Western powers have so much invested in their diplomatic efforts that they’ll deny such violations ever occurred.
More evidence of Iranian violations has now surfaced. Two reports regarding Iran’s attempts to illicitly and clandestinely procure technology for its nuclear and ballistic missile programs have recently been published. They show that Iran’s procurement continues apace, if not faster than before the Joint Plan of Action was signed in November 2013. But fear of potentially embarrassing negotiators and derailing negotiations has made some states reluctant to report Tehran’s illegal efforts. If these countries have hesitated to expose Iran during the negotiations, it is more likely they will refrain from reporting after a deal is struck.
The first report was released last month by the U.N. panel of experts in charge of reporting compliance with U.N. Security Council resolutions regarding Iran. The panel noted that U.N. member states had not reported significant violations of U.N. sanctions and speculated as to why: either Iran was complying, or countries did not wish to interfere with negotiations.
Paddle, pedal, jog or Segway through North America’s largest urban parkland—Edmonton’s river valley.
The second report, released last week by Germany’s domestic intelligence agency, is less ambiguous. The agency, the Federal Office for the Protection of the Constitution, confirmed to us that Iran continues to seek illicit technology for its nuclear and ballistic missiles programs.
Iran has had a long history of trying to obtain nuclear technology from German companies, particularly by seeking ways to transport merchandise in circumvention of international sanctions. Since November 2013, Tehran has sought industry computers, high-speed cameras, cable fiber, and pumps for its nuclear and missile program. It appears that Iran’s readiness to negotiate does not reflect any substantive policy change. Rather, it is a diplomatic tactic retreat forced by economic distress, not a strategic rethinking of its priorities.
Iran’s cheating should give Western negotiators additional resolve to impose ironclad guarantees in the agreement. They should compel Iran to reveal its past activities, including its post-JPOA procurement efforts, and impose tough, intrusive, “anytime, anywhere” inspections before sanctions are suspended, let alone lifted.
Instead, the lack of reporting to the U.N. despite evidence of cheating suggests a lack of resolve on the part of Western nations, and their willingness to downplay all but the most egregious violations. This does not bode well for the future. If Western powers are reluctant to penalize Iran for trying to evade sanctions because they’re afraid of spoiling the negotiations, what will happen in the future when Western powers have even more invested in preserving an agreement?
Emanuele Ottolenghi is a senior fellow at the Foundation for Defense of Democracies, where Benjamin Weinthal is a research fellow.
In 2002, Northrop Grumman and Lockheed Martin were working on the development of a 30,000-lb (13,600 kg) earth-penetrating weapon, said to be known as “Big BLU“. But funding and technical difficulties resulted in the development work being abandoned. Following the 2003 invasion of Iraq, analysis of sites that had been attacked with bunker-buster bombs revealed poor penetration and inadequate levels of destruction.[citation needed]This renewed interest in the development of a super-large bunker-buster, and the MOP project was initiated by the Defense Threat Reduction Agency to fulfill a long-standing Air Force requirement.[3]
The U.S. Air Force has not officially recognized specific military requirement for an ultra-large bomb, but it does have a concept for a collection of massively sized penetrator and blast weapons, the so-called “Big BLU” collection, which includes the MOAB (Massive Ordnance Air Burst) bomb. Development of the MOP was performed at the Air Force Research Laboratory, Munitions Directorate, Eglin Air Force Base, Florida with design and testing work performed by Boeing. It is intended that the bomb will be deployed on the B-2 bomber, and will be guided by the use of GPS.[4][5]
Northrop Grumman announced a $2.5-million stealth-bomber refit contract on 19 July 2007. Each of the U.S. Air Force’s B-2s is to be able to carry two 14-ton MOPs.[6][7]
On 6 October 2009, ABC News reported that the Pentagon had requested and obtained permission from the U.S. Congress to shift funding in order to accelerate the project.[8][9] It was later announced by the U.S. military that “funding delays and enhancements to the planned test schedule” meant the bomb would not be deployable until December 2010, six months later than the original availability date.[10]
The project has had at least one successful Flight Test MOP launch.[11] The final testing will be completed in 2012.[3]
The Air Force took delivery of 20 bombs, designed to be delivered by the B-2 bomber, in September 2011. In February 2012, Congress approved $81.6 million to further develop and improve the weapon.[12]
Recent development
On 7 April 2011, the USAF ordered eight MOPs plus supporting equipment for $28 million.[13]
On 14 November 2011, Bloomberg reported that the Air Force Global Strike Command started receiving the Massive Ordnance Penetrator and that the deliveries “will meet requirements for the current operational need”.[14] The Air Force now has received delivery of 16 MOPs as of November 2011.[15] And as of March 2012, there is an “operational stockpile” at Whiteman Air Force Base.[16]
In 2012, the Pentagon requested $82 million to develop greater penetration power for the existing weapon.[1] A 2013 report stated that the development had been a success,[17] and B-2 integration testing began that year.[18]
MOP being offloaded in preparation for its first explosive test, 2007.
Mock up of MOP inside a bomb bay of a B-2 simulator, 2007.[6]
B-52 releases a MOP during a weapons test, 2009.
Next-generation Penetrator Munition
On 25 June 2010, USAF Lt. Gen. Phillip Breedlove said that the Next-generation Penetrator Munition should be about a third the size of the Massive Ordnance Penetrator so it could be carried by affordable aircraft.[19] In December 2010, the USAF had a Broad Agency Announcement (BAA) for the Next Generation Penetrator (NGP).[20]
Global Strike Command has indicated that one of the objectives for the Next-Generation Bomber is for it to carry a weapon with the effects of the Massive Ordnance Penetrator. This would either be with the same weapon or a smaller weapon that uses rocket power to reach sufficient speed to match the penetrating power of the larger weapon.[21]
One of the current limitations of the MOP is that it lacks a void-sensing fuze and will therefore detonate after it has come to a stop, even if it passed by the target area.[22]
Iran Agrees to Nuclear Limits, But Key Issues Are Unresolved
Iran and European nations say they have reached an understanding about next steps, but key issues need to be resolved before a final agreement by June 30.
According to European officials, roughly 5,000 centrifuges will remain spinning enriched uranium at Natanz, about half the number currently running. The underground enrichment site at Fordo — which Israeli and some American officials fear is impervious to bombing — will be partly converted to advanced nuclear research and the production of medical isotopes.
A major reactor at Arak, which officials fear could produce plutonium, will operate on a limited basis that will not provide enough fuel for a bomb.
In return the European Union and the United States will begin to lift sanctions, as Iran complies.
Kerry Announces Extension to Iran Talks Video by Reuters/ Photo by Roland Schlager/European Pressphoto Agency
U.S. and Allies Extend Iran Nuclear Talks by 7 Months
A yearlong effort to reach an enduring accord with Iran to dismantle large parts of its nuclear infrastructure fell short, forcing the United States and its allies to declare a seven-month extension, but with no clear indication of how they plan to bridge fundamental differences.
The Iranian foreign minister, Mohammad Javad Zarif, left, Catherine Ashton, who is representing the European Union, and Secretary of State John Kerry in Vienna. Leonhard Foeger/Reuters
Negotiators Scrambling as Deadline Looms in Nuclear Talks
As six world powers and Iran race to meet a Monday deadline for an agreement that would constrain Iran’s nuclear program, the United States stakes out an ambitious goal for what an accord should accomplish.
American officials say the agreement should slow the Iranian nuclear program enough that it would take Iran at least a year to make enough material for a nuclear bomb if it decided to ignore the accord.
It has become increasingly unlikely that any accord announced on Monday would be a complete one. And whatever deal is reached, it may not matter if Iranian hard-liners have their way. In Iran, the final decision on a nuclear deal lies with Ayatollah Ali Khamenei, the supreme leader.
Under a proposed deal, Russia will convert uranium into specialized fuel rods for Iran’s Bushehr nuclear power plant.Majid Asgaripour/Agence France-Presse — Getty Images
Role for Russia Gives Iran Talks a Possible Boost
Iran tentatively agrees to ship much of its huge stockpile of uranium to Russia for conversion into specialized fuel rods for the Bushehr nuclear power plant, Iran’s only commercial reactor. The agreement is potentially a major breakthrough in talks that have until now been deadlocked.
A key question remains about the negotiations that American officials have been loath to discuss in public: In a final deal, would Iran be required to publicly admit its past activities, or merely provide a mechanism for monitoring its actions in the future?
Iran’s nuclear reactor in Arak, about 150 miles southwest of Tehran, is being redesigned.Hamid Foroutan/Iranian Students News Agency, via Associated Press
Iran Altering Arak Reactor in Bid for Nuclear Deal
Atomic power engineers in Iran start redesigning a partly constructed reactor in Arak to limit the amount of plutonium it produces, Ali Akbar Salehi, the director of the Atomic Energy Organization of Iran, says, expressing hope that the change will help alleviate Western objections that the plutonium can be used in weapons.
Iran, the United States and the five other countries agree to a four-month extension of the negotiations, giving them more time to try to bridge a major difference over whether the country will be forced to dismantle parts of its nuclear infrastructure, according to senior Western diplomats involved in the talks.
Iran’s foreign minister, Mohammad Javad Zarif, accuses the West of trying to sabotage a reactor being built near Arak.Atta Kenare/Agence France-Presse — Getty Images
Iran Outlines Nuclear Deal; Accepts Limit
As the deadline for the talks approaches on Sunday, Iran’s foreign minister, Mohammad Javad Zarif, says the country could accept a freeze on its capacity to produce nuclear fuel at current levels for several years, provided it could eventually produce fuel unhindered.
The proposal will effectively extend a limited series of concessions Iran made last November as part of a temporary deal to get negotiations started on a permanent accord. In return, Iran wants step-by-step relief from sanctions that have substantially weakened its economy.
Iran Is Providing Information on Its Detonators, Report Says
The I.A.E.A. releases a report stating that Iran is beginning to turn over information related to its nuclear detonators. The agency says that Iran has provided “additional information and explanations,” including documents, to substantiate its claim that it had tested the detonators for “a civilian application.”
From left, Foreign Ministers Laurent Fabius of France and William Hague of Britain, and Secretary of State John Kerry with Foreign Minister Nasser Judeh of Jordan, in Paris. Thierry Chesnot/Getty Images
Negotiators Put Final Touches on Iran Accord
Iran and a group of six world powers complete a deal that will temporarily freeze much of Tehran’s nuclear program starting Jan. 20, in exchange for limited relief from Western economic sanctions.
The agreement faced opposition from Iranian hard-liners and Israeli leaders, as well as heavy criticism from some American lawmakers, who have threatened to approve further sanctions despite President Obama’s promise of a veto.
The negotiators in Geneva early Sunday morning. President Obama hailed the agreement. Denis Balibouse/Reuters
Deal With Iran Halts Nuclear Program
The United States and five other world powers announce a landmark accord that would temporarily freeze Iran’s nuclear program and lay the foundation for a more sweeping agreement.
The aim of the accord, which is to last six months, is to give international negotiators time to pursue a more comprehensive accord that would ratchet back much of Iran’s nuclear program and ensure that it could only be used for peaceful purposes.
I.A.E.A. inspectors release a report stating that for the first time in years, they saw evidence that the Iranians have put the brakes on their nuclear expansion.
President Obama makes an appeal to Congress to give breathing space to his efforts to forge a nuclear deal with Iran.
Iran is in a much different position now to negotiate on its nuclear program than it was four years ago when President Obama first broached the subject.
Iran Says It Agrees to ‘Road Map’ With U.N. on Nuclear Inspections
The I.A.E.A. says that Iran has agreed to resolve all outstanding issues with the agency, and will permit “managed access” by international inspectors to two key nuclear facilities. But the promise does not extend to the Parchin military site, which inspectors have been trying to see for months.
Marathon talks between major powers and Iran fail to ease sanctions on the country and produce a deal to freeze its nuclear program.
Iran and a group of six world powers say that they have engaged in “substantive” and “forward-looking” discussions on the disputed Iranian nuclear program and that they will reconvene on November 7.
The account of the two days of talks in Geneva came in a rare joint statement from Iran’s foreign minister, Mohammad Javad Zarif, and Catherine Ashton, the foreign policy chief for the European Union, who is the lead negotiator with Iran.
President Obama says he has spoken by phone with President Hassan Rouhani, the first direct contact between the leaders of Iran and the United States since 1979. Mr. Obama, speaking in the White House briefing room, said the two leaders discussed Iran’s nuclear program and said he was persuaded there was a basis for an agreement.
Moments before Mr. Obama’s announcement, Mr. Rouhani’s Twitter account posted this now-deleted message: “In a phone conversation b/w #Iranian & #US Presidents just now: @HassanRouhani: “Have a Nice Day!” @BarackObama: “Thank you. Khodahafez.”
Rouhani, Blunt and Charming, Pitches a Moderate Iran in First U.N. Appearance
Iran’s new president, Hassan Rouhani, turns himself into a high-speed salesman offering a flurry of speeches, tweets, televised interviews and carefully curated private meetings, intended to end Iran’s economic isolation.
At the United Nations General Assembly, he preaches tolerance and understanding, decries as a form of violence the Western sanctions imposed on his country and says nuclear weapons have no place in its future. He takes aim at Israel’s nuclear arsenal in a public – while the country’s leaders caution over what they deem as an empty charm offensive.
Hassan Rouhani, Iran’s new leader, received a private letter from President Obama about easing tensions between the countries.Vahid Salemi/Associated Press
Iran Said to Seek a Nuclear Accord to End Sanctions
Seizing on a perceived flexibility in a letter from President Obama to President Hassan Rouhani, Iran’s leaders are focused on getting quick relief from crippling sanctions, a top adviser to the Iranian leadership says.
The adviser says that Mr. Obama’s letter, delivered about three weeks ago, promised relief from sanctions if Tehran demonstrated a willingness to “cooperate with the international community, keep your commitments and remove ambiguities.”
Iran Slows Its Gathering of Enriched Uranium, Report Says
I.A.E.A. inspectors say that Iran is slowing its accumulation of enriched uranium that can be quickly turned into fuel for an atomic bomb. The report’s disclosure is significant politically because it delays the day when Iran could breach what Prime Minister Benjamin Netanyahu of Israel last fall called a “red line” beyond which Iran would not be allowed to pass — the point at which it has enough purified uranium to quickly make a single nuclear weapon.
Hassan Rouhani, a moderate, has been elected the next president of Iran.
Iran Elects New President
Voters overwhelmingly elect Hassan Rouhani, 64, a mild-mannered cleric who advocates greater personal freedoms and a more conciliatory approach to the world.
The diplomat sheik played a key role in Iran’s voluntary suspension of uranium enrichment in 2004, which Western powers responded to by asking for more concessions from Iran.
Mr. Rouhani replaces his predecessors’ foreign minister with Mohammad Javad Zarif, an American-educated diplomat known for his understanding of the West, and makes him responsible for negotiations over Iran’s nuclear program. Mr. Rouhani also removes a hard-line nuclear scientists as head of Iran’s Atomic Energy Organization, and replaces him with the former foreign minister, Ali Akbar Salehi. In September, Iran’s longtime ambassador to the International Atomic Energy Agency will be replaced as well.
The Obama administration escalates sanctions against Iran for the fourth time in a week, blacklisting what it describes as a global network of front companies controlled by Iran’s top leaders, accusing them of hiding assets and generating billions of dollars worth of revenue to help Tehran evade sanctions.
The White House also accuses Ayatollah Ali Khamenei of personally directing an effort to bypass them.
The United States also blacklists Iranian petrochemical companies, its automotive industry and more than 50 Iranian officials, and threatens to sanction foreign banks that trade or hold Iran’s national currency, the rial.
The I.A.E.A. says Iran has made significant progress across the board in its nuclear program, while negotiations with the West dragged on this spring. But it said that it has not gone past the “red line” that Israel’s leaders have declared could trigger military action.
In its last report before the Iranian elections next month, the agency also gives details that point to an emerging production strategy by the Iranians. One strategy involves speeding ahead with another potential route to a bomb: producing plutonium. The report indicates that Iran is making significant progress at its Arak complex, where it has built a heavy-water facility and is expected to have a reactor running by the end of next year.
The United States expands its roster of those violating Iran sanctions, blacklisting four Iranian companies and one individual suspected of helping the country enrich nuclear fuel. It also singles out two other companies, including a Venezuelan-Iranian bank, accused of helping Iran evade other Western-imposed prohibitions on oil sales and financial dealings.
The penalties came a day after the Senate introduced legislation that could effectively deny the Iran government access to an estimated $100 billion worth of its own money parked in overseas banks, a step that proponents said could significantly damage Iran’s financial stability.
Iranians rush to supermarkets to buy cooking oil, red meat and other staples, stockpiling the goods over new fears of price spikes from a change in the official exchange rate that could severely reduce the already weakened purchasing power of the rial, the national currency.
Prices of staples are set to increase by as much as 60 percent because of the currency change.
Economists say the result is from a combination of severe Western sanctions and what many call the government’s economic mismanagement.
Chuck Hagel at the Pentagon. Next week he will travel to the Middle East to finalize the arms sale.Brendan Smialowski/Agence France-Presse — Getty Images
U.S. Arms Deal With Israel and 2 Arab Nations Is Near
The Defense Department is expecting to finalize a $10 billion arms deal with Israel, Saudi Arabia and the United Arab Emirates next week that will provide missiles, warplanes and troop transports to help them counter any future threat from Iran.
Israeli Officials Stress Readiness for Lone Strike on Iran
In an interview with the BBC, Prime Minister Benjamin Netanyahu spoke of dealing with the Iranian nuclear threat, saying Israel has “different vulnerabilities and different capabilities” than the United States. “We have to make our own calculations, when we lose the capacity to defend ourselves by ourselves.”
Israeli defense and military officials have been issuing explicit warnings this week that Israel was prepared and had the capability to carry out a lone military strike against Iran’s nuclear facilities.
US Blacklists an Iranian and Businesses Over Violation of Sanctions
The United States blacklists an affluent Iranian business executive, Babak Morteza Zanjani, and what it describes as his multibillion-dollar money laundering network, accusing them of selling oil for Iran in violation of the Western economic sanctions imposed over Iran’s disputed nuclear program.
On March 14, The Treasury Department, which administers the government’s Iran sanctions, blacklisted a Greek shipping tycoon, Dimitris Cambis, over what it called his scheme to acquire a fleet of oil tankers on Iran’s behalf and disguise their ownership to ship Iranian oil.
Family members of slain nuclear scientists stood with Fereydoun Abbasi-Davani, far right, a nuclear official. Arash Khamoushi/Iranian Students News Agency, ISNA, via Associated Press
After Talks End, Iran Announces an Expansion of Nuclear Fuel Production
Iran’s president announces an expansion of the country’s uranium production and claims other atomic energy advances, striking a pugnacious tone in the aftermath of diplomatic talks thatended in an impasse with the big powers on April 6 in Kazakhstan.
A look, provided by the United States Navy, at how its laser attack weapon works. The video is silent.
Navy Deploying Laser Weapon Prototype Near Iran
The U.S. announces that the Navy will deploy a laser weapon prototype in the Persian Gulf, where Iranian fast-attack boats have harassed American warships and where the government in Tehran is building remotely piloted aircraft carrying surveillance pods and, someday potentially, rockets.
The laser will not be operational until next year. It has been shown in tests to disable patrol boats and blind or destroy surveillance drones.
President Obama traveled to Israel on March 20, in a symbolic two-day visit to the country, the first of his presidency.
Iran Nuclear Weapon to Take Year or More, Obama Says
President Obama tells an Israeli television station that his administration believes it would take Iran “over a year or so” to develop a nuclear weapon.
Mr. Obama’s estimated timeline contrasts with Mr. Netanyahu’s stated belief that Israel and its Western allies are likely to have to intervene by the spring or summer, when, he says, Iran’s scientists will have enriched enough uranium to become a nuclear threat.
Iran meets with the United States, Russia, China, Britain, France and Germany in Kazakhstan, but talks end with no specific agreement over a proposal that would sharply constrain Iran’s stockpile of the most dangerous enriched uranium, in return for a modest lifting of some sanctions.
The six powers also agreed that Iran could keep a small amount of 20 percent enriched uranium — which can be converted to bomb grade with modest additional processing — for use in a reactor to produce medical isotopes.
Iranian oil sales have been reduced by half as a result of the international pressure on the country, and restrictions on financial transactions and transportation have created many difficulties for its leaders.
The state news agency IRNA quotes a report by the Atomic Energy Organization of Iran, saying that it had found significant new deposits of raw uranium and identified sites for 16 more nuclear power stations.
Iran’s raw uranium reserves now total around 4,400 tons, including discoveries over the past 18 months, IRNA quoted the report as saying.
A few weeks earlier, Ayatollah Khamenei said that his country was not seeking nuclear weapons but added that if Iran ever decided to build them, no “global power” could stop it.
Speaking to air force commanders in Tehran on Feb. 6, Ayatollah Khamenei said Iran “will not negotiate under pressure.” Khamenei Official Web site, via European Pressphoto Agency
U.S. Bolsters Sanctions
A new round of American sanctions take effect which state that any country that buys Iranian oil must put the purchase money into a local bank account. Iran cannot repatriate the money and can use it only to buy goods within that country. Violators risk severe penalties in doing business with the United States. Oil exports from Iran have already dropped by a million barrels a day.
A week earlier, Iran announces that it would deploy a new generation of centrifuges, four to six times as powerful as the current generation.
Most of that decline comes in a frenzy of speculative selling by Iranians worried that rapid inflation could render their money worthless. The government responds with a crackdown in which some money traders are arrested.
The depressed value of the rial forces Iranians to carry ever-fatter wads of bank notes to buy everyday items. But the sanctions also present a new complication to Iran’s banking authorities: they may not be able to print enough money.
Meanwhile, the European Union toughens sanctions against Iran, banning trade in industries like finance, metals and natural gas, and making other business transactions far more cumbersome.
Prime Minister Benjamin Netanyahu at the United Nations, displaying his red line for Iran’s nuclear program. Chang W. Lee/The New York Times
Israel’s ‘Red Line’
Prime Minister Benjamin Netanyahu of Israel tells the United Nations that Iran’s capability to enrich uranium must be stopped before the spring or early summer, arguing that by that time Iran will be in a position to make a short, perhaps undetectable, sprint to manufacture its first nuclear weapon.
The United Nations atomic agency reports that Iran has installed three-quarters of the nuclear centrifuges needed to complete a deep-underground site under a mountain near Qum for the production of nuclear fuel.
The I.A.E.A. also says that Iran may have sought to cleanse another site where the agency has said it suspects that the country has conducted explosive experiments that could be relevant to the production of a nuclear weapon.
Meanwhile, the United States imposes more punishing sanctions against Iran, aimed at its oil and petrochemical sectors, as well as its shipping trade, intensifying existing sanctions intended to choke off the revenue that Iran reaps from its two largest export industries.
The Neptune, an oil tanker in the Persian Gulf, is part of a fleet of about 65 Iranian tankers serving as floating storage facilities for Iranian oil, each one given a nautical makeover to conceal its origin and make a buyer easier to find. Thomas Erdbrink
Embargo on Iranian Oil
A European Union embargo on Iranian oil takes effect, playing a large role in severely restricting Iran’s ability to sell its most important export.
In retaliation, Iran announces legislation intended to disrupt traffic in the Strait of Hormuz, a vital Persian Gulf shipping lane, and tests missiles in a desert drill clearly intended as a warning to Israel and the United States.
In January 2013, Iran’s oil minister, Rostam Qasemi, acknowledged for the first time that petroleum exports and sales had fallen by at least 40 percent in the previous year, costing the country $4 billion to $8 billion each month.
Iran’s nuclear negotiator, Saeed Jalili, in Baghdad. Thaier Al-Sudani/Reuters
Talks With West Falter
After a brief spurt of optimism, talks between Iran and six world powers on its disputed nuclear program fail to produce a breakthrough in Baghdad. The United States, Russia, China, Britain, France and Germany wanted a freeze on Iranian production of uranium enriched to 20 percent purity, which is considered a short step from bomb grade. The Iranians wanted an easing of the onerous economic sanctions imposed by the West and a recognition of what they call their right to enrich. The countries agree to meet again in June, but talks were further slowed after a new regimen of harsh economic sanctions and a statement from the International Atomic Energy Agency that said Iran had made ”no progress” toward providing access to restricted sites it suspects of being used to test potential triggers for nuclear warheads.
March 2012
President Mahmoud Ahmadinejad surveying the centrifuges at Iran’s underground complex at Natanz in March 2007.Office of the Iranian President
Meanwhile, I.A.E.A. inspectors are still trying to gain access to the Parchin site, 20 miles south of Tehran, to ascertain whether tests have been carried out there on nuclear bomb triggers.
But satellites images show that the site has been extensively cleaned by the Iranians.
Jan. 11, 2012
00:00
00:00
Iran’s semiofficial Fars News Agency supplied this photo of what it said was Mostafa Ahmadi Roshan’s car after the bombing.Meghdad Madadi/Fars News Agency, via Associated Press
Bomb Kills Nuclear Scientist
A bomber on a motorcycle kills Mostafa Ahmadi Rosha, a scientist from the Natanz site, and his bodyguard. Iran blames Israel and the United States. The Americans deny the accusation, but Israel is more circumspect.
Iran displayed the drone for propaganda purposes, with photographs of ayatollahs who led Iran’s revolution behind it and a desecrated version of the American flag. Revolutionary Guards, via Agence France-Presse — Getty Images
A Blow to U.S., as Drone Crashes
A stealth C.I.A. drone, the RQ-170 Sentinel, crashes near the Iranian town of Kashmar, 140 miles from the Afghan border. It is part of a stepped-up surveillance program that has frequently sent the United States’ most hard-to-detect drone into Iran to map suspected nuclear sites.
Iran asserts that its military downed the aircraft, but American officials say the drone was lost because of a malfunction.
Iran’s nuclear enrichment plant at Natanz.Hasan Sarbakhshian/Associated Press
Natanz Plant Recovers
After a dip in enriched uranium production in 2010 because of the cyberattacks, Iranian production recovers. While the United States and Israel never acknowledged responsibility for the cyberprogram, Olympic Games, some experts argue that it set the Iranians back a year or two. Others say that estimate overstates the effect.
With the program still running, intelligence agencies in the United States and Israel seek out new targets that could further slow Iran’s progress.
A poster of an Iranian gas field is a backdrop to passers-by in Asaluyeh. Newsha Tavakolian for The New York Times
West Expands Sanctions, and U.N. Offers Evidence on Nuclear Work
Major Western powers take significant steps to cut Iran off from the international financial system, announcing coordinated sanctions aimed at its central bank and commercial banks. The United States also imposes sanctions on companies involved in Iran’s nuclear industry, as well as on its petrochemical and oil industries.
The United Nations atomic agency releases evidence that it says make a “credible” case that “Iran has carried out activities relevant to the development of a nuclear device” at its Parchin military base and that the project may still be under way.
Unidentified attackers riding motorcycles bomb two of Iran’s top nuclear scientists, killing one and prompting accusations that the United States and Israel are again trying to disrupt Iran’s nuclear program.
The scientist who was killed, Majid Shahriari, reportedly managed a ”major project” for the country’s Atomic Energy Organization. His wounded colleague, Fereydoon Abbasi, is believed to be even more important; he is on the United Nations Security Council’s sanctions list for ties to the Iranian nuclear effort.
The Iranian scientist Shahram Amiri, with his 7-year-old son, greeting family members in Tehran.Newsha Tavakolian/Polaris, for The New York Times
Iranian Scientist Defects to U.S., Then Reconsiders
Shahram Amiri, an Iranian nuclear scientist who American officials say defected to the United States in 2009, provided information about Iran’s nuclear weapons program and then developed second thoughts, returning to Iran. (After a hero’s welcome, he was imprisoned on treason charges and tortured, according to reports from Iran.)
The bizarre episode was the latest in a tale that has featured a mysterious disappearance from a hotel room in Saudi Arabia, rumors of a trove of new intelligence about Iran’s nuclear plants and a series of contradictory YouTube videos. It immediately set off a renewed propaganda war between Iran and the United States.
Ambassadors to the United Nations, from right: Susan E. Rice of the United States, Mark Lyall Grant of Britain and Ruhakana Rugunda of Uganda voted to affirm a Security Council resolution on Iran while Turkey’s ambassador, Ertugrul Apakan, voted against it. Mario Tama/Getty Images
U.N. Approves New Sanctions
The United Nations Security Council levels its fourth round of sanctions against Iran’s nuclear program. The sanctions curtail military purchases, trade and financial transactions carried out by the Islamic Revolutionary Guards Corps, which controls the nuclear program.
The Security Council also requires countries to inspect ships or planes headed to or from Iran if they suspect banned cargo. In addition, Iran is barred from investing in other countries’ nuclear enrichment plants, uranium mines and related technologies, and the Security Council sets up a committee to monitor enforcement.
The United States and Israel realize that copies of the computer sabotage program introduced in Natanz are available on the Internet, where they are replicating quickly. In a few weeks, articles appear in the news media about a mysterious new computer worm carried on USB keys that exploits a hole in the Windows operating system. The worm is named Stuxnet.
President Obama decides not to kill the program, and a subsequent attack takes out nearly 1,000 Iranian centrifuges, nearly a fifth of those operating.
Yukiya Amano, the head of the International Atomic Energy Agency.Herwig Prammer/Reuters
Work on Warhead
The United Nations’ nuclear inspectors declare for the first time that they have extensive evidence of “past or current undisclosed activities” by Iran’s military to develop a nuclear warhead.
The report also concludes that some Iranian weapons-related activity apparently continued “beyond 2004,” contradicting an American intelligence assessment published in 2008 that concluded that work on a bomb was suspended at the end of 2003.
Defense Secretary Robert M. Gates in 2011. Francois Lenoir/Reuters
Leaked Gates Memo on U.S. Policy
Defense Secretary Robert M. Gates warns in a secret three-page memorandum to top White House officials that the United States does not have an effective long-range policy for dealing with Iran’s steady progress toward nuclear capability.
When the memo becomes public in April, Mr. Gates issues a statement saying that he wishes to dispel any perception among allies that the administration had failed to adequately think through how to deal with Iran.
Prime Minister Gordon Brown of Britain, President Nicolas Sarkozy of France and President Obama, in Pittsburgh, accused Iran of building a secret nuclear fuel plant.Doug Mills/The New York Times
Warning on Nuclear ‘Deception’
American, British and French officials declassify some of their most closely held intelligence and describe a multiyear Iranian effort, tracked by spies and satellites, to build a secret uranium enrichment plant deep inside a mountain.
The new plant, which Iran strongly denies is intended to be kept secret or used for making weapons, is months from completion and does nothing to shorten intelligence estimates of how long it would take Iran to produce a bomb. American intelligence officials say it will take at least a year, perhaps five, for Iran to develop the full ability to make a nuclear weapon.
Secretary of State Hillary Rodham Clinton announces that the United States will participate in talks with Iran involving five other nations: Britain, China, France, Germany and Russia.
The negotiators Saeed Jalili of Iran, left, and William J. Burns, third from right, in Geneva. Pool photo by Denis Balibouse
Talks End in Deadlock
International talks on Iran’s nuclear ambitions end in deadlock despite the Bush administration’s decision to reverse policy and send William J. Burns, a senior American official, to the table for the first time.
Iran responds with a written document that fails to address the main issue: international demands that it stop enriching uranium. Iranian diplomats reiterate before the talks that they consider the issue nonnegotiable.
President George W. Bush rejects a secret request by Israel for specialized bunker-busting bombs it wants for an attack on Iran’s nuclear program. The Bush administration is alarmed by the Israeli idea to fly over Iraq to reach Iran’s major nuclear complex at Natanz and decides to step up intelligence-sharing with Israel and brief Israeli officials on new American efforts to subtly sabotage Iran’s nuclear infrastructure. Mr. Bush will hand off the major covert program to President Obama.
The United States works with Israel to begin cyberattacks, code-named Olympic Games, on computer systems at the Natanz plant. A year later, the program is introduced undetected into a controller computer at Natanz. Centrifuges begin crashing and engineers have no clue that the plant is under attack.
The Security Council unanimously approves sanctions intended to curb Iran’s nuclear program. The sanctions ban the import and export of materials and technology used in uranium enrichment and reprocessing and in the production of ballistic missiles.
The heavy-water plant in Arak, south of Tehran.Iran/Reuters
Iran Opens a Heavy-Water Reactor
Just days before Iran is supposed to suspend enrichment of uranium or face the prospect of sanctions, President Ahmadinejad formally kicks off a heavy-water production plant in Arak, 120 miles southwest of Tehran, which would put Iran on the path to obtaining plutonium, a fuel used in nuclear weapons.
In November, Iran seeks international assistance to ensure safe operation for a 40-megawatt reactor it is building. Citing broader doubts about Iran’s nuclear ambitions, the United Nations atomic agency, the United States and European countries oppose offering help.
A satellite image of Natanz in 2007.GeoEye/SIME, via Associated Press
Natanz Production Is Restarted
Iran resumes uranium enrichment at Natanz after negotiations with European and American officials collapse.
The I.A.E.A. approves a resolution to report Iran’s nuclear program to the Security Council, citing “the absence of confidence” among the atomic agency’s members “that Iran’s nuclear program is exclusively for peaceful purposes.”
President Ahmadinejad offended Israel in his speech on the rule of law at a United Nations conference in 2012. Eduardo Munoz/Reuters
Ahmadinejad Elected President
Mahmoud Ahmadinejad, known only as a secular conservative and a former mayor of Tehran, becomes president. He becomes a divisive figure in world affairs, cheering on the development of Iran’s nuclear program despite orders from the United Nations Security Council to halt it, calling for Israel to be “wiped off the map’’ and describing the Holocaust as “a myth.”
Mid-July, 2005
With Laptop Files, U.S. Seeks to Prove Iran’s Nuclear Aims
Senior American intelligence officials present the International Atomic Energy Agency with the contents of what they say is a stolen Iranian laptop containing more than a thousand pages of Iranian computer simulations and accounts of experiments — studies for crucial features of a nuclear warhead.
Intelligence reports reveal that Mohsen Fakhrizadeh, a little-known Iranian scientist, leads elements of Iran’s weaponization program known as Project 110 and Project 111.
But doubts about the intelligence persist among some experts, in part because American officials, citing the need to protect their source, have largely refused to provide details of the origins of the laptop beyond saying that they obtained it in mid-2004 from a source in Iran who they said had received it from a second person, now believed to be dead.
Foreign Minister Kamal Kharrazi talking to reporters in Tehran ahead of nuclear talks in Paris. Abedin Taherkenareh/European Pressphoto Agency
Violation and New Agreement
Iran violates the agreement, charging that the Europeans reneged on their promises of economic and political incentives. After 22 hours of negotiations, an Iranian delegation and senior officials from France, Germany, Britain and the European Union come to a preliminary agreement to immediately suspend Iran’s production of enriched uranium. The Iranian foreign minister, Kamal Kharrazi, praises the so-called Paris Agreement but emphasizes that any suspension will be temporary.
In a few weeks, the I.A.E.A verifies Iran’s suspension of its enrichment activities, with one exception: its request to use up to 20 sets of centrifuge components for research and development.
An Iranian missile displayed by the Revolutionary Guards under a portrait of the supreme leader, Ayatollah Khamenei, in September 2003. Henghameh Fahimi/Agence France-Presse
Nuclear Program Is Suspended
Possibly in response to the American invasion of Iraq, which was originally justified by the Bush administration on the grounds that Iraq had weapons of mass destruction, Ayatollah Khamenei orders a suspension of work on what appear to be weapons-related technologies, although he allows uranium enrichment efforts to continue.
Inspectors with the United Nations atomic agency find traces of highly enriched uranium at the Natanz plant, and Iran concedes to demands, after talks with Britain, France and Germany, to accept stricter international inspections of its nuclear sites and to suspend production of enriched uranium.
2002
Discovery of Secret Plants
Mujahedeen Khalq, an Iranian dissident group also known as the M.E.K., obtains and shares documents revealing a clandestine nuclear program previously unknown to the United Nations.
The program includes a vast uranium enrichment plant at Natanz and a heavy water plant at Arak. In December, satellite photographs of Natanz and Arak appear widely in the news media. The United States accuses Tehran of an “across-the-board pursuit of weapons of mass destruction,” but takes relatively little action because it is focused on the approaching invasion of Iraq the next year.
Iran agrees to inspections by the I.A.E.A. It also signs an accord with Russia to speed up completion of the nuclear power plant at Bushehr.
May 1999
Mohammad Khatami in 2009. Hasan Sarbakhshian/Associated Press
Proposal for Nuclear-Free Mideast
President Mohammad Khatami of Iran goes to Saudi Arabia, becoming the first Iranian leader since 1979 to visit the Arab world.
He issues a joint statement with King Fahd expressing concerns about Israel’s nuclear weapons program and support for ridding the Middle East of nuclear weapons. In 2003, Iran supports such a proposal initiated by Syria.
July 1996
President Bill Clinton addressing reporters in July 1996. Joe Marquette/Associated Press
Sanctions Against Iran and Libya
With growing intelligence estimates that Iran may secretly be trying to build a nuclear weapon, President Bill Clinton signs a bill imposing sanctions on foreign companies with investments in Iran and Libya. Such rules are already in place for American companies.
A Russian engineer checking equipment at the Bushehr nuclear plant in April 2007.Behrouz Mehri/Agence France-Presse — Getty Images
Iran and Russia Sign Nuclear Contract
Iran announces that it will sign an $800 million contract with Russia to complete construction on one of two light water reactors at the Bushehr nuclear plant within four years. After many delays, the project was completed in 2010.
The United States has been persuading countries like Argentina, India, Spain, Germany and France to prohibit the sale of nuclear technology to Iran’s civilian program.
In 2005, the United Nations’ International Atomic Energy Agency is on the verge of reviewing Tehran’s nuclear program when Iranian officials admit to a 1987 meetingwith Dr. Khan’s representatives. But Tehran tells the agency that it turned down the chance to buy the equipment required to build the core of a bomb.
1984
Iraqi gunners used a Soviet 130-milllimeter field gun to shell the Iranian cities of Abadan and Khurramshahr.United Press International
Nuclear Program Restarts
The Iran-Iraq war, from 1980 to 1988, changes Iran’s thinking about the nuclear program. With Saddam Hussein pursuing a nuclear program in Iraq, Ayatollah Khomeini secretly decides to restart Iran’s program and seeks the assistance of German partners to complete the construction at Bushehr, which was damaged by bombs during the war.
Feb. 11, 1979
Ayatollah Ruhollah Khomeini descending from the Air France plane that returned him to Tehran after 15 years in exile.United Press International
Khomeini Comes to Power
Prime Minister Bakhtiar is overthrown by followers of Ayatollah Ruhollah Khomeini, an exiled cleric, after bloody clashes in Tehran.
The new leader is uninterested in the nuclear program and ends the shah’s effort. Many nuclear experts flee the country.
Any nuclear cooperation between Iran and the United States breaks down completely with the American Embassy hostage crisis from November 1979 until January 1981.
The deposed shah, with Empress Farah and two of their children, in the Bahamas in 1979, where they dodged questions from photographers. Associated Press
Shah Flees
The shah is overthrown and flees the country, in what becomes known as the Islamic Revolution of 1979.
Prime Minister Shahpur Bakhtiar takes over and cancels the $6.2 billion contract for the construction of two nuclear power plants at the Bushehr complex.
The United States retracts a deal it had made with Iran a year earlier and stops supplying enriched uranium for the Tehran research reactor.
The Bushehr nuclear plant on Aug. 21, 2010, as its first fuel rod was loaded. Getty Images
Creation of Atomic Energy Body
The shah creates the Atomic Energy Organization of Iran, which conducts training for its personnel and nuclear deals with countries including the United States, France, West Germany, Namibia and South Africa. By training engineers in Iran and abroad, the country gains a solid understanding of nuclear technologies and capabilities.
A year later, Kraftwerk Union, a West German company, agrees to construct two light water reactors to produce nuclear energy at the Bushehr complex, 470 miles south of Tehran. Construction begins in 1974 but the contract is not signed until 1976.
By the late 1970s, the United States becomes worried that Iran may harbor nuclear weapon ambitions.
July 1, 1968
Iran Signs Nuclear Non-Proliferation Treaty
With the American-provided research reactor running, starting in 1967, Iran becomes one of 51 nations to sign the Nuclear Non-Proliferation Treaty, agreeing to never become a nuclear-weapon state.
Iran begins a civilian nuclear program in the 1950s, led by Shah Mohammed Reza Pahlavi, who reaches a deal through the Eisenhower administration’s Atoms for Peace program. Under the agreement, the United States agrees to provide a nuclear research reactor in Tehran and power plants.
Ep. 12: AN ANIMATED FILM ON THE DEBT & THE DEFICIT | Marshall Curry
US Debt Crisis – Perfectly Explained
The Collapse of The American Dream Explained in Animation
George Carlin on the American Dream
The bar chart comes directly from the Monthly Treasury Statement published by the U. S. Treasury Department..The “Debt Total” bar chart is generated from the Treasury Department’s “Debt Report” found on the Treasury Direct web site. It has links to search the debt for any given date range, and access to debt interest information. It is a direct source to government provided budget information.
— “Deficit” vs. “Debt”—Suppose you spend more money this month than your income. This situation is called a “budget deficit”. So you borrow (ie; use your credit card). The amount you borrowed (and now owe) is called your debt. You have to pay interest on your debt. If next month you spend more than your income, another deficit, you must borrow some more, and you’ll still have to pay the interest on your debt (now larger). If you have a deficit every month, you keep borrowing and your debt grows. Soon the interest payment on your loan is bigger than any other item in your budget. Eventually, all you can do is pay the interest payment, and you don’t have any money left over for anything else. This situation is known as bankruptcy.
“Reducing the deficit” is a meaningless soundbite. If theDEFICIT is any amount more than ZERO, we have to borrow more and the DEBT grows.
Each year since 1969, Congress has spent more money than its income. The Treasury Department has to borrow money to meet Congress’s appropriations. Here is a direct link to the Congressional Budget Office web site’s deficit analysis. We have to pay interest* on that huge, growing debt; and it dramatically cuts into our budget.
Sen Rand Paul on Baseline Budgeting
Ending Baseline Budgeting | House GOP Twitter Response
2014 U.S. Federal Budget: Taxes & Revenue
2014 U.S. Federal Budget: Budget Process
2014 U.S. Federal Budget: Social Insurance, Earned Benefits, & Entitlements
2014 U.S. Federal Budget: Debt and Deficit
US Congress has raised the debt ceiling 78 times since 1960
Baseline Budgeting
Rep. Louie Gohmert Applauds The Baseline Reform Act
Baseline Budgeting Explained
Underwhelming Spending Cuts from Congress and Obama
Understanding the National Debt and Budget Deficit
Part 1
FairTax: Fire Up Our Economic Engine (Official HD)
The FairTax: It’s Time
Flat Tax vs. National Sales Tax
Dan Mitchell Discussing Federal Tax Burden on CNBC
Eight Reasons Why Big Government Hurts Economic Growth
Dan Mitchell Explaining How Government Screws Up Everything
What is the FairTax legislation?
Cato Institute Senior Fellow Daniel J. Mitchell
How does the FairTax rate compare to today’s?
What assumptions does the FairTax make about government spending?
How does the FairTax rate compare to today’s?
Is the FairTax truly progressive?
How does the “prebate” work?
Will the prebate create a massive new entitlement system?
Wouldn’t it be more fair to exempt food and medicine from the FairTax?
Is it fair for rich people to get the same prebate as poor people?
If people bring home their whole paychecks how can prices fall?
How does the FairTax impact the middle class?
Why is the FairTax better than a flat income tax?
Is the FairTax rate really 23%?
Is consumption a reliable source of revenue?
How does the FairTax affect compliance costs?
Isn’t it a stretch to say the IRS will go away?
Can I pretend to be a business to avoid the sales tax?
How does the FairTax affect tax preparers and CPAs?
Are any significant economies funded by a sales tax?
How will the FairTax affect state sales tax systems?
Can’t Americans just cross the border to avoid the FairTax
How will Social Security payments be calculated under the FairTax?
Will the FairTax impact tax deferred retirement accounts like 401(k)s?
How will the FairTax® make the tax system fair for everyone?
What’s the difference between the FairTax® and the income tax?
How will the FairTax® help me save money?
Why Should Grandparents support FairTax®?
Congressman Woodall Discusses the FairTax
“The Case for the Fair Tax”
Freedom from the IRS! – FairTax Explained in Detail
John Stossel speaks to the Fair Tax Rally
Sen. Moran Discusses FairTax Legislation on U.S. Senate Floor
Mind blowing speech by Robert Welch in 1958
Robert Welch Speaks: In One Generation (1974)
GOP Taxonomy: The Flat Taxers and the Fair Taxers
by Aman Batheja
During his last run for president, Rick Perry often pulled a postcard out of his jacket pocket. “The best representation of my plan is this postcard, which taxpayers will be able to fill out to file their taxes,” Perry said. While Perry proposed an optional 20 percent flat tax on all income levels, the other Texan running that cycle, Ron Paul, wanted to get rid of the income tax altogether. The former Surfside congressman sometimes suggested replacing it and other federal taxes with a sales tax, a concept often described as the Fair Tax. As the 2016 landscape begins taking shape, potential Republican candidates are suggesting an interest in being both flat and fair, embracing some version of Perry’s 2012 proposal as the first step toward reaching Paul’s ideal. Take U.S. Sen. Ted Cruz, R-Texas, whose talk on taxes has sounded strikingly similar to Perry’s at times. “We should let taxes become so simple that they could be filled out on a postcard,” Cruz wrote in a column for USA Today in October. Yet while Cruz has called for converting the country’s progressive income tax system to a flat tax, his office confirmed that the Fair Tax is his long-term goal. “The senator supports a Fair Tax, ultimately,” spokeswoman Catherine Frazier said. “However, the most immediate, effective way to implement comprehensive tax reform is to pass a simple flat tax — so simple that Americans can file on a postcard. This should be the starting point for reform, and once it’s in place we should pursue a Fair Tax.” Another presidential contender, U.S. Sen. Rand Paul, R-Ky., has also voiced support for a flat tax, but still prefers the vision of his libertarian father, Ron Paul. “I’ve never said I don’t support a sales tax,” Rand Paul told The Texas Tribune recently while in Dallas. He explained that he viewed moving the federal tax system to a flat tax as “an easier concept to get through a legislature because you’re modifying the existing code.” More broadly, Rand Paul said he was interested in stimulating economic growth by reducing the federal taxes overall. “We’ve kind of lost that argument in recent years because many Republicans, including many in Washington, now simply argue for revenue neutral tax reform, which stimulates nothing,” Paul said. For former Arkansas Gov. Mike Huckabee, those talking about the flat tax as a bridge to the Fair Tax are missing the point. “Gov. Huckabee has said many times the Fair Tax is a flat tax, but it’s based on consumption rather than on punishing our productivity,” spokeswoman Alice Stewart said. Another potential presidential contender, former Florida Gov. Jeb Bush, delivered a speech on taxes and income inequality this week in Detroit that reportedly included support for simplifying the tax code, but did not include specific policy proposals. Critics of both flat tax and Fair Tax proposals dismiss them as regressive plans that would amount to tax cuts for higher-income households while increasing the tax burden on middle-class households. But conservatives argue that dramatically simplifying the tax code, or moving to a tax system focused more on consumption than earnings, would be more transparent, simpler and better for the economy in the long run. Cal Jillson, a political science professor at Southern Methodist University, said discussion of flat taxes and consumption taxes works well politically with Republican voters, but described them as “pie-in-the-sky, no-way-in-hell” proposals that won’t ever muster enough support in Congress. “When you talk about tax reform in an environment that is politically polarized as ours, it’s hard to see how you get majority support, let alone a bipartisan package that could be taken to the public by both parties,” Jillson said. “It’s a way of saying, ‘I have no sense of doing anything practical.’ ” While Cruz and Rand Paul have already signaled their positions, Perry, who has been meeting with dozens of policy experts to prepare for a second White House run, may end up tweaking his earlier flat tax plan. “He supports simplifying the tax code, lowering rates for working families, and closing loopholes,” spokeswoman Lucy Nashed said. “Gov. Perry is continuing to work on policy proposals and will announce specific ideas at the appropriate time.” http://www.texastribune.org/2015/02/08/flat-tax-fair-tax/
National Review: The FairTax Makes a Comeback
by: Ryan Lovelace
Republican senator David Perdue of Georgia sounds an awful lot like President Obama when he describes his plan to overhaul the tax code, which would repeal federal taxes and replace them with a consumption tax known as the “FairTax.” “[The FairTax] really levels the playing field in that regardless of who you are, where you are, you’ll pay your fair share, and it will be the same amount,” Perdue tells NRO. “It will be equitable.” Perdue couches his description of the FairTax in rhetorical terms — “levels the playing field,” “pay your fair share,” “equitable” — that could’ve come straight out of Obama’s State of the Union address, and that’s no accident. Whatever the political prospects of the proposal — it has failed over and over again when proposed in the past, and it is expected to meet a similar fate this time around — it could allow the GOP to seize the mantle of economic populism from the Democrats, and, in so doing, to “win” tax reform in the eyes of voters. That’s important, because tax-reform legislation is one of the few big, ostensibly bipartisan efforts the new Congress is expected to undertake, and the scramble to take credit for it ahead of the 2016 presidential election will be fierce. The FairTax legislation put forward in the Senate by Perdue, his fellow Georgia Republican Johnny Isakson, and their colleague Jerry Moran (R., Kan.), was written with 2016 in mind. Perdue says that on Tuesday, before listening to Obama announce his desire to raise taxes once again, he and Isakson discussed the importance of their work in influencing the debate on tax reform. Perdue — the successful manager known for his ability to turn around businesses and revive brands – says he hopes to help move 2016 GOP presidential candidates in the direction of the FairTax. The proposal itself is relatively simple: It would eliminate all federal income, payroll, gift, and estate taxes, and replace them with a 23 percent national sales tax. In addition to making the U.S. economy more competitive on a global scale and putting people back to work, the plan would strip the IRS of its ability to interfere in the lives of ordinary Americans, according to the conservative freshman from Georgia. Other longtime proponents of the idea agree, and argue that by replacing a system that taxes an individual’s earnings with one that exclusively taxes that same individual’s spending, it would allow each citizen the freedom to determine his own tax burden. Perdue’s hopes for 2016 notwithstanding, the FairTax has not been a winning issue in past Republican presidential primaries. A number of GOP primary candidates, from Mike Huckabee in 2008 to Herman Cain in 2012, have failed to win the nomination while championing the proposal. And it will still be a loser come 2016, says Ryan Ellis, the tax-policy director at Grover Norquist’s Americans for Tax Reform. “If this thing [the FairTax] was going to catch on as the next great hot thing, it would have,” Ellis says. “It’s not a practical tax-reform plan for governing, it’s something that people wish, aspirationally, they could put out there.” The tax-reform proposals with the best chance of succeeding in Congress — and helping Republican candidates win in 2016 — are those that move incrementally toward the FairTax’s goals without overhauling the system in one fell swoop, Ellis says. Such proposals would likely combine some of the FairTax’s reforms — such as repealing the death tax and capital-gains taxes — with measures aimed at broadening the tax base of higher-income individuals. The winning formula to achieve fundamental tax reform, according to Ellis, is a plan that is pro-growth, pro-family, and “paid for by, as much as you can, rich guys.” But those who warn that the FairTax lacks political viability only give more motivation to Rob Woodall (R., Ga.), the lead sponsor of FairTax legislation in the House of Representatives. “That’s what I love about this bill: Washington hates this bill,” Woodall says. “There are all sorts of forces in town that discourage this kind of giant reform, but it’s being marketed at a grassroots level.” Woodall’s Georgia district has a history of electing FairTax proponents to Congress. Woodall’s seat was previously occupied by John Linder, a tireless champion who first introduced the FairTax bill in 1999, and reintroduced it in each new Congress until he retired in 2011. He never succeeded in changing the law, but he did quite a bit to build support in his home state. As Americans for Fair Taxation president Steve Hayes tells it, Atlanta-based radio talk-show host Neal Boortz is largely responsible for getting the idea off the ground. Boortz wrote The FairTax Book with Linder and trumpeted his support for the reform to a southeastern audience who readily took to the idea. Hayes’s organization works to garner more support for the idea across the United States. The “power base” of the FairTax proposal has moved out of the Southeast and into the Midwest, Woodall says. Moran’s support as a lead co-sponsor has helped the idea gain traction in Kansas. A top Moran aide who worked on the FairTax bill tells NRO that Moran began laying the groundwork to lead on this issue last year, as former Georgia senator Saxby Chambliss was preparing to retire. Chambliss was a staunch supporter of the FairTax, and the aide says the two offices worked behind the scenes to ensure that the push for tax reform would live on. Woodall thinks the geographical shift in support will help the idea flourish in California and the Northwest. Moreover, he wants to gather supporters in key 2016 Republican-primary states and grow grassroots support in order to influence the GOP’s agenda. But the effort to sell the FairTax primarily to devoted conservatives has left others in the dark as to its possible benefits. Laurence Kotlikoff, an economics professor at Boston University, has studied the FairTax and thinks it is a more progressive proposal than people realize. Kotlikoff says lawmakers’ lack of experience in public finance has led to a misunderstanding of the FairTax. He adds that he thinks Democratic minority leader Nancy Pelosi might even come around to the idea, if she realized that it would help some of the people she purports to care about most: workers. After years toiling under former Senate majority leader Harry Reid (D., Nev.), some conservatives have grown excited by the Senate’s movement on this issue. The Moran staffer thinks a total of 10 or 11 senators may ultimately support the proposal, including new members and others who have changed their minds. The number of original co-sponsors of the FairTax in the House has increased during each of the last three Congresses, peaking this year with 57 total supporters. Barring an unforeseen shift in Congress’s priorities, though, the FairTax appears doomed to fail yet again. Woodall knows the effort is ill-fated, and says he won’t look someone in the eye and tell them that a GOP-led Congress will put the FairTax on the president’s desk — or that the president would ever sign it. For the time being, his goal is more modest: He hopes to harness the relatively small but growing support for the proposal, and to take its message to voters across the country, showing his fellow Republicans that populist economic policies can win back the White House in 2016. “This is a mission to change the way people think about the tax code,” he says. “It’s kind of a crazy idea until you look at it and you say, ‘Golly, why haven’t we done that already?’ Because we know that we can’t win Washington until we win the American voter across the country.” – https://fairtax.org/articles/the-fairtax-makes-a-comeback
Story 2: Tea Party Traitor and Neoconservative Republican Poster Boy Marco Rubio Running For President in 2016 and For Government Intervention In The Middle East — Courts Mitt Romney Endorsement — Kiss of Death — Video
Sen. Marco Rubio announces presidential run
Sen. Marco Rubio Announces 2016 Presidential Bid • 4/13/15 •
Marco Rubio Announces 2016 Presidential Bid
Sen Marco Rubio announces presidential bid
Michelle Malkin calls out Marco Rubio for “posing as a Tea Party spokesman”
Rand Paul, Marco Rubio, Ted Cruz fight on the Senate floor
Laura Ingraham Confronts Marco Rubio Over Immigration Reform: ‘Stop Dividing The Republican Party’
Ann Coulter blasts immigration bill, Rubio – Rubio is the Jack Kevorkian of the Republican Party
Ann Coulter trashes Marco Rubio
Brit Hume and Laura Ingraham argue about Marco Rubio
Mark Levin grills Marco Rubio on immigration proposal
A Conversation with Senator Marco Rubio
Marco Rubio (American Neocon) on Iran “No option should be off the table”
Marco Rubio Is a Polished Performer, but He’s Out of Position
Why You Should NOT Vote For Marco Rubio In 2016
Marco Rubio Grills Hillary Clinton About Benghazi (Testimony)
Mark Levin: “I despise the neocons! I am not a neocon!”
Neoconservatism: An Obituary for an Idea (Cato Institute Book Forum, 2011)
Congressman Ron Paul, MD – We’ve Been NeoConned
Rubio jumps into White House race with jab at Hillary Clinton
By Ben Kamisar
Sen. Marco Rubio (R-Fla.) on Monday entered the race for the White House, telling donors on a conference call that he is “uniquely qualified” to lead the Republican Party into battle against Hillary Clinton in 2016.
“I feel uniquely qualified to not just make that argument, but to outline the policies that we need to have in order to achieve it,” Rubio told the donors, according to The Associated Press.
Portraying Clinton as a candidate of the past, Rubio, 43, talked about the opportunity awaiting the GOP as it seeks to recapture the White House after eight years out of power.
“The Republican Party, for the first time in a long time, has a chance in this election to be the party of the future,” Rubio said on the call.
“Just yesterday, we heard from a leader from yesterday who wants to take us back to yesterday, but I feel that this country has always been about tomorrow.”
Rubio is expected to officially launch his candidacy Monday evening in Miami against the backdrop of the Freedom Tower, a setting that will give him a chance to tout his heritage as the son of Cuban parents who fled to America in the 1950s.
The Florida senator, who is serving in only his first term, is entering an increasingly crowded GOP field that already includes Sens. Ted Cruz (Texas) and Rand Paul (Ky.). A host of other candidates are waiting in the wings, including Wisconsin Gov. Scott Walker and former Florida Gov. Jeb Bush.
It had long been thought that Rubio would not run for the White House against Bush, given their personal history and shared base of support in the Florida Republican Party.
But much like Obama in 2008, Rubio appears willing to gamble his political future on the notion that his party will be looking for a fresh face, particularly given the GOP’s difficulty in attracting minority voters in the last two presidential elections.
If elected, Rubio would become the first Hispanic president in American history.
Rubio told ABC News’ George Stephanopoulos in an interview Monday that he believes he’s “absolutely” the best candidate for the Oval Office.
“I think the 21st century can be the American century, and I believe that I can lead this country in that direction,” he said.
Rubio is trying to generate buzz for his presidential campaign the day after Clinton jumped into the racewith an online video where she declared her desire to be the “champion” of “everyday Americans.”
While Clinton’s rollout could overshadow Rubio’s, it could also play to his advantage by allowing him to draw a contrast with the former secretary of State, who has been a presence on the national stage for nearly three decades.
Thus far in the race, Rubio is polling outside the top tier of Republicans hopefuls.
But Rubio, a staunch conservative who was deemed a rising star after his election victory in 2010, is very well liked among Republican voters. Recent numbers from Democratic Public Policy Polling found that 55 percent had a favorable view of him, the highest of any potential GOP candidate.
Still, in order to win the nomination, Rubio will have to assure conservatives who were turned off by his involvement in the Senate’s failed immigration reform effort in 2013.
Rubio helped write a bill with Democrats that passed the Senate but died in the House after an outpouring of conservative opposition.
He has tried to make amends for his role crafting that bill, telling activists in February that he’s “learned” from the experience that securing the border must come first.
“You can’t just tell people you’re going to secure the border. … You have to do that, they have to see it, they have to see it working, and then they’re going to have a reasonable conversation with you about the other parts, but they’re not going to even want to talk about that until that’s done first,” he said at the Conservative Political Action Conference.
Rubio is expected to make foreign policy one of the centerpieces of his campaign, and has emerged as one of the most vocal critics of Obama’s move to normalize diplomatic relations with Cuba.
Following his campaign launch, Rubio will return to Washington for Senate business, including a high-profile Foreign Relations Committee hearing on Iran.
On Friday, he’ll head to New Hampshire for a full day of campaigning in the critical primary state.
Sen. Marco Rubio has been cultivating a relationship with Mitt Romney and his intimates, landing some of the 2012 Republican nominee’s top advisers and donors and persistently courting others as he readies an expected 2016 presidential campaign.
In a crowded field of contenders, the imprimatur of Romney could help clear Rubio’s path into the top tier. Since Romney announced in January that he would not run for the White House again, he and Rubio have had at least two lengthy phone calls in which Romney encouraged and mentored the 43-year-old Florida senator about the political landscape, according to a Romney associate.
Rubio and Romney have built a warm and trusting rapport, in contrast to the frostiness that exists between Romney and the two current GOP front-runners, former Florida governor Jeb Bush and Wisconsin Gov. Scott Walker. When Romney said in January that it was time to turn to the “next generation of Republican leaders,” it was widely interpreted as a swipe at Bush and a boost to a fresher face, such as Rubio.
In one-on-one meetings and communications with members of Romney’s inner circle, Rubio has impressed them with what they see as his compelling personal story, his depth and positions on policies, and his respect for Romney and his legacy in the Republican Party.
For Rubio, winning over key elements of the Romney coalition could give him a stronger foundation for a competitive campaign. But the support from Romney’s team alone would not guarantee Rubio success against Bush’s well-funded juggernaut or Walker’s grass-roots appeal.
Rubio has signed up two prominent former Romney officials in recent weeks. Rich Beeson, Romney’s 2012 national political director, has been tapped as Rubio’s likely deputy campaign manager, while Jim Merrill, Romney’s longtime New Hampshire strategist, is on board to play the same role for Rubio.
“For me, his substance, his skill and his story really stuck out,” Merrill said. “I always said if Mitt had decided to run again, I’d be with him. But when he decided not to go, I took a careful look at the field, and Marco represents the next generation of Republican leadership.”
Rubio’s courtship has been particularly intense with Spencer Zwick, who served as national finance chairman of Romney’s $1 billion campaign and is seen as the keeper of the Romney flame. Zwick said in an interview that the senator solicits advice from him regularly in phone calls, e-mails and text messages.
Rubio asks Zwick about how to assemble a campaign infrastructure and win the nomination, about lessons learned from Romney’s 2012 loss. Both fathers of young children, the two men talk about their families, too.
Zwick said he remains unaffiliated in the 2016 sweepstakes, but heaped praise on Rubio.
“Have you watched him speak?” Zwick asked. “This guy gives a message about the American dream that is compelling. People can say, ‘Oh, it’s the same speech every time,’ but you know what? Ronald Reagan did that, too, and it happened to work.”
Zwick called Rubio “an astute politician and a genuine person,” saying he “is universally well-liked by donors.”
Still, Bush has established himself early as the 2016 field’s fundraising dynamo, signing up many of Romney’s biggest bundlers, especially in New York and Florida, where he threatens to squeeze Rubio out.
A handful of former senior Romney aides and advisers have fanned out to work for an array of likely candidates besides Rubio, including Bush, Walker, former Texas governor Rick Perry, New Jersey Gov. Chris Christie and Louisiana Gov. Bobby Jindal.
The biggest Romney fundraiser helping Rubio is Wayne Berman, a fixture in GOP fundraising circles and a co-chairman of Romney’s 2012 national finance committee. Many Romney loyalists — including friends and associates from Bain Capital, the Mormon Church or the Salt Lake City Olympics — have stayed unaffiliated and are looking for signals of Romney’s preference.
Romney is unlikely to endorse a candidate anytime soon and has invited most of the GOP 2016 field to his annual policy summit with top donors and business leaders in June in Park City, Utah, where Romney has a home.
Rubio also has roots in the Mountain West. Although he was born into the Catholic Church, Rubio lived for several years of his childhood in Las Vegas and, during that time, was baptized in the Mormon Church. In his teen years, he and his family returned to Florida and rejoined the Catholic Church, although many of Rubio’s cousins remain affiliated with the Church of Jesus Christ of Latter-day Saints.
Some Romney loyalists harbor bad feelings about several candidates. Privately, they say Bush was not as active in his support as they expected in 2012 and that they think he tried to muscle Romney out of the 2016 race in January.
They hold a grudge against Walker for sharply criticizing Romney in his 2013 book, “Unintimidated,” for doing “a lousy job” connecting with voters. And many Romney insiders were steamed at Christie for his high-profile embrace of President Obama, after Hurricane Sandy devastated the Jersey Shore in the final week of the campaign.
By contrast, Romney’s allies almost universally praise Rubio, who was vetted as a possible vice-presidential pick and worked on Romney’s behalf during the campaign. They singled out his prime-time speech — introducing Romney — at the 2012 Republican National Convention in Tampa.
“He was an exceptional surrogate,” said Matt Waldrip, a former Romney finance aide and Zwick associate. “When he went to events, people showed up. He packed the house, whether fundraising or otherwise. He did whatever we asked him to,
clearly interested in helping the cause and helping the ticket.”
On Tuesday, Rubio met at the Russell Senate Office Building in Washington for an hour with Lanhee Chen, Romney’s former policy director, who remains an adviser and friend. Chen said he was impressed by Rubio’s preparation for the meeting, which focused on foreign and domestic policy, as well as his depth on the issues.
“Senator Rubio has spent the last several years developing thoughtful conservative policy solutions, and he has a personal story that makes those solutions even more compelling,” Chen said.
Rubio’s camp has been in touch with other Romney associates, includingPeter Flaherty, a former Boston prosecutor who for years was Romney’s chief liaison to conservative movement leaders. Those talks have been informal, and Flaherty, like Chen and Zwick, remains uncommitted to a 2016 candidate.
“It’s elbow grease,” said one Romney confidant who spoke on the condition of anonymity to talk candidly about Rubio’s outreach. “Marco’s actually picking up the phone and calling people, saying, ‘Listen, I want to introduce myself and tell you who I am and what I stand for.’ It’s good politics.”
Terry Sullivan — who ran Romney’s South Carolina primary campaign in 2008 and for years has been a top Rubio adviser — has been helping him facilitate his outreach into Romney’s world. Sullivan is executive director of Rubio’s Reclaim America PAC and is his likely campaign manager. Rubio’s Senate chief of staff, Alberto Martinez, was a Florida-based adviser to Romney’s campaign in 2012.
Rubio is expected to formally launch his presidential bid next month, although aides stressed this week that no final decision has been made on the timing or venue. His advisers are preparing for a long and steady race, with a focus on laying the groundwork in the early-voting states.
Although he has been overshadowed recently by Bush and Walker, Rubio has generated some buzz among Republican insiders. His speeches at recent donor conclaves, including at the Club for Growth last month in Palm Beach, Fla., drew rave reviews.
Rubio has said he can raise the funds needed to mount a serious presidential bid. Norman Braman, a billionaire South Florida auto dealer, is expected to donate as much as $10 million to Rubio and his anticipated super PAC.
Rubio has his own national donor network, which he began cultivating in his upstart 2010 Senate campaign. The group includes donors who participate in the political network organized by industrialists Charles and David Koch, whose California meeting Rubio addressed in January.
But Rubio is making inroads elsewhere, too. He dined alone last week in Washington with Sheldon Adelson, the billionaire Las Vegas casino magnate who spent tens of millions of dollars trying to elect Romney in 2012.
Sen. Roy Blunt (R-Mo.), who was Romney’s liaison on Capitol Hill in 2012, recently explained why so many Republican insiders find Rubio appealing.
“I often have a vision of Marco in the cloakroom of the Senate, when not much is going on, trying to watch his son’s football games on his smartphone,” he said.
Blunt then used a descriptor that few would have applied to Romney: “humanizing.”
Story 1: Up Up and Away Interest Rates Will Go — Until The Next Recession Hits — Fed Debates Use of Word Patient — It Is The Economy Stupid, Not The Stock Market and Wealth Effect — The Coming Deflation Caused By The Fed? — The Failure of Command and Control of Money’s Price — Interest Rates — Videos
Up Up and Away
Fifth Dimension – Up Up & Away , My Beautiful Balloon
Janet Yellen’s Senate Testimony in Two Minutes
The Fed is Trapped in ZIRP World
Keiser Report: Derp-like policy of ZIRP and NIRP (E613)
Federal Reserve Chair Janet Yellen: 5.7% Unemployment Rate Paints Rosier Picture Than U-6 Rate
Yellen Says Fed Still ‘patient’ on Raising Rates
Peter Schiff on The Strong Dollar, U.S. market risk and Fed Chair Janet Yellen
Jim Rickards on Fed Chair Janet Yellen and The Strong Dollar
What is QUANTiTATIVE EASING | Federal Reserve (Central Banks)
Fed Caused Oil Crash, Stocks Next
The Fed, interest rates, and the markets
When will the Fed raise interest rates
Plosser: Deflation not a risk to US economy
Michael Snyder- Deflation then Inflation Through the Roof
The Fed and Fractional Reserve Banking Caused the Great Depression – Milton Friedman
Milton Friedman – Money and Inflation
Milton Friedman – Monetary Revolutions
Milton Friedman on Money / Monetary Policy (Federal Reserve) Part 1
Milton Friedman on Money / Monetary Policy (Federal Reserve) Part 2
Booms and Busts, Mises vs Keynes – And Religion As a Bulwark against Tyranny
NEW WORLD ORDER 2015 ECONOMIC COLLAPSE
Colorful Time-Lapse of Hot Air Balloons in New Mexico
Abba – Money, Money, Money
WHAT IT MEANS IF FED NO LONGER SAYS IT’S ‘PATIENT’ ON RATES
BY MARTIN CRUTSINGER
For the Federal Reserve, patience may no longer be a virtue.
Surrounding the Fed’s policy meeting this week is the widespread expectation that it will no longer use the word “patient” to describe its stance on raising interest rates from record lows.
The big question is: What will that mean?
Many economists say the dropping of “patience” would signal that the Fed plans to start raising rates in June to reflect a steadily strengthening U.S. job market. Others foresee no rate hike before September. And a few predict no increase before year’s end at the earliest.
Complicating the decision is a surging U.S. dollar, which is keeping inflation far below the Fed’s target rate and posing a threat to U.S. corporate profits and possibly to the economy. A rate increase could send the dollar even higher.
In a statement it will issue when its meeting ends Wednesday and in a news conference Chair Janet Yellen will hold afterward, the Fed isn’t likely to telegraph its timetable. Yellen has said that any decision to raise rates will reflect the latest economic data and that the Fed must remain flexible.
Still, nervous investors have been selling stocks out of concern that a rate increase – which could slow borrowing and spending and weigh on the economy – is coming soon.
“I think the odds are better than 50-50 that the Fed … will drop the word `patient’ at the March meeting, and that would put an initial rate hike in play, perhaps as early as the June meeting,” said David Jones, author of several books about the Fed.
Historically, the Fed raises rates as the economy strengthens in order to control growth and prevent inflation from overheating. Over the past 12 months, U.S. employers have added a solid 200,000-plus jobs every month. And unemployment has reached a seven-year low of 5.5 percent, the top of the range the Fed has said is consistent with a healthy economy.
The trouble is that the Fed isn’t meeting its other major policy goal – achieving stable inflation, which it defines as annual price increases of around 2 percent. According to the Fed’s preferred inflation gauge, prices rose just 0.2 percent over the past 12 months. In part, excessively low U.S. inflation reflects sinking energy prices and the dollar’s rising value, which lowers the prices of goods imported to the United States.
It isn’t just inflation that remains below optimal levels. Though the job market has been strong, the overall economy has yet to regain full health. The economy slowed to a tepid 2.2 percent annual rate in the October-December quarter, and economists generally think the current quarter might be even weaker. Manufacturers are struggling with falling exports, partly because of the strong dollar, and consumers – the drivers of the economy – have seemed reluctant to spend their windfall savings from cheaper energy.
What’s more, pay for many workers remains stagnant, and there are 6.6 million part-timers who can’t find full-time jobs – nearly 50 percent more than in 2007, before the recession began.
For those reasons, some analysts think it would be premature to raise rates soon.
“The last thing the Fed wants to do right now is spook the markets and the economy into an even slower growth trajectory,” said Brian Bethune, an economics professor at Tufts University.
After it met in December, the Fed said for the first time that it would be “patient’ about raising rates. Yellen said that meant there would be no increase at the Fed’s next two meetings. And in testimony to Congress last month, she cautioned that even when “patient” is dropped, it won’t necessarily signal an imminent rate hike – only that the Fed will think the economy has improved enough for it to consider a rate increase on a “meeting-by-meeting basis.”
Some economists say the Fed may tweak its policy statement this week to signal that a higher inflation outlook would be needed before any rate hike. And they expect the Fed to go further in coming months to ready investors for the inevitable.
“The process is going to be glacial,” said Diane Swonk, chief economist at Mesirow Financial in Chicago. “They want to prepare the markets for change, but they don’t want to scare them.”
Though Swonk thinks the Fed will drop “patient” from its statement this week, she doesn’t expect a rate hike before September. Even then, she foresees only small increases in its benchmark rate.
Sung Won Sohn, an economics professor at the Martin Smith School of Business at California State University, suggested that the Fed’s strategy in beginning to raise rates won’t be to slow the economy. Rather, he thinks the goal will be to manage the expectations of investors, some of whom weren’t even in business in 2004, the last time the Fed began raising rates.
“The Fed is just trying to send a message that the world is about to enter a new age after a long period of low interest rates to a period of rising rates,” Sohn said.
The End of “Patient” and Questions for Yellen, by Tim Duy: FOMC meeting with week, with a subsequent press conference with Fed Chair Janet Yellen. Remember to clear your calendar for this Wednesday. It is widely expected that the Fed will drop the word “patient” from its statement. Too many FOMC participants want the opportunity to debate a rate hike in June, and thus “patient” needs to go. The Fed will not want this to imply that a rate hike is guaranteed at the June meeting, so look for language emphasizing the data-dependent nature of future policy. This will also be stressed in the press conference. Of interest too will be the Fed’s assessment of economic conditions since the last FOMC meeting. On net, the data has been lackluster – expect for the employment data, of course. The latter, however, is of the highest importance to the Fed. I anticipate that they will view the rest of the data as largely noise against the steadily improving pace of underlying activity as indicated by employment data. That said, I would expect some mention of recent softness in the opening paragraph of the statement. I don’t think the Fed will alter its general conviction that low readings on inflation are largely temporary. They may even cite improvement in market-based measures of inflation compensation to suggest they were right not to panic at the last FOMC meeting. I am also watching for how they describe the international environment. I would not expect explicit mention of the dollar, but maybe we will see a coded reference. Note that in her recent testimony, Yellen said:
But core PCE inflation has also slowed since last summer, in part reflecting declines in the prices of many imported items and perhaps also some pass-through of lower energy costs into core consumer prices.
Stronger dollar means lower prices of imported items. The press conference will be the highlight of the meeting. Presumably, Yellen will continue to build the case for a rate hike. Since the foundation of that case rests on the improvement in labor markets and the subsequent impact on inflationary pressures, it is reasonable to ask:
On a scale of zero to ten, with ten being most confident, how confident is the Committee that inflation will rise toward target on the basis on low – and expected lower – unemployment?
Considering that low wage growth suggests it is too early to abandon Yellen’s previous conviction that unemployment is not the best measure of labor market tightness, we should consider:
Is faster wage growth a precondition to raising interest rates?
I expect the answer would be “no, wages are a lagging indicator.” The Federal Reserve seems to believe that policy will still remain very accommodative even after the first rate hike. We should ask for a metric to quantify the level of accommodation:
What is the current equilibrium level of interest rates? Where do you see the equilibrium level of interest rates in one year?
A related question regards the interpretation of the yield curve:
Do you consider low interest long-term interest rates to be indicative of loose monetary conditions, or a signal that the Federal Reserve needs to temper its expectations of the likely path of interest rates as indicated in the “dot plot”?
The dollar is appreciating at the fastest rate in many years. Is the appreciating dollar a drag on the US economy, or is any negative impact offset by the positive demand impact of looser monetary policy abroad? How much will the dollar need to appreciate before it impacts the direction of monetary policy?
Given that the Fed seems determined to raise interest rates, we should probably be considering some form of the following as a standard question:
Consider the next six months. Which is greater – the risk of moving too quickly to normalize policy, or the risk of delay? Please explain, with specific reference to both risks.
Finally, a couple of communications questions. First, the Fed is signaling that they do not intend to raise rates on a preset, clearly communicated path like the last hike cycle. Hence, we should not expect “patient” to be replaced with “measured.” But it seems like the FOMC is too contentious to expect them to shift from no hike one meeting to 25bp the next, then back to none – or maybe 50bp. So, let’s ask Yellen to explain the plan:
There appears to be an effort on the part of the FOMC to convince financial markets that rate hikes, when they begin, will not be on a pre-set path. Given the need for consensus building on the FOMC, how can you credibly commit to renegotiate the direction of monetary policy at each FOMC meeting? How do you communicate the likely direction of monetary policy between meetings?
Finally, as we move closer to policy normalization, the Fed should be rethinking the “dot plot,” which was initially conceived to show the Fed was committed to a sustained period of low rates. Given that the dot-plot appears to be fairly hawkish relative to market expectations, it may not be an appropriate signal in a period of rising interest rates. Time for a change? But is the Fed considering a change, and when will we see it? This leads me to:
Cleveland Federal Reserve President Loretta Mester has suggested revising the Summary of Economic Projections to explicitly link the forecasts of individual participants with their “dots” in the interest rate projections. Do you agree that this would be helpful in describing participants’ reaction functions? When will this or any other revisions to the Summary of Economic Projections be considered?
Bottom Line: By dropping “patient” the Fed will be taking another step toward the first rate hike of this cycle. But how long do we need to wait until that first hike? That depends on the data, and we will be listening for signals as to how, or how not, the Fed is being impacted by recent data aside from the positive readings on the labor market. http://economistsview.typepad.com/economistsview/fed_watch/
Patient’ is History: The February employment report almost certainly means the Fed will no longer describe its policy intentions as “patient” at the conclusion of the March FOMC meeting. And it also keep a June rate hike in play. But for June to move from “in play” to “it’s going to happen,” I still feel the Fed needs a more on the inflation side. The key is the height of that inflation bar. The headline NFP gain was a better-than-expected 295k with 18k upward adjustment for January. The 12-month moving average continues to trend higher:
Unemployment fell to 5.5%, which is the top of the central range for the Fed’s estimate of NAIRU. Still, wage growth remains elusive:
Is wage growth sufficient to stay the Fed’s hand? I am not so sure. Irecently wrote:
My take is this: To get a reasonably sized consensus to support a rate hike, two conditions need to be met. One is sufficient progress toward full-employment with the expectation of further progress. I think that condition has already been met. The second condition is confidence that inflation will indeed trend toward target. That condition has not been met. To meet that condition requires at least one of the following sub-conditions: Rising core-inflation, rising market-based measures of inflation compensation, or accelerating wage growth. If any were to occur before June, I suspect it would be the accelerating wage growth.
I am less confident that we will see accelerating wage growth by June, although I should keep in mind we still have three more employment reports before that meeting. Note, however, low wage growth does not preclude a rate hike. The Fed hiked rates in 1994 in a weak wage growth environment:
And again in 2004 liftoff occurred on the (correct) forecast of accelerating wage growth:
So wage growth might not be there in June to support a rate hike. And, as I noted earlier this weaker, I have my doubts on whether core-inflation would support a rate hike either. That leaves us with market-based measures of inflation compensation. And at this point, that just might be the key:
If bond markets continue to reverse the oil-driven inflation compensation decline, the Fed may see a way clear to hiking rates in June. But the pace and timing of subsequent rate hikes would still be data dependent. I would anticipate a fairly slow, halting path of rate hikes in the absence of faster wage growth. Bottom Line: “Patient” is out. Tough to justify with unemployment at the top of the Fed’s central estimates of NAIRU. Pressure to begin hiking rates will intensify as unemployment heads lower. The inflation bar will fall, and Fed officials will increasingly look for reasons to hike rates rather than reasons to delay. They may not want to admit it, but I suspect one of those reasons will be fear of financial instability in the absence of tighter policy. June is in play.
Ferguson was an advisor to John McCain’s U.S. presidential campaign in 2008, and announced his support for Mitt Romney in 2012 and has been a vocal critic of Barack Obama.[6][7]
Early life
Ferguson was born in Glasgow, Scotland, on 18 April 1964. His father was a doctor and his mother a physics teacher.[8][9] He attended The Glasgow Academy.[10] He was brought up as, and remains, an atheist.[11]
Ferguson cites his father as instilling in him a strong sense of self-discipline and of the moral value of work, while his mother encouraged his creative side.[12] His journalist maternal grandfather encouraged him to write.[12] Unable to decide on studying an English or a history degree at university, Ferguson cites his reading of War and Peace as persuading him towards history.[9]
University of Oxford
Ferguson received a Demyship (half-scholarship) at Magdalen College, Oxford.[13] While there he wrote the 90 minute student film ‘The Labours of Hercules Sprote’ and became best friends with Andrew Sullivan, based on a shared affinity for right-wing politics and punk music.[14] He had become a Thatcherite by 1982, identifying the position with “the Sex Pistols‘ position in 1977: it was a rebellion against the stuffy corporatism of the 70s.”[9] While at university “He was very much a Scot on the make … Niall was a witty, belligerent bloke who seemed to have come from an entirely different planet,” according to Simon Winder.[14]Ferguson has stated that “I was surrounded by insufferable Etonians with fake Cockney accents who imagined themselves to be working-class heroes in solidarity with the striking miners. It wasn’t long before it became clear that the really funny and interesting people on campus were Thatcherites.”[14]
He graduated with a first-class honours degree in history in 1985.[13] He received his D.Phil from Magdalen College in 1989, and his dissertation was entitled “Business and Politics in the German Inflation: Hamburg 1914–1924”.[15]
Fellow academics have questioned Ferguson’s commitment to scholarship. Benjamin Wallace-Wells, an editor of The Washington Monthly, comments that
“The House of Rothschild remains Ferguson’s only major work to have received prizes and wide acclaim from other historians. Research restrains sweeping, absolute claims: Rothschild is the last book Ferguson wrote for which he did original archival work, and his detailed knowledge of his subject meant that his arguments for it couldn’t be too grand.”[20]
John Lewis Gaddis, a Cold War era historian, characterised Ferguson as having unrivaled “range, productivity and visibility” at the same time as criticising his work as being “unpersuasive”. Gaddis goes on to state that “several of Ferguson’s claims, moreover, are contradictory”.[21]
Marxist historian Eric Hobsbawm has praised Ferguson as an excellent historian.[22] However, he has also criticised Ferguson, saying, on the BBC Radio programme Start the Week, that he was a “nostalgist for empire”.[23] Ferguson responded to the above criticisms in a Washington Post “Live Discussions” online forum in 2006.[24][clarification needed]
Business career
In 2007, Ferguson was appointed as an investment management consultant by GLG Partners, focusing on geopolitical risk as well as current structural issues in economic behaviour relating to investment decisions.[25] GLG is a UK-based hedge fund management firm headed by Noam Gottesman.[26]
Ferguson has often described the European Union as a disaster waiting to happen,[29] and has criticised President Vladimir Putin of Russia for authoritarianism. In Ferguson’s view, certain of Putin’s policies, if they continue, may stand to lead Russia to catastrophes equivalent to those that befell Germany during the Nazi era.[30]
Books
The Cash Nexus
In his 2001 book, The Cash Nexus, which he wrote following a year as Houblon-Norman Fellow at the Bank of England,[28] Ferguson argues that the popular saying, “money makes the world go ’round”, is wrong; instead he presented a case for human actions in history motivated by far more than just economic concerns.
Colossus and Empire
In his books Colossus and Empire, Ferguson presents a reinterpretation of the history of the British Empire and in conclusion proposes that the modern policies of the United Kingdom and the United States, in taking a more active role in resolving conflict arising from the failure of states, are analogous to the ‘Anglicization’ policies adopted by the British Empire throughout the 19th century.[31][32] In Colossus, Ferguson explores the United States’ hegemony in foreign affairs and its future role in the world.[33][34]
War of the World
The War of the World, published in 2006, had been ten years in the making and is a comprehensive analysis of the savagery of the 20th century. Ferguson shows how a combination of economic volatility, decaying empires, psychopathic dictators, and racially/ethnically motivated (and institutionalised) violence resulted in the wars and the genocides of what he calls “History’s Age of Hatred”. The New York Times Book Reviewnamed War of the World one of the 100 Notable Books of the Year in 2006, while the International Herald Tribune called it “one of the most intriguing attempts by an historian to explain man’s inhumanity to man“.[35]Ferguson addresses the paradox that, though the 20th century was “so bloody”, it was also “a time of unparalleled [economic] progress”. As with his earlier work Empire,[36]War of the World was accompanied by aChannel 4 television series presented by Ferguson.[37]
The Ascent of Money
Published in 2008, The Ascent of Money examines the long history of money, credit, and banking. In it he predicts a financial crisis as a result of the world economy and in particular the United States using too much credit. Specifically he cites the China–America dynamic which he refers to as Chimerica where an Asian “savings glut” helped create the subprime mortgage crisis with an influx of easy money.[38] While researching this book, in early 2007, he attended a conference in Las Vegas where a hedge fund manager stated there would never be another recession, Ferguson stood up and challenged him on it. Later the 2 agreed a 7 to 1 bet, that there would be another recession, for $14,000, with Ferguson paying that amount if he lost and winning $98,000. “I said, ‘Never is a very bad timeframe,'” Ferguson said. “‘Let’s say five years.'” Ferguson collected his winnings as he knew having researched the book and written several papers on economics in history, so knew another recession would definitely occur and with this bet placed a timeline of it occurring before 2012.[39]
Civilization
Published in 2011, Civilization: The West and the Rest examines what Ferguson calls the most “interesting question” of our day: “Why, beginning around 1500, did a few small polities on the western end of the Eurasian landmass come to dominate the rest of the world?” He attributes this divergence to the West’s development of six “killer apps” largely missing elsewhere in the world – “competition, science, the rule of law, medicine, consumerism and the work ethic”.[17] A related documentary Civilization: Is the West History? was broadcast as a six-part series on Channel 4 in March and April 2011.[40]
Opinions and research
World War I
In 1998, Ferguson published the critically acclaimed The Pity of War: Explaining World War One, which with the help of research assistants he was able to write in just five months.[13][14] This is an analytic account of what Ferguson considered to be the ten great myths of the Great War. The book generated much controversy, particularly Ferguson’s suggestion that it might have proved more beneficial for Europe if Britain had stayed out of the First World War in 1914, thereby allowing Germany to win.[41] Ferguson has argued that the British decision to intervene was what stopped a German victory in 1914–15. Furthermore, Ferguson expressed disagreement with the Sonderweg interpretation of German history championed by some German historians such as Fritz Fischer, Hans-Ulrich Wehler, Hans Mommsen and Wolfgang Mommsen, who argued that the German Empire deliberately started an aggressive war in 1914. Likewise, Ferguson has often attacked the work of the German historian Michael Stürmer, who argued that it was Germany’s geographical situation in Central Europe that determined the course of German history.
On the contrary, Ferguson maintained that Germany waged a preventive war in 1914, a war largely forced on the Germans by reckless and irresponsible British diplomacy. In particular, Ferguson accused the British Foreign SecretarySir Edward Grey of maintaining an ambiguous attitude to the question of whether Britain would enter the war or not, and thus confusing Berlin over just what was the British attitude towards the question of intervention in the war.[42] Ferguson accused London of unnecessarily allowing a regional war in Europe to escalate into a world war. Moreover, Ferguson denied that the origins of National Socialismcould be traced back to Imperial Germany; instead Ferguson asserted the origins of Nazism could only be traced back to the First World War and its aftermath.
Ferguson attacked a number of ideas which he called “myths” in the book. They are listed here, (with his counter-arguments in parentheses):
Germany was a highly militarist country before 1914. (Ferguson argued that Germany was Europe’s most anti-militarist country when compared to countries like Britain and France.)[43]
The naval threat posed by Germany drove Britain into an informal alliance with France and Russia before 1914. (Ferguson argues that the British decided to align themselves with Russia and France seeing them as more influential and powerful than Germany.)[44]
British policy was due to a legitimate fear of Germany. (Ferguson shows how Germany posed no significant threat to Britain and British fears were driven by propaganda and economic self interest.)[45]
The pre-1914 arms race was consuming increasingly larger portions of national budgets at an unsustainable rate. (Ferguson demonstrates using actual budget information of the European powers that the only limitations on more military spending before 1914 were political, not economic.)[46]
That World War I was an act of aggression on the part of Germany that provoked the British to stop Germany from conquering Europe. (Ferguson infers that if Germany had been victorious over France and Russia, something like the European Union would have been created in 1914. It would have been for the best if Britain had chosen to opt out of war in 1914, as Germany just wanted its “place in the sun.”)[47]
Most people were enthusiastic when the war started in 1914. (Ferguson claims that most Europeans were saddened by the start of war, especially when it dragged on long after it was supposed to end.)[48]
That propaganda was successful in making men wish to fight. (Ferguson states that propaganda was not nearly as effective as most experts argue.)[49]
The Allies utilized their economic resources to the fullest. (Ferguson argues that the allies made poor use of their vast economic resources such as those coming from their colonies as well as corruption in the war time governments. France and Britain both possessed huge colonial possessions that offered a plethora of resources as well as man power.)[50]
That the British and the French possessed better armies than the central powers. (Ferguson claims that the German Army was superior, with better equipment and leadership.)[51]
The Allies were better at killing Germans throughout the war. (Ferguson statistically shows that the Germans were actually far superior in exacting casualties than the Allies, this is due to German strategy and use of poison gas.)[52]
The majority of soldiers hated fighting in the war due to intolerable conditions. (Ferguson asserts that most soldiers fought due to nationalism and a sense of duty.)[53]
The British treated German prisoners more humanely than the Germans did. (Ferguson cites numerous occasions in which British officers ordered the killing of German prisoners of war.)[54]
Germany was faced with reparations that could not be paid except at the expense of the German economy. (Ferguson attempts to prove that Germany could have paid reparations if they had been willing.)[55]
Another controversial aspect of The Pity of War is Ferguson’s use of counterfactual history also known as “speculative” or “hypothetical” history. In the book, Ferguson presents a hypothetical version of Europe being, under Imperial German domination, a peaceful, prosperous, democratic continent, without ideologies like communism or fascism.[56] In Ferguson’s view, had Germany won World War I, then the lives of millions would have been saved, something like the European Union would have been founded in 1914, and Britain would have remained an empire as well as the world’s dominant financial power.[56]
Ferguson sometimes champions counterfactual history, also known as “speculative” or “hypothetical” history, and edited a collection of essays, titled Virtual History: Alternatives and Counterfactuals (1997), exploring the subject.
Ferguson likes to imagine alternative outcomes as a way of stressing the contingent aspects of history. For Ferguson, great forces don’t make history; individuals do, and nothing is predetermined. Thus, for Ferguson, there are no paths in history that will determine how things will work out. The world is neither progressing nor regressing; only the actions of individuals determine whether we will live in a better or worse world.
His championing of the method has been controversial within the field.[59]
In a 2011 review of Ferguson’s book Civilization: The West and the Rest, Noel Malcolm (Senior Research Fellow in History at All Souls College at Oxford University) stated that: “Students may find this an intriguing introduction to a wide range of human history; but they will get an odd idea of how historical argument is to be conducted, if they learn it from this book.”[60]
Ferguson is critical of what he calls the “self-flagellation” that he says characterises modern European thought.
“The moral simplification urge is an extraordinarily powerful one, especially in this country, where imperial guilt can lead to self-flagellation,” he told a reporter. “And it leads to very simplistic judgments. The rulers of western Africa prior to the European empires were not running some kind of scout camp. They were engaged in the slave trade. They showed zero sign of developing the country’s economic resources. Did Senegal ultimately benefit from French rule? Yes, it’s clear. And the counterfactual idea that somehow the indigenous rulers would have been more successful in economic development doesn’t have any credibility at all.”[17]
Bernard Porter attacked Empire in The London Review of Books as a “panegyric to British colonialism”.[63] Ferguson in response to this drew Porter’s attention to the conclusion of the book, where he writes: “No one would claim that the record of the British Empire was unblemished. On the contrary, I have tried to show how often it failed to live up to its own ideal of individual liberty, particularly in the early era of enslavement, transportation and the ‘ethnic cleansing’ of indigenous peoples.” Ferguson argues however that the British Empire was preferable to the alternatives:
‘The 19th-century empire undeniably pioneered free trade, free capital movements and, with the abolition of slavery, free labour. It invested immense sums in developing a global network of modern communications. It spread and enforced the rule of law over vast areas. Though it fought many small wars, the empire maintained a global peace unmatched before or since. In the 20th century too the empire more than justified its own existence. For the alternatives to British rule represented by the German and Japanese empires were clearly – and they admitted it themselves – far worse. And without its empire, it is inconceivable that Britain could have withstood them.’[63]
Exchange with Pankaj Mishra
In November 2011 Pankaj Mishra reviewed Civilisation: The West and the Rest unfavourably in the London Review of Books.[64] Ferguson demanded an apology and threatened to sue Mishra on charges of libel due to allegations of racism.[65]
“Niall Ferguson, the conservative English [sic] historian and enthusiastic advocate of a new American empire, has also embraced the Eurabian idea in a widely reproduced article entitled ‘Eurabia?’,”[66]
in which he laments the ‘de-Christianization of Europe’ and its culture of secularism that leaves the continent ‘weak in the face of fanaticism’.” Carr adds that
“Ferguson sees the recent establishment of a department of Islamic studies in his Oxford college as another symptom of ‘the creeping Islamicization of a decadent Christendom”,
“Ferguson struck a similarly Spenglerian note, conjuring the term ‘impire’ to depict a process in which a ‘political entity, instead of expanding outwards towards its periphery, exporting power, implodes – when the energies come from outside into that entity’. In Ferguson’s opinion, this process was already under way in a decadent ‘post-Christian’ Europe that was drifting inexorably towards the dark denouement of a vanquished civilisation and the fatal embrace of Islam.”[68]
Iraq War
Ferguson supported the 2003 Iraq War, and he is on record as not necessarily opposed to future western incursions around the world.
“It’s all very well for us to sit here in the West with our high incomes and cushy lives, and say it’s immoral to violate the sovereignty of another state. But if the effect of that is to bring people in that country economic and political freedom, to raise their standard of living, to increase their life expectancy, then don’t rule it out”.[17]
Economic policy
In its 15 August 2005 edition, The New Republic published “The New New Deal”, an essay by Ferguson and Laurence J. Kotlikoff, a professor of economics at Boston University. The two scholars called for the following changes to the American government’s fiscal and income security policies:
Replacing the old age benefits paid under Social Security with a Personal Security System, consisting of private retirement accounts for all citizens, plus a government benefit payable to those whose savings were insufficient to afford a minimum retirement income
Replacing Medicare and Medicaid with a Medical Security System that would provide health insurance vouchers to all citizens, the value of which would be determined by one’s health
Cutting federal discretionary spending by 20%
In November 2012, Ferguson stated in a video with CNN that the U.S. has enough energy resources to move towards energy independence and could possibly enter a new economic golden age due to the related socio-economic growth—coming out of the post-world economic recession doldrums.[69]
Ferguson was an attendee of the 2012 Bilderberg Group meeting, where he was a speaker on economic policy.[70]
Exchanges with Paul Krugman
In May 2009, Ferguson became involved in a high-profile exchange of views with economist Paul Krugman (2008 Nobel Laureate in Economics) arising out of a panel discussion hosted by PEN/New York Review on 30 April 2009, regarding the U.S. economy. Ferguson contended that the Obama administration’s policies are simultaneously Keynesian and monetarist, in an “incoherent” mix, and specifically claimed that the government’s issuance of a multitude of new bonds would cause an increase in interest rates.[71]
Krugman argued that Ferguson’s view is “resurrecting 75-year old fallacies” and full of “basic errors”. He also stated that Ferguson is a “poseur” who “hasn’t bothered to understand the basics, relying on snide comments and surface cleverness to convey the impression of wisdom. It’s all style, no comprehension of substance.”[72][73][74][75]
In 2012, Jonathan Portes, the director of the National Institute of Economic and Social Research, said that subsequent events had shown Ferguson to be wrong: “As we all know, since then both the US and UK have had deficits running at historically extremely high levels, and long-term interest rates at historic lows: as Krugman has repeatedly pointed out, the (IS-LM) textbook has been spot on.”[76]
Later in 2012, after Ferguson wrote a cover story for Newsweek arguing that Mitt Romney should be elected in the upcoming US presidential election, Krugman wrote that there were multiple errors and misrepresentations in the story, concluding “We’re not talking about ideology or even economic analysis here – just a plain misrepresentation of the facts, with an august publication letting itself be used to misinform readers. The Times would require an abject correction if something like that slipped through. Will Newsweek?”[77] Ferguson denied that he had misrepresented the facts in an online rebuttal.[78]Matthew O’Briencountered that Ferguson was still distorting the meaning of the CBO report being discussed, and that the entire piece could be read as an effort to deceive.[79]
The remarks were widely criticised for being offensive, factually inaccurate, and a distortion of Keynes’ ideas.[83][84]
Ferguson posted an apology for these statements shortly after reports of his words were widely disseminated, saying his comments were “as stupid as they were insensitive”.[85] In the apology, Ferguson stated: “My disagreements with Keynes’s economic philosophy have never had anything to do with his sexual orientation. It is simply false to suggest, as I did, that his approach to economic policy was inspired by any aspect of his personal life.”[86]
Personal life
Ferguson married journalist Susan Douglas, whom he met in 1987 when she was his editor at the Daily Mail. They have three children.[87]
In February 2010, news media reported that Ferguson had separated from Douglas and started dating former Dutch MP Ayaan Hirsi Ali.[88][89][90] Ferguson and Douglas divorced in 2011.
Ferguson married Hirsi Ali in September 2011[91] and Hirsi Ali gave birth to their son in December 2011.[92][93][94]
Ferguson dedicated his book Civilization to “Ayaan”. In an interview with The Guardian, Ferguson spoke about his love for Ali, who, he writes in the preface, “understands better than anyone I know what Western civilisation really means – and what it still has to offer the world”.[17] Ali, he continued,
…grew up in the Muslim world, was born in Somalia, spent time in Saudi Arabia, was a fundamentalist as a teenager. Her journey from the world of her childhood and family to where she is today is an odyssey that’s extremely hard for you or I [sic] to imagine. To see and hear how she understands western philosophy, how she understands the great thinkers of the Enlightenment, of the 19th-century liberal era, is a great privilege, because she sees it with a clarity and freshness of perspective that’s really hard for us to match. So much of liberalism in its classical sense is taken for granted in the west today and even disrespected. We take freedom for granted, and because of this we don’t understand how incredibly vulnerable it is.[17]
Ferguson’s self confessed workaholism has placed strains on his personal relations in the past. Ferguson has commented that:
…from 2002, the combination of making TV programmes and teaching at Harvard took me away from my children too much. You don’t get those years back. You have to ask yourself: “Was it a smart decision to do those things?” I think the success I have enjoyed since then has been bought at a significant price. In hindsight, there would have been a bunch of things that I would have said no to.[12]
Ferguson was the inspiration for Alan Bennett‘s play The History Boys (2004), particularly the character of Irwin, a history teacher who urges his pupils to find a counterintuitive angle, and goes on to become a television historian.[8] Bennett’s character “Irwin” gives the impression that “an entire career can be built on the trick of contrariness.”[8]
Ferguson, Niall (2006). The War of the World: History’s Age of Hatred. London: Allen Lane. ISBN0-7139-9708-7. American ed. has the title: The war of the World: Twentieth-century Conflict and the Descent of the West OCLC70839824 (also a Channel 4 series)[37]
Ferguson, Niall (2003). Empire: The Rise and Demise of the British World Order and the Lessons for Global Power. New York: Basic Books. ISBN0-465-02328-2. American edition.
Ferguson, Niall (2001). The Cash Nexus: Money and Power in the Modern World, 1700–2000. London: Allen Lane. ISBN0-7139-9465-7. OCLC46459770.
Ferguson, Niall (1999) [1997]. Virtual History: Alternatives and Counterfactuals. New York: Basic Books. ISBN0-465-02322-3.
Ferguson, Niall (1998). The House of Rothschild. New York: Viking. ISBN0-670-85768-8.
Ferguson, Niall (1995). Paper and Iron: Hamburg Business and German Politics in the Era of Inflation, 1897–1927. Cambridge, UK: Cambridge University Press. ISBN0-521-47016-1.
As contributor
“Let Germany Keep Its Nerve”, The Spectator, 22 April 1995, pages 21–23[95]
“Europa nervosa”, in Nader Mousavizadeh (ed.), The Black Book of Bosnia (New Republic/Basic Books, 1996), pp. 127–32
“The German inter-war economy: Political choice versus economic determinism” in Mary Fulbrook (ed.), German History since 1800 (Arnold, 1997), pp. 258–278
“The balance of payments question: Versailles and after” in Manfred F. Boemeke, Gerald D. Feldman and Elisabeth Glaser (eds.), The Treaty of Versailles: A Reassessment after 75 Years (Cambridge University Press, 1998), pp. 401–440
“‘The Caucasian Royal Family’: The Rothschilds in national contexts” in R. Liedtke (ed.), ‘Two Nations’: The Historical Experience of British and German Jews in Comparison (J.C.B. Mohr, 1999)
“Academics and the Press”, in Stephen Glover (ed.), Secrets of the Press: Journalists on Journalism (Penguin, 1999), pp. 206–220
“Metternich and the Rothschilds: A reappraisal” in Andrea Hamel and Edward Timms (eds.), Progress and Emancipation in the Age of Metternich: Jews and Modernisation in Austria and Germany, 1815–1848(Edwin Mellen Press, 1999), pp. 295–325
“The European economy, 1815–1914” in T.C.W. Blanning (ed.), The Short Oxford History of Europe: The Nineteenth Century (Oxford University Press, 2000), pp. 78–125
“How (not) to pay for the war: Traditional finance and total war” in Roger Chickering and Stig Förster (eds.), Great War, Total War: Combat and Mobilization on the Western Front (Cambridge University Press, 2000), pp. 409–34
“Introduction” in Frederic Manning, Middle Parts of Fortune (Penguin, 2000), pp. vii–xviii
“Clashing civilizations or mad mullahs: The United States between informal and formal empire” in Strobe Talbott (ed.), The Age of Terror (Basic Books, 2001), pp. 113–41
“Public debt as a post-war problem: The German experience after 1918 in comparative perspective” in Mark Roseman (ed.), Three Post-War Eras in Comparison: Western Europe 1918-1945-1989 (Palgrave-Macmillan, 2002), pp. 99–119
“Das Haus Sachsen-Coburg und die europäische Politik des 19. Jahrhunderts”, in Rainer von Hessen (ed.), Victoria Kaiserin Friedrich (1840–1901): Mission und Schicksal einer englischen Prinzessin in Deutschland (Campus Verlag, 2002), pp. 27–39
“Max Warburg and German politics: The limits of financial power in Wilhelmine Germany”, in Geoff Eley and James Retallack (eds.), Wilhelminism and Its Legacies: German Modernities, Imperialism and the Meaning of Reform, 1890–1930 (Berghahn Books, 2003), pp. 185–201
“Introduction”, The Death of the Past by J. H. Plumb (Palgrave Macmillan, 2003), pp. xxi–xlii
“Globalization in historical perspective: The political dimension”, in Michael D. Bordo, Alan M. Taylor and Jeffrey G. Williamson (eds.), Globalisation in Historical Perspective (National Bureau of Economic Research Conference Report) (University of Chicago Press, 2003)
“Introduction to Tzvetan Todorov” in Nicholas Owen (ed.), Human Rights, Human Wrongs: Oxford Amnesty Lectures (Amnesty International, 2003)
“The City of London and British imperialism: New light on an old question”, in Youssef Cassis and Eric Bussière (eds.), London and Paris as International Financial Centres in the Twentieth Century (Oxford University Press, 2004), pp. 57–77
“A bolt from the blue? The City of London and the outbreak of the First World War”, in Wm. Roger Louis (ed.), Yet More Adventures with Britainnia: Personalities, Politics and Culture in Britain (I.B. Tauris, 2005), pp. 133–145
“The first ‘Eurobonds’: The Rothschilds and the financing of the Holy Alliance, 1818–1822”, in William N. Goetzmann and K. Geert Rouwenhorst (eds.), The Origins of Value: The Financial Innovations that Created Modern Capital Markets (Oxford University Press, 2005), pp. 311–323
“Prisoner taking and prisoner killing in the age of total war”, in George Kassemiris (ed.), The Barbarization of Warfare (New York University Press, 2006), pp. 126–158
“The Second World War as an economic disaster”, in Michael Oliver (ed.), Economic Disasters of the Twentieth Century (Edward Elgar, 2007), pp. 83–132
“The Problem of Conjecture: American Strategy after the Bush Doctrine”, in Melvyn Leffler and Jeff Legro (eds.), To Lead the World: American Strategy After the Bush Doctrine (Oxford University Press, 2008)
In May 2012 the BBC announced Niall Ferguson was to present its annual Reith Lectures – a prestigious series of radio lectures which were first broadcast in 1948. These four lectures, titled The Rule of Law and its Enemies, examine the role man-made institutions have played in the economic and political spheres.[96]
In the first lecture, held at the London School of Economics, titled The Human Hive, Ferguson argues for greater openness from governments, saying they should publish accounts which clearly state all assets and liabilities. Governments, he said, should also follow the lead of business and adopt the Generally Accepted Accounting Principlesand, above all, generational accounts should be prepared on a regular basis to make absolutely clear the inter-generational implications of current fiscal policy. In the lecture, Ferguson says young voters should be more supportive of government austerity measures if they do not wish to pay further down the line for the profligacy of the baby boomergeneration.[97]
In the second lecture, The Darwinian Economy, Ferguson reflects on the causes of the global financial crisis, and erroneous conclusions that many people have drawn from it about the role of regulation, such as whether it is in fact “the disease of which it purports to be the cure”.
The Landscape of Law was the third lecture, delivered at Gresham College. It examines the rule of law in comparative terms, asking how far the common law‘s claims to superiority over other systems are credible, and whether we are living through a time of ‘creeping legal degeneration’ in the English-speaking world.
The fourth and final lecture, Civil and Uncivil Societies, focuses on institutions (outside the political, economic and legal realms) designed to preserve and transmit particular knowledge and values. It asks whether the modern state is quietly killing civil society in the Western world, and what non-Western societies can do to build a vibrant civil society.
The first lecture was broadcast on BBC Radio 4 and the BBC World Service on Tuesday, 19 June 2012.[98] The series is available as a BBC podcast.[99]
Jump up^Malcolm, Noel (13 March 2011). “Civilisation: The West and the Rest by Niall Ferguson: review”. The Daily Telegraph. The patient testing of evidence must give way to startling statistics, gripping anecdotes and snappy phrase-making. Niall Ferguson is never unintelligent and certainly never dull. Students may find this an intriguing introduction to a wide range of human history; but they will get an odd idea of how historical argument is to be conducted, if they learn it from this book
Story 1: American People Do Not Trust Big Government Democratic and Republican Parties and The Political Elitist Establishment In Washington — New Political Party Formed When Independents Represent 50% or More of Voters — When? 2022 or 2024 — Fiscal Responsibility, Limited Constitutional Government, Consumption Tax Replacing All Federal Taxes, and Stopping All Legal and Illegal Immigration Exceeding 1 Million Persons Per Year, Replacing The Warfare and Welfare State With A Peace and Prosperity Economy — Jobs For Everyone — I Have A Dream — The Winner Takes It All — Part 1 — Videos
ABBA – I Have A Dream (From The Late Late Breakfast Show, England 1982)
U.S. partisanship shifts to net-Republican after midterms
GOP also made gains after 1994 and 2002 midterms
Democrats made gains following 2006 midterms
PRINCETON, N.J. — Since the Republican Party’s strong showing on Election Day last month, Americans’ political allegiances have shifted toward the GOP. Prior to the elections, 43% of Americans identified as Democrats or leaned toward the Democratic Party, while 39% identified as or leaned Republican. Since then, Republicans have opened up a slight advantage, 42% to 41%, representing a net shift of five percentage points in the partisanship gap.
The pre-election results are based on Gallup Daily tracking interviews with 17,259 U.S. adults, conducted between Oct. 1 and Nov. 4. The post-election interviews are based on 12,671 interviews conducted Nov. 5-30.
There have been similar “bandwagon” effects for the winning party in the past, including after the 1994 and 2002 midterm elections, when Republicans benefited, and after the 2006 election, when Democrats made gains.
The most dramatic shift occurred after the 1994 midterms, in which Republicans picked up more than 50 seats in the House of Representatives to gain a majority in that chamber for the first time in 40 years. Before the 1994 elections, Democrats enjoyed a four-point advantage in party affiliation, but after the GOP wave, Republicans emerged with a 12-point margin, for a total shift of 16 points in the gap.
In 2002, Republicans capitalized on the popularity of George W. Bush to accomplish the rare feat of having the president’s party gain seats in Congress in a midterm election. After that strong showing, partisanship moved from a five-point Democratic edge to a four-point Republican margin.
Four years later, with Bush’s job approval rating stuck below 40%, Democrats gained control of both houses of Congress. An already strong Democratic partisanship advantage of 14 points swelled to 22 points after the election.
Not every “wave” election has produced a distinct shift in a party’s advantage. The 1998 and 2010 midterms were also notable for their outcomes, but did not produce any apparent change in Americans’ basic party loyalties. In 1998, Democrats gained seats in the House even with a Democratic president in office. In 2010, Republicans gained a net of 63 seats in the House to win back control of that chamber. That year, the shifts in party allegiances seemed to be in place before the election, with the smallest Democratic edge seen in any recent midterm year. Consequently, in 2010 it appeared that shifts in party allegiances drove the election results, whereas in other years the election results seemed to produce shifts in party affiliation after the election.
The bandwagon effect can largely be explained by the amount of positive publicity given to the victorious party after its success. However, it is unclear why there would be a bandwagon effect following most midterm elections but not all of them.
No Clear Historical Pattern on How Long Post-Midterm Party Gains Last
One key question is how long the effects persist when they do occur. A review of the three elections with obvious bandwagon effects reveals no consistent pattern.
The 1994 Republican surge in partisanship was the largest and the longest lasting. Republicans maintained a healthy eight-point advantage in partisanship through December 1994, and an average four-point advantage from January through March 1995. By April, Democrats had regained a slight edge, and for the most part held it throughout the remainder of the year.
The 2002 Republican gains were fairly short-lived, evident in November and December and largely gone by January 2003. However, when the Iraq War commenced in March, Republicans saw another surge in partisanship.
The 2006 Democratic gains were the most brief, disappearing by December — though that still left the party with a healthy 12-point edge in partisanship.
Implications
The 2014 midterms were an unqualified success for the Republican Party. The GOP took control of the Senate and expanded its majority in the House, giving Republicans control of both houses of Congress for the first time since 2006. And that success has caused Americans to view the Republican Party more favorably than the Democratic Party, as well as to say congressional Republicans should have more influence than President Barack Obama over the direction the nation takes in the next year. Americans are also now more likely to align themselves politically with the Republican Party than the Democratic Party.
It is not clear how long these good feelings toward the GOP will last. That could be influenced by what Republicans do with their enhanced power. While they are unlikely to achieve many of their major policy objectives with a Democratic president in office, how they and the president navigate the key issues facing the nation over the next two years will go a long way toward determining where each party stands heading into the 2016 presidential election.
Survey Methods
Results for this Gallup poll are based on telephone interviews conducted Nov. 5-30, 2014, on the Gallup U.S. Daily survey, with a random sample of 12,671 adults, aged 18 and older, living in all 50 U.S. states and the District of Columbia. For results based on the total sample of national adults, the margin of sampling error is ±1 percentage point at the 95% confidence level.
Each sample of national adults includes a minimum quota of 50% cellphone respondents and 50% landline respondents, with additional minimum quotas by time zone within region. Landline and cellular telephone numbers are selected using random-digit-dial methods.
Obama job approval among whites aged 18 to 29 is down to 34%
White millennials’ approval only 3 points above older whites’
Obama approval remains much higher among nonwhite 18-29s
PRINCETON, N.J. — President Barack Obama’s job approval rating in 2014 among white 18- to 29-year-olds is 34%, three points higher than among whites aged 30 and older. This is the narrowest approval gap between the president’s previously strong support base of white millennials and older white Americans since Obama took office.
By contrast, the president’s approval rating was nine percentage points higher among younger whites in 2009, and 10 points higher in 2010. Additionally, while the president’s approval among younger whites matched his overall national rating in his first two years in office, it is now eight points below the national average. These data underscore the gradual erosion of the disproportionately strong support Obama received from young white voters as he took office in 2009 and ran for re-election in 2012.
The data are based on yearly averages from Gallup’s Daily tracking, including 2014 data through November.
Obama’s support among white millennials has factored into his two presidential election successes. Exit polls conducted after the 2012 election, for example, showed that Obama received 44% of the vote of white 18- to 29-year-olds, about six points higher than he received among whites aged 30 and older. Obama’s 45% job approval rating among 18- to 29-year-old whites in 2012 mirrored these voting results closely. But the president’s 11-point drop among white 18- to 29-year-olds since 2012 is almost double the six-point drop among the national population and among older whites.
Younger Whites’ Approval Now Closer to All Other Age Groups
From a broader perspective, there is relatively little difference today in Obama’s job approval ratings among whites in any of the four major age groups. Whites aged 30 to 49, as well as those 65 and older, have given Obama a 31% approval rating so far in 2014, with 50- to 64-year-olds coming in at 32% and 18- to 29-year-olds at 34%. The spread among age categories was slightly larger in the earliest years of the Obama administration.
Support Down, but Still Higher Among Nonwhite Than Among White Young People
Although Obama’s approval rating has dropped among black, Hispanic and Asian 18- to 29-year-olds from 2009 to 2014, just as it has among white millennials, the president maintains a much higher level of support among these groups than among whites. Specifically, Obama’s approval is 80% among young blacks, 68% among young Asians, and 55% among Hispanic 18- to 29-year-olds — contrasted with his 34% approval among white young adults.
Age affects Obama’s approval ratings differently among each of these racial and ethnic groups. Obama does slightly less well among black young people than among older blacks, and significantly better among Asians younger than 50 than among those who are older. There is little significant difference in his approval rating by age within the Hispanic population.
Implications
While Obama is significantly more popular among nonwhites than among whites, he was able to count on proportionately stronger support from young whites than older whites in his 2008 and 2012 presidential election campaigns. Now, his support among white millennials appears to be waning, and these young Americans give Obama an approval rating that is only marginally higher than that among older whites.
These findings demonstrate the general importance of race and ethnicity when one talks about Obama’s job approval ratings by age. Obama continues to enjoy higher approval ratings among all 18- to 29-year-olds — regardless of race or ethnicity — than he does among the general population, but this is largely attributable to younger age groups in the U.S. being disproportionately composed of nonwhites. In other words, a big part of the age gap in Obama’s approval ratings today is attributable not so much to differences in approval within racial or ethnic groups, but to the fact that the white population in the U.S. skews older, while the nonwhite population skews younger.
The white vote has become an increasing challenge for Democratic presidential candidates in recent years, as well as Senate candidates in many Southern and swing states. Just this past weekend, a lack of strong support among white voters was instrumental in incumbent Democratic Sen. Mary Landrieu’s loss in Louisiana’s senatorial runoff election. That loss gives the Republicans control of every southern Senate seat from Texas to the Carolinas. While Democrats are likely to be helped in coming years by a growing Hispanic population, Democratic presidential candidates — and senatorial candidates in many states — will continue to need the votes of a substantial minority of white voters in order to put together a winning coalition. Thus, Obama’s continuing loss of support among younger white voters highlights one of the potential challenges ahead for Democratic candidates in 2016.
Survey Methods
Results for this Gallup poll are based on telephone interviews conducted on the Gallup U.S. Daily survey from 2009 through November 2014, with random samples of approximately 355,000 adults, aged 18 and older, living in all 50 U.S. states and the District of Columbia for each of the 2009-2012 yearly samples; approximately 175,000 adults for 2013; and 163,847 adults for Jan. 2-Nov. 30, 2014. For results based on the total sample of national adults in each yearly average, the margin of sampling error is ±1 percentage point at the 95% confidence level. The margin of sampling error for each year’s age subgroups varies by sample size.
Each sample of national adults includes a minimum quota of 50% cellphone respondents and 50% landline respondents, with additional minimum quotas by time zone within region. Landline and cellular telephone numbers are selected using random-digit-dial methods.
Bar Chart Data Source: Monthly Treasury Statement (MTS) published by the U. S. Treasury Department. WE DON’T MAKE THIS UP! IT COMES FROM THE U. S. GOVERNMENT! NO ADJUSTMENTS.
The MTS published in October, reports the final actual expenditures for the previous FY. This chart shows FY2014 actual spending data. Here is the link to download your own copy from the Treasury Department web site.
The chart normally shows the proposed budget line for the next fiscal year (FY2015 started 1 October 2014), but Congress has not passed a “budget” for FY2015; we’re still using continuing resolutions to fund the federal government.
The Congressional Budget Office reported on the Federal Debt and the Risk of a Financial Crisis in this report on the non-budget.
NDAC Challenge: Look at the bar chart to find items that are growing and items that are being reduced. Example: One of the largest growth departments is at the Department of Agriculture; it handles Food Stamps (SNAP). You pay taxes, your money is paying for food stamps.
NDAC studies the Budget Proposals submitted to the U.S. Senate each year by the President of the United States and by the House of Representatives. The budget submissions include Budget Historical Tables published by OMB. Expenditures are shown in Table 4.1, scroll way right to find current years actuals and estimates. Our analysis is discussed on the home page of this web site.
— “Deficit” vs. “Debt”—
Suppose you spend more money this month than your income. This situation is called a “budget deficit”. So you borrow (ie; use your credit card). The amount you borrowed (and now owe) is called your debt. You have to pay interest on your debt. If next month you spend more than your income, another deficit, you must borrow some more, and you’ll still have to pay the interest on your debt (now larger). If you have a deficit every month, you keep borrowing and your debt grows. Soon the interest payment on your loan is bigger than any other item in your budget. Eventually, all you can do is pay the interest payment, and you don’t have any money left over for anything else. This situation is known as bankruptcy.
“Reducing the deficit” is a meaningless soundbite. If theDEFICIT is any amount more than ZERO, we have to borrow more and the DEBT grows.
Each year since 1969, Congress has spent more money than its income. The Treasury Department has to borrow money to meet Congress’s appropriations. Here is a direct link to the Congressional Budget Office web site’s deficit analysis. We have to pay interest* on that huge, growing debt; and it dramatically cuts into our budget.
Cut spending??? What would you cut?
[All federal expenses are shown on the chart above].
And there is a lot of missing money! Where is it?
The Treasury Department has the third largest expense in the federal budget. Only Defense andentitlement programs (run by Departments of Health and Human Services, HUD, and Agriculture (food stamps)) spend more. As the debt increases, so does the interest payment. Entitlement spending is the largest item in our federal budget. Do you have “Compassion” for lower income earners?
In FY2013 the U. S. Treasury Department spent$416 Billion of your money on interest payments to the holders of the National Debt.
Compare that to NASA at $17B,
Agriculture at $156B,
Labor at $80B,
Transportation at $76B!Can the federal budget be balanced? Here’s a video about that.
When you buy something, all the companies involved in producing and delivering it, were charged a wide range of taxes, and those costs are part of the price ofeverything you buy. The price of everything you buy will go up to cover any business tax increases.You are paying those corporate taxes! Read more about the proposed Energy Tax increases. So don’t forget that the price of fuel is in the cost of everything.
The “Economic Stimulus” is shifting us from an “economic crisis” to a debt crisis!Consider this; if businesses could print their own money and give it away to customers so they could buy the products, many folks would be happy for a while; but the businesses would go bankrupt. Well, that’s what our government is currently doing, printing and giving away money.
It has been reported that about 50% of Americans pay no income tax. But, if those folks buy anything, they pay “embedded taxes”*. Here is a video about taxation.
*[About 22% of the price of any product you buy is because of taxation on the companies that were involved in that product being produced and being at a place where it could be bought; and that’s before local sales taxes were added.] Every company must cover ALL its costs (including taxation) in the price of its product; or it will go bankrupt.
Healthcare… some proponents want to pay for the new plan by taxing insurance companies.Insurance companies do not pay taxes. To a corporation, tax is just another cost. So policy premiums will go up to cover the cost.
Government Programs always cost more than originally predicted. What about Healthcare?
**The Government cannot provide anything to anyone without first taking money from someone else to pay for it.
NOTABLE QUOTES
“For society as a whole, nothing comes as a ‘right’ to which we are ‘entitled’. Even bare subsistence has to be produced…. The only way anyone can have a right to something that has to be produced is to force someone else to produce it… The more things are provided as rights, the less the recipients have to work and the more the providers have to carry the load.” Thomas Sowell, quoted in Forbes and Reader’s Digest.
According to Mr. Kneeland, “…all dollars come from the people. Where do [you] think Coca-Cola gets the money to pay its taxes, Exxon gets its money to pay the Exxon Valdez fines, Denny’s gets the money to pay its Justice Department fines, or even Microsoft gets the money to defend itself? It all ultimately can come from only one place, and that’s from individuals.” ED: When you buy a product, the price of that product has to cover ALL the costs to get that product to you.
“A politician cannot spend one dime on any spending project without first taking that dime from the person who earned it. So, when a politician votes for a spending bill he is saying that he believes the government should spend that particular dollar rather than the individual who worked for it.” Neal Boortz.
“There is no such thing as government money – only taxpayer money.” William Weld, quoted in Readers Digest.
“Who will provide the roof to protect you from the rain, the heat to comfort you from the cold, and the coffee to fill your stomach when the damn, greedy capitalists are all gone?” – David Berresford, Thursday, May 20, 2010, Canada Free Press.
SOCIAL SECURITYis not part of the Federal Budget (General Fund). It is a separate account from the General Fund, and has its own source of income (“Payroll Tax”). Social Security payments go in the Social Security Trust Fund (SSTF), and should NOT be counted as general revenue. The SSTF is supposed to be used to pay benefits. But, the Government is under NO OBLIGATION to pay Social Security benefits, and has even borrowed substantially fromtheSSTF for general operations!As of August 2010, there is less being paid into the Social Security Trust Fund than is being paid out to beneficiaries. Social Security is now using its “surplus”.Other Government agencies borrowed from that trust fund, and now have to pay it back. But they already spent it! So how will they pay it back? Through bailouts and taxes. Here is a “must read” about the problem. Your payroll taxes are going into a bottomless hole!The Social Security Administration’s FAQ page about the Trust Fund, and their latestReport (May 2011) explain it well.Beware the term “Social Security Surplus”; there is no such thing. Social Security is aPonzi Scheme, there is never more in the Trust Fund than will ever be needed.
The Government does not have any money, it does nothing to earn money (maybe defense). Government takes money from you and borrows more (from your children), then spends that! The bailouts of 2008 and 2009 are purely deficit spending. Expect to see enormous deficits in the forseeable future, leading to much more debt.Interest payments on that growing debt will become the largest item in the federal budget. On C-SPAN, President Obama boldly told Americans: “We are out of money.”
In 1913, when the Federal Reserve was created with the duty of preserving the dollar, one 20-dollar bill could buy one 20-dollar gold piece. Today, fifty 20-dollar bills are needed to buy one 20-dollar gold piece. Under the Fed’s custody, the U.S. dollar has lost 98 percent of its value. The dollar is the storehouse of our wealth. Has the Fed faithfully safeguarded that storehouse? Thomas Jefferson said, “In questions of power let us hear no more of trust in men, but bind them down from mischief with the chains of the Constitution.”
A perfect storm of historic dysfunction combined with a lame-duck Congress, a looming power change in the Senate, a budget deadline, the holidays and the countdown to the 2016 elections has not prodded lawmakers to make compromises or to do their basic budgetary work. It has, however, led to a brand-new Washington term. Enter the “cromnibus.”
That’s the name being assigned to a tortured GOP strategy to stick it to President Barack Obama and make a bold statement on immigration and border security – all while avoiding shutting down the federal government right before the holidays, a tactic that didn’t work out so well for the GOP when it happened last year.
Described as a trial balloon, the approach was floated by House Speaker John Boehner at the party’s Tuesday morning meeting last week. The GOP plan goes like this: Congress would pass an omnibus funding bill to keep almost the entire government running into September 2015. However, the Department of Homeland Security – the department that deals with the implementation of Obama’s executive action on immigration, which the Republicans hate – would limp along on a mere continuing resolution that would fund it until sometime next March. That would give Republicans time and opportunity to pressure the Obama administration into backing off its executive action somehow – or at least isolate the DHS budget so Republicans, who next year will control both the House and Senate, could deny the funds needed to implement the action. Meanwhile, House members were given a chance, before recessing for the year, to take what is widely regarded as a show vote to undo the executive action.
This way, lawmakers explained, House Republicans can vent about border security, Obama and the use of an executive action to grant temporary legal status to more than 4 million people in the country illegally, all without suffering the political consequences of another government shutdown.
Boehner acknowledged that there’s no easy way for congressional Republicans to undo Obama’s executive action; rank-and-file members have thrown around ideas ranging from refusing to provide funds to implement the action to a lawsuit or impeachment.
Each has its logistical and political complications: Refusing to fund Homeland Security could make Republicans look like they don’t care about the safety of the nation’s citizens; a lawsuit (even if the House is deemed to have standing to sue) could cause a political backlash; and impeachment could lead to a repeat of 1998, when a similar action against former President Bill Clinton backfired against the GOP.
In countering Obama on immigration, the GOP has to weigh the interests of the Hispanic community against the ideals of the party’s base.
And Republicans must be mindful of two important constituencies in 2016 – the GOP base, which wants the action undone and might reject a presidential primary candidate who won’t commit to doing so, and the Hispanic community, which might align itself even more firmly against Republicans if the GOP commits to a policy that would break up families living here with temporary legal status.
“We’re looking at a variety of options, both for right now and when Republicans control both houses of the Congress next year,” Boehner, R-Ohio, told reporters. “Frankly, we have limited options and limited abilities to deal with it directly.”
Thus, GOP strategists have proposed the “cromnibus,” a compromise that would keep nearly all agencies and programs humming along until next September (since Congress has been unable to pass any of the appropriations bills that make up the federal budget) and avoid a government shutdown that would occur if nothing is done before the current continuing resolution expires Dec. 11.
Meanwhile, Homeland Security would be put on a short budgetary leash until March. By that point, Republicans reason, they will be running both chambers of Congress and will be able to pass legislation excising funding for the part of the department that deals with the new executive action, killing it by starvation.
“The most effective thing we can do is to limit spending,” says Rep. John Fleming, R-La. While Fleming says Obama is assuming excessive powers as the nation’s chief executive, “we’ve got our own power – the power of the purse,” he adds.
But Fleming, like some other House conservatives, is irked by the idea that the House should wait until next year to go full-force against the immigration action – meaning Boehner may need House Democrats to get such a plan approved.
“I don’t think anybody wants a shutdown,” says Rep. Matt Salmon, R-Ariz. But “I think we have significant leverage.”
The simmering rebellion by House conservatives means Boehner is likely to continue to face the same internal divisions he’s had since 2011, when a wave of new tea party-aligned lawmakers gave the GOP the House majority and demanded a rightward turn in the way the party ran things. That pressure largely drove the 16-day government shutdown in October 2013 – a development polls showed Americans blamed on Republicans. So would the public also blame the GOP if Homeland Security does not get the cash it needs to keep Americans safe?
“Republicans are blamed for everything, anyway – what difference does it make?” Fleming says.
However, Senate Democrats are determined not to end their reign with a shutdown, even if the GOP gets blamed for it. Getting almost all of the government funded until next fall would be “a big accomplishment,” Senate Majority Leader Harry Reid, D-Nev., told reporters.
Moreover, the GOP needs to worry about overreach, Democrats say. Any specific effort to undo the executive action is likely to be vetoed by Obama. That leaves Republicans in the same position as they were with the Affordable Care Act. They could hold a series of votes opposing it or defunding it, but none would get signed into law. And the difference with immigration, notes Rep. Elijah Cummings, D-Md., is that the substance of the order (as opposed to the process) is indeed popular with the public, in a way Obamacare is not.
“You’re talking about changing the trajectory of a family’s destiny for generations – that’s deep,” Cummings says.
Opposing Obama’s order as executive overreach might excite the GOP base, but Hispanic families are equally excited about the opportunity to stay intact in the U.S., he adds. For Boehner, the challenge may be keeping his Republican family united.
Urgent Issue Of Immigration & The Budget – Special Report 1st Segment
Americans: In Obama we don’t trust
President’s Unilateral Action on Immigration Undermines Americans’ Trust
***AMERICANS DONT TRUST THE GOVERNMENT *** there criminals.
Top 10 Government Lies – When said ‘Trust Us’
Krauthammer on Obama: American “People Think This Is Failed Presidency”
Why Shouldn’t I Work for the NSA? (Good Will Hunting)
U.S. Drones kill more people than ISIS: Chris Hedges
Chris Hedges, author, Pulitzer-prize winning journalist and polemicist discusses the importance of resistance to empire, and passionately condemns US foreign policy, saying “There is no difference between a beheading by ISIL and a US drone strike.”
Chris Hedges: The Absurdity of American Empire [FULL INTERVIEW]
Chris Hedges Call to Action to create “New Movements” replacing corrupt Government
George Carlin on American Foreign Policy – Bombing Brown People
The Best of George Carlin: Exposing our government and fall of humanity one joke at a time
The Pursuit Of Happyness – Job Interview
Best scene pursuit of happyness, Will Smith at his best
Story 1: Asset Price Bubble Bursts Coming In October With 69 Months of Near Zero Federal Funds Interest Rates! — Interest Rate Suppression or Price Control and Manipulation Will Blow Up Economy — Suppressing Savings and Investment With Low Interest Rates Is A Formula For Diaster and Depression — Panic Time — Start A War Over Oil — Meltdown America –Videos
TABLE I -- SUMMARY OF TREASURY SECURITIES OUTSTANDING, AUGUST 31, 2014
(Millions of dollars)
                                              Amount Outstanding
Title                                         Debt Held             Intragovernmental         Totals
                                              By the Public         Holdings
Marketable:
  Bills.......................................        1,450,293                     1,704                1,451,998
  Notes.......................................        8,109,269                     7,365                8,116,634
  Bonds.......................................        1,521,088                        57                1,521,144
  Treasury Inflation-Protected Securities.....        1,031,836                        52                1,031,888
  Floating Rate Notes  21  ...................          109,996                         0                  109,996
  Federal Financing Bank  1  .................                0                    13,612                   13,612
Total Marketable  a...........................       12,222,481                    22,790 2             12,245,271
Nonmarketable:
  Domestic Series.............................           29,995                         0                   29,995
  Foreign Series..............................            2,986                         0                    2,986
  State and Local Government Series...........          105,440                         0                  105,440
  United States Savings Securities............          177,030                         0                  177,030
  Government Account Series...................          193,237                 4,993,277                5,186,514
  Hope Bonds 19...............................                0                       494                      494
  Other.......................................            1,443                         0                    1,443
Total Nonmarketable  b........................          510,130                 4,993,771                5,503,901
Total Public Debt Outstanding ................       12,732,612                 5,016,561               17,749,172
TABLE II -- STATUTORY DEBT LIMIT, AUGUST 31, 2014
(Millions of dollars)
                                              Amount Outstanding
Title                                         Debt Held             Intragovernmental         Totals
                                                 By the Public 17, 2Holdings
Debt Subject to Limit: 17, 20
  Total Public Debt Outstanding...............       12,732,612                 5,016,561               17,749,172
  Less Debt Not Subject to Limit:
    Other Debt ...............................              485                         0                      485
    Unamortized Discount  3...................           15,742                    12,421                   28,163
    Federal Financing Bank  1     ............                0                    13,612                   13,612
    Hope Bonds 19.............................                0                       494                      494
  Plus Other Debt Subject to Limit:
    Guaranteed Debt of Government Agencies  4                 *                         0                        *
  Total Public Debt Subject to Limit .........       12,716,386                 4,990,033               17,706,419
  Statutory Debt Limit  5.....................................................................                   0
COMPILED AND PUBLISHED BY
THE BUREAU OF THE FISCAL SERVICE
www.TreasuryDirect.gov
Interest Expense on the Debt Outstanding
The Interest Expense on the Debt Outstanding includes the monthly interest for:
Amortized discount or premium on bills, notes and bonds is also included in the monthly interest expense.
The fiscal year represents the total interest expense on the Debt Outstanding for a given fiscal year. This includes the months of October through September. View current month details (XLS Format, File size 199KB, uploaded 09/05/2014).
Note: To read or print a PDF document, you need the Adobe Acrobat Reader (v5.0 or higher) software installed on your computer. You can download the Adobe Acrobat Reader from the Adobe Website.
Even after the Dow and the S&P 500 closed at new all-time highs, closely followed contrarian Marc Faber keeps sounding the alarm.
“We have a bubble in everything, everywhere,” the publisher of The Gloom, Boom & Doom Report told CNBC’s “Squawk Box” on Friday. Faber has long argued that the Federal Reserve’s massive asset purchasing programs and near-zero interest rates have inflated stock prices.
The catalyst for a market decline, as he sees it, could be a “raise in interest rates, not engineered by the Fed,” referring an increase in bond yields.
Faber also expressed concern about American consumers. “Their cost of living have gone up more than the salary increases, so they’re getting squeezed. So that’s why retailing is not doing particularly well.”
A real black swan event, he argued, would be a global recession. “The big surprise will be that the global economy slows down and goes into recession. And that will shock markets.”
If economies around the world can’t recovery with the Fed and other central banks pumping easy money into the system, that would send a dire message, Faber added. He believes the best way for world economies to recover is to cut the size of government.
There’s a dual-economy in the U.S. and around the world with the rich doing really well and others struggling, he said. “[But] the rich will get creamed one day, especially in Europe, on wealth taxes.”
The Wharton School professor sees second half economic growth of 3 to 4 percent, S&P 500 earnings near $120, and the start of Fed rate hikes in the spring or summer of 2015
Fed and TWTR Overvaluation, Evidence of Looming Market Crash: Stockman
The Federal Reserve Wednesday reassured investors that it will hold interest rates near zero for a “considerable time” after it ends the bond-buying program known as quantitative easing in October. In response, the Dow Jones Industrial Average (^DJI) closed at a new record high.
Former Director of the Office of Management and Budget and author of the book, The Great Deformation, David Stockman, has significant concerns about that very policy.
“I’m worried… that we’ve got the greatest bubble created by a central bank in human history,” he told Yahoo Finance.
In a recent blog post, Stockman offered a handful of high-flying stocks as evidence of what he sees as “madness.”
“…Twitter, is all that is required to remind us that once
again markets are trading in the nosebleed section
of history, rivaling even the madness of March 2000.”
Behind the madness
In an interview with Yahoo Finance, Stockman blamed Fed policy for creating that madness.
“We have been shoving zero-cost money into the financial markets for 6-years running,” he said. “That’s the kerosene that drives speculative trading – the carry trades. That’s what the gamblers use to fund their position as they move from one momentum play and trade to another.”
And that, he says, is not sustainable. While Stockman believes tech stocks are especially overvalued, he warns that it’s not just tech valuations that are inflated. “Everything’s massively overvalued, and it’s predicated on zero-cost overnight money that continues these carry trades; It can’t continue.”
And he still believes, as he has for some time – so far, incorrectly – that there will be a day of reckoning.
“When the trades begin to unwind because the carry cost has to normalize, you’re going to have a dramatic re-pricing dislocation in these financial markets.”
As Yahoo Finance’s Lauren Lyster points out in the associated video, investors who heeded Stockman’s advice last year would have missed out on a 28% run-up in stocks. But Stockman remains steadfast in his belief that the current Fed policy and the resultant market behavior can not continue. “I think what the Fed is doing is so unprecedented, what is happening in the markets is so unnatural,” he said. “This is dangerous, combustible stuff, and I don’t know when the explosion occurs – when the collapse suddenly is upon us – but when it happens, people will be happy that they got out of the way if they did.”
Factors Affecting Reserve Balances of Depository Institutions and Condition Statement of Federal Reserve Banks
September 11, 2014
1. Factors Affecting Reserve Balances of Depository Institutions
Millions of dollars
Reserve Bank credit, related items, and
reserve balances of depository institutions at
Federal Reserve Banks
Averages of daily figures
Wednesday
Sep 10, 2014
Week ended
Sep 10, 2014
Change from week ended
Sep 3, 2014
Sep 11, 2013
Reserve Bank credit
4,377,690
+ 4,183
+ 761,693
4,379,719
Securities held outright1
4,159,537
+ 2,675
+ 765,361
4,160,521
U.S. Treasury securities
2,439,657
+ 2,671
+ 401,376
2,440,637
Bills2
0
0
0
0
Notes and bonds, nominal2
2,325,368
+ 2,678
+ 386,333
2,326,351
Notes and bonds, inflation-indexed2
97,755
0
+ 11,737
97,755
Inflation compensation3
16,534
– 7
+ 3,306
16,531
Federal agency debt securities2
41,562
0
– 22,868
41,562
Mortgage-backed securities4
1,678,317
+ 4
+ 386,851
1,678,322
Unamortized premiums on securities held outright5
208,963
– 219
+ 5,815
208,907
Unamortized discounts on securities held outright5
-18,664
+ 21
– 12,958
-18,654
Repurchase agreements6
0
0
0
0
Loans
291
– 8
+ 18
352
Primary credit
10
– 18
– 8
53
Secondary credit
0
0
0
0
Seasonal credit
247
+ 9
+ 94
266
Term Asset-Backed Securities Loan Facility7
34
0
– 68
34
Other credit extensions
0
0
0
0
Net portfolio holdings of Maiden Lane LLC8
1,664
– 1
+ 171
1,665
Net portfolio holdings of Maiden Lane II LLC9
63
0
– 1
63
Net portfolio holdings of Maiden Lane III LLC10
22
0
0
22
Net portfolio holdings of TALF LLC11
44
0
– 80
44
Float
-675
– 69
+ 94
-627
Central bank liquidity swaps12
77
+ 1
– 243
77
Other Federal Reserve assets13
26,369
+ 1,784
+ 3,517
27,349
Foreign currency denominated assets14
22,933
– 353
– 737
22,801
Gold stock
11,041
0
0
11,041
Special drawing rights certificate account
5,200
0
0
5,200
Treasury currency outstanding15
46,103
+ 14
+ 820
46,103
Total factors supplying reserve funds
4,462,967
+ 3,844
+ 761,776
4,464,863
Note: Components may not sum to totals because of rounding. Footnotes appear at the end of the table.
1. Factors Affecting Reserve Balances of Depository Institutions (continued)
Millions of dollars
Reserve Bank credit, related items, and
reserve balances of depository institutions at
Federal Reserve Banks
Averages of daily figures
Wednesday
Sep 10, 2014
Week ended
Sep 10, 2014
Change from week ended
Sep 3, 2014
Sep 11, 2013
Currency in circulation15
1,292,467
– 442
+ 84,956
1,291,993
Reverse repurchase agreements16
266,584
+ 818
+ 173,996
267,602
Foreign official and international accounts
102,228
– 296
+ 9,640
107,303
Others
164,356
+ 1,115
+ 164,356
160,299
Treasury cash holdings
165
+ 4
+ 23
164
Deposits with F.R. Banks, other than reserve balances
52,715
– 6,170
– 19,233
53,117
Term deposits held by depository institutions
0
0
0
0
U.S. Treasury, General Account
39,081
– 3,787
+ 530
31,872
Foreign official
5,432
– 1,134
– 3,562
5,241
Other17
8,202
– 1,248
– 16,201
16,004
Other liabilities and capital18
63,991
– 1
+ 818
63,033
Total factors, other than reserve balances,
absorbing reserve funds
1,675,922
– 5,792
+ 240,561
1,675,910
Reserve balances with Federal Reserve Banks
2,787,045
+ 9,636
+ 521,214
2,788,954
Note: Components may not sum to totals because of rounding.
1.
Includes securities lent to dealers under the overnight securities lending facility; refer to table 1A.
2.
Face value of the securities.
3.
Compensation that adjusts for the effect of inflation on the original face value of inflation-indexed securities.
4.
Guaranteed by Fannie Mae, Freddie Mac, and Ginnie Mae. The current face value shown is the remaining principal balance of
the securities.
5.
Reflects the premium or discount, which is the difference between the purchase price and the face value of the securities that has not been amortized. For U.S. Treasury and Federal agency debt securities, amortization is on a straight-line basis. For mortgage-backed securities, amortization is on an effective-interest basis.
6.
Cash value of agreements.
7.
Includes credit extended by the Federal Reserve Bank of New York to eligible borrowers through the Term Asset-Backed Securities Loan Facility.
8.
Refer to table 4 and the note on consolidation accompanying table 9.
9.
Refer to table 5 and the note on consolidation accompanying table 9.
10.
Refer to table 6 and the note on consolidation accompanying table 9.
11.
Refer to table 7 and the note on consolidation accompanying table 9.
12.
Dollar value of foreign currency held under these agreements valued at the exchange rate to be used when the foreign currency is returned
to the foreign central bank. This exchange rate equals the market exchange rate used when the foreign currency was acquired from the
foreign central bank.
13.
Includes accrued interest, which represents the daily accumulation of interest earned, and other accounts receivable. Also, includes Reserve Bank premises and equipment net of allowances for depreciation.
14.
Revalued daily at current foreign currency exchange rates.
15.
Estimated.
16.
Cash value of agreements, which are collateralized by U.S. Treasury securities, federal agency debt securities, and mortgage-backed securities.
17.
Includes deposits held at the Reserve Banks by international and multilateral organizations, government-sponsored enterprises, and designated financial market utilities.
18.
Includes the liabilities of Maiden Lane LLC, Maiden Lane II LLC, Maiden Lane III LLC, and TALF LLC to entities other than the Federal Reserve Bank of New York, including liabilities that have recourse only to the portfolio holdings of these LLCs. Refer to table 4 through table 7 and the note on consolidation accompanying table 9. Also includes the liability for interest on Federal Reserve notes due to U.S. Treasury. Refer to table 8 and table 9.
Sources: Federal Reserve Banks and the U.S. Department of the Treasury.
1A. Memorandum Items
Millions of dollars
Memorandum item
Averages of daily figures
Wednesday
Sep 10, 2014
Week ended
Sep 10, 2014
Change from week ended
Sep 3, 2014
Sep 11, 2013
Securities held in custody for foreign official and international accounts
3,338,309
– 417
+ 61,832
3,343,937
Marketable U.S. Treasury securities1
3,010,563
– 456
+ 86,414
3,016,027
Federal agency debt and mortgage-backed securities2
285,805
+ 28
– 29,008
285,934
Other securities3
41,942
+ 12
+ 4,427
41,976
Securities lent to dealers
10,669
+ 1,648
– 1,429
11,123
Overnight facility4
10,669
+ 1,648
– 1,429
11,123
U.S. Treasury securities
9,860
+ 1,721
– 1,405
10,373
Federal agency debt securities
810
– 72
– 23
750
Note: Components may not sum to totals because of rounding.
1.
Includes securities and U.S. Treasury STRIPS at face value, and inflation compensation on TIPS. Does not include securities pledged as collateral to foreign official and international account holders against reverse repurchase agreements with the Federal Reserve presented in tables 1, 8, and 9.
2.
Face value of federal agency securities and current face value of mortgage-backed securities, which is the remaining principal balance of the securities.
3.
Includes non-marketable U.S. Treasury securities, supranationals, corporate bonds, asset-backed securities, and commercial paper at face value.
4.
Face value. Fully collateralized by U.S. Treasury securities.
2. Maturity Distribution of Securities, Loans, and Selected Other Assets and Liabilities, September 10, 2014
Millions of dollars
Remaining Maturity
Within 15
days
16 days to
90 days
91 days to
1 year
Over 1 year
to 5 years
Over 5 year
to 10 years
Over 10
years
All
Loans1
118
234
0
0
0
…
352
U.S. Treasury securities2
Holdings
0
90
3,194
1,037,162
742,261
657,930
2,440,637
Weekly changes
0
0
0
+ 1,615
– 1
+ 2,037
+ 3,651
Federal agency debt securities3
Holdings
1,556
1,329
3,584
32,746
0
2,347
41,562
Weekly changes
0
0
0
0
0
0
0
Mortgage-backed securities4
Holdings
0
0
0
10
4,698
1,673,614
1,678,322
Weekly changes
0
0
0
0
+ 863
– 857
+ 6
Asset-backed securities held by
TALF LLC5
0
0
0
0
0
0
0
Repurchase agreements6
0
0
…
…
…
…
0
Central bank liquidity swaps7
77
0
0
0
0
0
77
Reverse repurchase agreements6
267,602
0
…
…
…
…
267,602
Term deposits
0
0
0
…
…
…
0
Note: Components may not sum to totals because of rounding.
…Not applicable.
1.
Excludes the loans from the Federal Reserve Bank of New York (FRBNY) to Maiden Lane LLC, Maiden Lane II LLC, Maiden
Lane III LLC, and TALF LLC. The loans were eliminated when preparing the FRBNY’s statement of condition consistent with consolidation
under generally accepted accounting principles.
2.
Face value. For inflation-indexed securities, includes the original face value and compensation that adjusts for the effect of inflation on the
original face value of such securities.
3.
Face value.
4.
Guaranteed by Fannie Mae, Freddie Mac, and Ginnie Mae. The current face value shown is the remaining principal balance of the securities.
5.
Face value of asset-backed securities held by TALF LLC, which is the remaining principal balance of the underlying assets.
6.
Cash value of agreements.
7.
Dollar value of foreign currency held under these agreements valued at the exchange rate to be used when the foreign currency is returned to
the foreign central bank. This exchange rate equals the market exchange rate used when the foreign currency was acquired from the foreign
central bank.
3. Supplemental Information on Mortgage-Backed Securities
Millions of dollars
Account name
Wednesday
Sep 10, 2014
Mortgage-backed securities held outright1
1,678,322
Commitments to buy mortgage-backed securities2
80,643
Commitments to sell mortgage-backed securities2
0
Cash and cash equivalents3
4
1.
Guaranteed by Fannie Mae, Freddie Mac, and Ginnie Mae. The current face value shown is the remaining principal balance of the securities.
2.
Current face value. Generally settle within 180 days and include commitments associated with outright transactions, dollar rolls, and coupon swaps.
3.
This amount is included in other Federal Reserve assets in table 1 and in other assets in table 8 and table 9.
4. Information on Principal Accounts of Maiden Lane LLC
Millions of dollars
Account name
Wednesday
Sep 10, 2014
Net portfolio holdings of Maiden Lane LLC1
1,665
Outstanding principal amount of loan extended by the Federal Reserve Bank of New York2
0
Accrued interest payable to the Federal Reserve Bank of New York2
0
Outstanding principal amount and accrued interest on loan payable to JPMorgan Chase & Co.3
0
1.
Fair value. Fair value reflects an estimate of the price that would be received upon selling an asset if the transaction were to be conducted in an orderly market on the measurement date. Revalued quarterly. This table reflects valuations as of June 30, 2014. Any assets purchased after
this valuation date are initially recorded at cost until their estimated fair value as of the purchase date becomes available.
2.
Book value. This amount was eliminated when preparing the Federal Reserve Bank of New York’s statement of condition consistent with consolidation under generally accepted accounting principles. Refer to the note on consolidation accompanying table 9.
3.
Book value. The fair value of these obligations is included in other liabilities and capital in table 1 and in other liabilities and accrued dividends in table 8 and table 9.
Note: On June 26, 2008, the Federal Reserve Bank of New York (FRBNY) extended credit to Maiden Lane LLC under the authority of section 13(3) of the Federal Reserve Act. This limited liability company was formed to acquire certain assets of Bear Stearns and to manage those assets through time to maximize repayment of the credit extended and to minimize disruption to financial markets. Payments by Maiden Lane LLC from the proceeds of the net portfolio holdings will be made in the following order: operating expenses of the LLC, principal due to the FRBNY, interest due to the FRBNY, principal due to JPMorgan Chase & Co., and interest due to JPMorgan Chase & Co. Any remaining funds will be paid to the FRBNY.
5. Information on Principal Accounts of Maiden Lane II LLC
Millions of dollars
Account name
Wednesday
Sep 10, 2014
Net portfolio holdings of Maiden Lane II LLC1
63
Outstanding principal amount of loan extended by the Federal Reserve Bank of New York2
0
Accrued interest payable to the Federal Reserve Bank of New York2
0
Deferred payment and accrued interest payable to subsidiaries of American International Group, Inc.3
0
1.
Fair value. Fair value reflects an estimate of the price that would be received upon selling an asset if the transaction were to be conducted in an orderly market on the measurement date. Revalued quarterly. This table reflects valuations as of June 30, 2014. Any assets purchased after
this valuation date are initially recorded at cost until their estimated fair value as of the purchase date becomes available.
2.
Book value. This amount was eliminated when preparing the Federal Reserve Bank of New York’s statement of condition consistent with consolidation under generally accepted accounting principles. Refer to the note on consolidation accompanying table 9.
3.
Book value. The deferred payment represents the portion of the proceeds of the net portfolio holdings due to subsidiaries of American
International Group, Inc. in accordance with the asset purchase agreement. The fair value of this payment and accrued interest payable are
included in other liabilities and capital in table 1 and in other liabilities and accrued dividends in table 8 and table 9.
Note: On December 12, 2008, the Federal Reserve Bank of New York (FRBNY) began extending credit to Maiden Lane II LLC under the authority of section 13(3) of the Federal Reserve Act. This limited liability company was formed to purchase residential mortgage-backed securities from the U.S. securities lending reinvestment portfolio of subsidiaries of American International Group, Inc. (AIG subsidiaries). Payments by Maiden Lane II LLC from the proceeds of the net portfolio holdings will be made in the following order: operating expenses of Maiden Lane II LLC, principal due to the FRBNY, interest due to the FRBNY, and deferred payment and interest due to AIG subsidiaries. Any remaining funds will be shared by the FRBNY and AIG subsidiaries.
6. Information on Principal Accounts of Maiden Lane III LLC
Millions of dollars
Account name
Wednesday
Sep 10, 2014
Net portfolio holdings of Maiden Lane III LLC1
22
Outstanding principal amount of loan extended by the Federal Reserve Bank of New York2
0
Accrued interest payable to the Federal Reserve Bank of New York2
0
Outstanding principal amount and accrued interest on loan payable to American International Group, Inc.3
0
1.
Fair value. Fair value reflects an estimate of the price that would be received upon selling an asset if the transaction were to be conducted in an orderly market on the measurement date. Revalued quarterly. This table reflects valuations as of June 30, 2014. Any assets purchased after
this valuation date are initially recorded at cost until their estimated fair value as of the purchase date becomes available.
2.
Book value. This amount was eliminated when preparing the Federal Reserve Bank of New York’s statement of condition consistent with consolidation under generally accepted accounting principles. Refer to the note on consolidation accompanying table 9.
3.
Book value. The fair value of these obligations is included in other liabilities and capital in table 1 and in other liabilities and accrued dividends in table 8 and table 9.
Note: On November 25, 2008, the Federal Reserve Bank of New York (FRBNY) began extending credit to Maiden Lane III LLC under the authority of section 13(3) of the Federal Reserve Act. This limited liability company was formed to purchase multi-sector collateralized debt obligations (CDOs) on which the Financial Products group of American International Group, Inc. (AIG) has written credit default swap (CDS) contracts. In connection with the purchase of CDOs, the CDS counterparties will concurrently unwind the related CDS transactions. Payments by Maiden Lane III LLC from the proceeds of the net portfolio holdings will be made in the following order: operating expenses of Maiden Lane III LLC, principal due to the FRBNY, interest due to the FRBNY, principal due to AIG, and interest due to AIG. Any remaining funds will be shared by the FRBNY and AIG.
7. Information on Principal Accounts of TALF LLC
Millions of dollars
Account name
Wednesday
Sep 10, 2014
Asset-backed securities holdings1
0
Other investments, net
44
Net portfolio holdings of TALF LLC
44
Outstanding principal amount of loan extended by the Federal Reserve Bank of New York2
0
Accrued interest payable to the Federal Reserve Bank of New York2
0
Funding provided by U.S. Treasury to TALF LLC, including accrued interest payable3
0
1.
Fair value. Fair value reflects an estimate of the price that would be received upon selling an asset if the transaction were to be conducted in an orderly market on the measurement date.
2.
Book value. This amount was eliminated when preparing the Federal Reserve Bank of New York’s statement of condition consistent with consolidation under generally accepted accounting principles. Refer to the note on consolidation accompanying table 9.
3.
Book value. The fair value of these obligations is included in other liabilities and capital in table 1 and in other liabilities and accrued dividends in table 8 and table 9.
Note: On November 25, 2008, the Federal Reserve announced the creation of the Term Asset-Backed Securities Loan Facility (TALF) under theauthority of section 13(3) of the Federal Reserve Act. The TALF is a facility under which the Federal Reserve Bank of New York (FRBNY) extended loans with a term of up to five years to holders of eligible asset-backed securities. The Federal Reserve closed the TALF for new loan extensions in 2010. The loans provided through the TALF to eligible borrowers are non-recourse, meaning that the obligation of the borrower can be discharged by surrendering the collateral to the FRBNY.
TALF LLC is a limited liability company formed to purchase and manage any asset-backed securities received by the FRBNY in connection with the decision of a borrower not to repay a TALF loan. TALF LLC has committed, for a fee, to purchase all asset-backed securities received by the FRBNY in conjunction with a TALF loan at a price equal to the TALF loan plus accrued but unpaid interest. Prior to January 15, 2013, the U.S. Treasury’s Troubled Asset Relief Program (TARP) committed backup funding to TALF LLC, providing credit protection to the FRBNY. However, the accumulated fees and income collected through the TALF and held by TALF LLC now exceed the remaining amount of TALF loans outstanding. Accordingly, the TARP credit protection commitment has been terminated, and TALF LLC has begun to distribute excess proceeds to the Treasury and the FRBNY. Any remaining funds will be shared by the FRBNY and the U.S. Treasury.
8. Consolidated Statement of Condition of All Federal Reserve Banks
Millions of dollars
Assets, liabilities, and capital
Eliminations from consolidation
Wednesday
Sep 10, 2014
Change since
Wednesday
Wednesday
Sep 3, 2014
Sep 11, 2013
Assets
Gold certificate account
11,037
0
0
Special drawing rights certificate account
5,200
0
0
Coin
1,930
+ 8
– 62
Securities, unamortized premiums and discounts, repurchase agreements, and loans
4,351,126
+ 3,534
+ 756,847
Securities held outright1
4,160,521
+ 3,657
+ 763,739
U.S. Treasury securities
2,440,637
+ 3,651
+ 399,549
Bills2
0
0
0
Notes and bonds, nominal2
2,326,351
+ 3,661
+ 385,784
Notes and bonds, inflation-indexed2
97,755
0
+ 10,546
Inflation compensation3
16,531
– 10
+ 3,219
Federal agency debt securities2
41,562
0
– 22,654
Mortgage-backed securities4
1,678,322
+ 6
+ 386,844
Unamortized premiums on securities held outright5
208,907
– 132
+ 5,820
Unamortized discounts on securities held outright5
-18,654
+ 19
– 12,787
Repurchase agreements6
0
0
0
Loans
352
– 10
+ 75
Net portfolio holdings of Maiden Lane LLC7
1,665
+ 1
+ 167
Net portfolio holdings of Maiden Lane II LLC8
63
0
– 1
Net portfolio holdings of Maiden Lane III LLC9
22
0
0
Net portfolio holdings of TALF LLC10
44
0
– 68
Items in process of collection
(0)
94
– 22
– 31
Bank premises
2,255
0
– 29
Central bank liquidity swaps11
77
+ 1
– 243
Foreign currency denominated assets12
22,801
– 404
– 925
Other assets13
25,095
+ 2,704
+ 3,719
Total assets
(0)
4,421,408
+ 5,821
+ 759,373
Note: Components may not sum to totals because of rounding. Footnotes appear at the end of the table.
8. Consolidated Statement of Condition of All Federal Reserve Banks (continued)
Millions of dollars
Assets, liabilities, and capital
Eliminations from consolidation
Wednesday
Sep 10, 2014
Change since
Wednesday
Wednesday
Sep 3, 2014
Sep 11, 2013
Liabilities
Federal Reserve notes, net of F.R. Bank holdings
1,247,980
– 2,086
+ 84,510
Reverse repurchase agreements14
267,602
+ 17,296
+ 175,438
Deposits
(0)
2,842,072
– 8,612
+ 499,663
Term deposits held by depository institutions
0
0
0
Other deposits held by depository institutions
2,788,954
– 24,799
+ 513,312
U.S. Treasury, General Account
31,872
+ 10,836
+ 1,852
Foreign official
5,241
– 1,326
– 3,524
Other15
(0)
16,004
+ 6,676
– 11,978
Deferred availability cash items
(0)
721
– 482
– 163
Other liabilities and accrued dividends16
6,693
– 299
– 1,529
Total liabilities
(0)
4,365,067
+ 5,817
+ 757,919
Capital accounts
Capital paid in
28,170
+ 2
+ 726
Surplus
28,170
+ 2
+ 726
Other capital accounts
0
0
0
Total capital
56,341
+ 4
+ 1,454
Note: Components may not sum to totals because of rounding.
1.
Includes securities lent to dealers under the overnight securities lending facility; refer to table 1A.
2.
Face value of the securities.
3.
Compensation that adjusts for the effect of inflation on the original face value of inflation-indexed securities.
4.
Guaranteed by Fannie Mae, Freddie Mac, and Ginnie Mae. The current face value shown is the remaining principal balance of the securities.
5.
Reflects the premium or discount, which is the difference between the purchase price and the face value of the securities that has not been amortized. For U.S. Treasury and Federal agency debt securities, amortization is on a straight-line basis. For mortgage-backed securities, amortization is on an effective-interest basis.
6.
Cash value of agreements, which are collateralized by U.S. Treasury and federal agency securities.
7.
Refer to table 4 and the note on consolidation accompanying table 9.
8.
Refer to table 5 and the note on consolidation accompanying table 9.
9.
Refer to table 6 and the note on consolidation accompanying table 9.
10.
Refer to table 7 and the note on consolidation accompanying table 9.
11.
Dollar value of foreign currency held under these agreements valued at the exchange rate to be used when the foreign currency is returned to
the foreign central bank. This exchange rate equals the market exchange rate used when the foreign currency was acquired from the foreign
central bank.
12.
Revalued daily at current foreign currency exchange rates.
13.
Includes accrued interest, which represents the daily accumulation of interest earned, and other accounts receivable.
14.
Cash value of agreements, which are collateralized by U.S. Treasury securities, federal agency debt securities, and mortgage-backed securities.
15.
Includes deposits held at the Reserve Banks by international and multilateral organizations, government-sponsored enterprises, and designated financial market utilities.
16.
Includes the liabilities of Maiden Lane LLC, Maiden Lane II LLC, Maiden Lane III LLC, and TALF LLC to entities other than the Federal
Reserve Bank of New York, including liabilities that have recourse only to the portfolio holdings of these LLCs. Refer to table 4 through table 7 and the note on consolidation accompanying table 9. Also includes the liability for interest on Federal Reserve notes due to U.S. Treasury.
9. Statement of Condition of Each Federal Reserve Bank, September 10, 2014
Millions of dollars
Assets, liabilities, and capital
Total
Boston
New York
Philadelphia
Cleveland
Richmond
Atlanta
Chicago
St. Louis
Minneapolis
Kansas
Dallas
San
City
Francisco
Assets
Gold certificate account
11,037
352
4,125
338
464
824
1,349
706
278
173
291
880
1,257
Special drawing rights certificate acct.
5,200
196
1,818
210
237
412
654
424
150
90
153
282
574
Coin
1,930
32
94
124
123
320
222
276
25
46
153
182
332
Securities, unamortized premiums and discounts, repurchase agreements,
and loans
4,351,126
88,009
2,670,390
104,231
94,993
243,168
240,542
177,833
53,725
26,795
57,330
132,586
461,524
Securities held outright1
4,160,521
84,160
2,553,576
99,673
90,839
232,534
229,991
170,046
51,317
25,497
54,804
126,772
441,311
U.S. Treasury securities
2,440,637
49,370
1,497,974
58,470
53,288
136,409
134,917
99,752
30,104
14,957
32,149
74,367
258,881
Bills2
0
0
0
0
0
0
0
0
0
0
0
0
0
Notes and bonds3
2,440,637
49,370
1,497,974
58,470
53,288
136,409
134,917
99,752
30,104
14,957
32,149
74,367
258,881
Federal agency debt securities2
41,562
841
25,509
996
907
2,323
2,298
1,699
513
255
547
1,266
4,409
Mortgage-backed securities4
1,678,322
33,949
1,030,093
40,207
36,644
93,803
92,777
68,595
20,701
10,285
22,107
51,139
178,021
Unamortized premiums on securities held outright5
208,907
4,226
128,220
5,005
4,561
11,676
11,548
8,538
2,577
1,280
2,752
6,365
22,159
Unamortized discounts on securities held outright5
-18,654
-377
-11,449
-447
-407
-1,043
-1,031
-762
-230
-114
-246
-568
-1,979
Repurchase agreements6
0
0
0
0
0
0
0
0
0
0
0
0
0
Loans
352
1
44
0
0
0
34
11
61
132
20
17
33
Net portfolio holdings of Maiden
Lane LLC7
1,665
0
1,665
0
0
0
0
0
0
0
0
0
0
Net portfolio holdings of Maiden
Lane II LLC8
63
0
63
0
0
0
0
0
0
0
0
0
0
Net portfolio holdings of Maiden
Lane III LLC9
22
0
22
0
0
0
0
0
0
0
0
0
0
Net portfolio holdings of TALF LLC10
44
0
44
0
0
0
0
0
0
0
0
0
0
Items in process of collection
94
0
0
0
0
0
93
0
0
1
0
0
0
Bank premises
2,255
121
434
74
110
222
209
198
124
97
243
224
200
Central bank liquidity swaps11
77
4
25
6
6
16
4
2
1
0
1
1
11
Foreign currency denominated assets12
22,801
1,037
7,335
1,714
1,813
4,754
1,311
629
192
96
240
381
3,299
Other assets13
25,095
535
15,039
739
546
1,547
1,374
1,014
356
219
347
798
2,580
Interdistrict settlement account
0
+ 10,547
– 58,585
+ 2,678
+ 9,252
+ 197
+ 8,040
– 10,297
– 10,950
– 2,083
– 134
+ 2,635
+ 48,701
Total assets
4,421,408
100,833
2,642,468
110,114
107,543
251,460
253,799
170,787
43,900
25,434
58,623
137,969
518,478
Note: Components may not sum to totals because of rounding. Footnotes appear at the end of the table.
9. Statement of Condition of Each Federal Reserve Bank, September 10, 2014 (continued)
Millions of dollars
Assets, liabilities, and capital
Total
Boston
New York
Philadelphia
Cleveland
Richmond
Atlanta
Chicago
St. Louis
Minneapolis
Kansas
Dallas
San
City
Francisco
Liabilities
Federal Reserve notes outstanding
1,443,974
44,572
489,349
42,766
65,118
103,568
212,875
94,569
37,360
21,242
36,783
115,911
179,862
Less: Notes held by F.R. Banks
195,994
5,311
63,063
6,357
8,870
11,177
20,690
11,915
4,937
4,278
5,302
25,736
28,359
Federal Reserve notes, net
1,247,980
39,261
426,285
36,409
56,248
92,391
192,186
82,654
32,423
16,964
31,481
90,175
151,503
Reverse repurchase agreements14
267,602
5,413
164,244
6,411
5,843
14,956
14,793
10,937
3,301
1,640
3,525
8,154
28,385
Deposits
2,842,072
53,409
2,030,175
62,876
40,791
131,999
42,547
75,315
7,510
6,356
22,882
38,429
329,783
Term deposits held by depository institutions
0
0
0
0
0
0
0
0
0
0
0
0
0
Other deposits held by depository institutions
2,788,954
53,397
1,977,410
62,837
40,788
131,731
42,538
75,306
7,510
6,355
22,881
38,428
329,774
U.S. Treasury, General Account
31,872
0
31,872
0
0
0
0
0
0
0
0
0
0
Foreign official
5,241
2
5,214
3
3
8
2
1
0
0
0
1
6
Other15
16,004
11
15,679
36
0
260
7
7
0
0
1
0
3
Deferred availability cash items
721
0
0
0
0
0
611
0
0
110
0
0
0
Interest on Federal Reserve notes due
to U.S. Treasury16
1,693
19
1,199
20
10
23
86
73
20
12
20
54
155
Other liabilities and accrued
dividends17
5,000
167
2,179
211
208
544
361
282
142
118
126
208
454
Total liabilities
4,365,067
98,270
2,624,083
105,927
103,101
239,913
250,583
169,261
43,395
25,200
58,034
137,021
510,279
Capital
Capital paid in
28,170
1,282
9,193
2,093
2,221
5,773
1,608
763
252
117
295
474
4,099
Surplus
28,170
1,282
9,193
2,093
2,221
5,773
1,608
763
252
117
295
474
4,099
Other capital
0
0
0
0
0
0
0
0
0
0
0
0
0
Total liabilities and capital
4,421,408
100,833
2,642,468
110,114
107,543
251,460
253,799
170,787
43,900
25,434
58,623
137,969
518,478
Note: Components may not sum to totals because of rounding. Footnotes appear at the end of the table.
9. Statement of Condition of Each Federal Reserve Bank, September 10, 2014 (continued)
1.
Includes securities lent to dealers under the overnight securities lending facility; refer to table 1A.
2.
Face value of the securities.
3.
Includes the original face value of inflation-indexed securities and compensation that adjusts for the effect of inflation on the original face value of such securities.
4.
Guaranteed by Fannie Mae, Freddie Mac, and Ginnie Mae. The current face value shown is the remaining principal balance of the securities.
5.
Reflects the premium or discount, which is the difference between the purchase price and the face value of the securities that has not been amortized. For U.S. Treasury and Federal agency debt securities, amortization is on a straight-line basis. For mortgage-backed securities, amortization is on an effective-interest basis.
6.
Cash value of agreements, which are collateralized by U.S. Treasury and federal agency securities.
7.
Refer to table 4 and the note on consolidation below.
8.
Refer to table 5 and the note on consolidation below.
9.
Refer to table 6 and the note on consolidation below.
10.
Refer to table 7 and the note on consolidation below.
11.
Dollar value of foreign currency held under these agreements valued at the exchange rate to be used when the foreign currency is returned to the foreign central bank. This exchange rate
equals the market exchange rate used when the foreign currency was acquired from the foreign central bank.
12.
Revalued daily at current foreign currency exchange rates.
13.
Includes accrued interest, which represents the daily accumulation of interest earned, and other accounts receivable.
14.
Cash value of agreements, which are collateralized by U.S. Treasury securities, federal agency debt securities, and mortgage-backed securities.
15.
Includes deposits held at the Reserve Banks by international and multilateral organizations, government-sponsored enterprises, and designated financial market utilities.
16.
Represents the estimated weekly remittances to U.S. Treasury as interest on Federal Reserve notes or, in those cases where the Reserve Bank’s net earnings are not sufficient to equate surplus to capital paid-in, the deferred asset for interest on Federal Reserve notes. The amount of any deferred asset, which is presented as a negative amount in this line, represents the amount of the Federal Reserve Bank’s earnings that must be retained before remittances to the U.S. Treasury resume. The amounts on this line are calculated in accordance with Board of Governors policy, which requires the Federal Reserve Banks to remit residual earnings to the U.S. Treasury as interest on Federal Reserve notes after providing for the costs of operations, payment of dividends, and the amount necessary to equate surplus with capital paid-in.
17.
Includes the liabilities of Maiden Lane LLC, Maiden Lane II LLC, Maiden Lane III LLC, and TALF LLC to entities other than the Federal Reserve Bank of New York, including liabilities that have recourse only to the portfolio holdings of these LLCs. Refer to table 4 through table 7 and the note on consolidation below.
Note on consolidation:
The Federal Reserve Bank of New York (FRBNY) has extended loans to several limited liability companies under the authority of section 13(3) of the Federal Reserve Act. On June 26, 2008, a loan was extended to Maiden Lane LLC, which was formed to acquire certain assets of Bear Stearns. On November 25, 2008, a loan was extended to Maiden Lane III LLC, which was formed to purchase multi-sector collateralized debt obligations on which the Financial Products group of the American International Group, Inc. has written credit default swap contracts. On December 12, 2008, a loan was extended to Maiden Lane II LLC, which was formed to purchase residential mortgage-backed securities from the U.S. securities lending reinvestment portfolio of subsidiaries of American International Group, Inc. On November 25, 2008, the Federal Reserve Board authorized the FRBNY to extend credit to TALF LLC, which was formed to purchase and manage any asset-backed securities received by the FRBNY in connection with the decision of a borrower not to repay a loan extended under the Term Asset-Backed Securities Loan Facility.
The FRBNY is the primary beneficiary of TALF LLC, because of the two beneficiaries of the LLC, the FRBNY and the U.S. Treasury, the FRBNY is primarily responsible for directing the financial activities of TALF LLC. The FRBNY is the primary beneficiary of the other LLCs cited above because it will receive a majority of any residual returns of the LLCs and absorb a majority of any residual losses of the LLCs. Consistent with generally accepted accounting principles, the assets and liabilities of these LLCs have been consolidated with the assets and liabilities of the FRBNY in the preparation of the statements of condition shown on this release. As a consequence of the consolidation, the extensions of credit from the FRBNY to the LLCs are eliminated, the net assets of the LLCs appear as assets on the previous page (and in table 1 and table 8), and the liabilities of the LLCs to entities other than the FRBNY, including those with recourse only to the portfolio holdings of the LLCs, are included in other liabilities in this table (and table 1 and table 8).
10. Collateral Held against Federal Reserve Notes: Federal Reserve Agents’ Accounts
Millions of dollars
Federal Reserve notes and collateral
Wednesday
Sep 10, 2014
Federal Reserve notes outstanding
1,443,974
Less: Notes held by F.R. Banks not subject to collateralization
195,994
Federal Reserve notes to be collateralized
1,247,980
Collateral held against Federal Reserve notes
1,247,980
Gold certificate account
11,037
Special drawing rights certificate account
5,200
U.S. Treasury, agency debt, and mortgage-backed securities pledged1,2
1,231,743
Other assets pledged
0
Memo:
Total U.S. Treasury, agency debt, and mortgage-backed securities1,2
4,160,521
Less: Face value of securities under reverse repurchase agreements
257,508
U.S. Treasury, agency debt, and mortgage-backed securities eligible to be pledged
3,903,013
Note: Components may not sum to totals because of rounding.
1.
Includes face value of U.S. Treasury, agency debt, and mortgage-backed securities held outright, compensation to adjust for the effect of inflation on the original face value of inflation-indexed securities, and cash value of repurchase agreements.
2.
Includes securities lent to dealers under the overnight securities lending facility; refer to table 1A.
Story 1:Producers vs. Moochers: Obama’s Execution of The Cloward-Piven Strategy: Food Stamps, Medicaid, Welfare, Disability Benefits, Earned Income Credits, Obamacare, Student Loans, Veterans Administration, Open Borders, Massive Deficits and Debts, Unsustainable Unfunded Liabilities, High Unemployment Rates — Legal Status — Amnesty — Citizenship for 30-50 Million Illegal Aliens — Overloading The Welfare System — Democratic Progressive Party Tyranny — Obama’s Unconstrained Utopian Vision– Videos
Saul Alinsky’s 12 Rules for Radicals
Here is the complete list from Alinsky.
* RULE 1: “Power is not only what you have, but what the enemy thinks you have.” Power is derived from 2 main sources – money and people. “Have-Nots” must build power from flesh and blood. (These are two things of which there is a plentiful supply. Government and corporations always have a difficult time appealing to people, and usually do so almost exclusively with economic arguments.) * RULE 2: “Never go outside the expertise of your people.” It results in confusion, fear and retreat. Feeling secure adds to the backbone of anyone. (Organizations under attack wonder why radicals don’t address the “real” issues. This is why. They avoid things with which they have no knowledge.) * RULE 3: “Whenever possible, go outside the expertise of the enemy.” Look for ways to increase insecurity, anxiety and uncertainty. (This happens all the time. Watch how many organizations under attack are blind-sided by seemingly irrelevant arguments that they are then forced to address.) * RULE 4: “Make the enemy live up to its own book of rules.” If the rule is that every letter gets a reply, send 30,000 letters. You can kill them with this because no one can possibly obey all of their own rules. (This is a serious rule. The besieged entity’s very credibility and reputation is at stake, because if activists catch it lying or not living up to its commitments, they can continue to chip away at the damage.) * RULE 5: “Ridicule is man’s most potent weapon.” There is no defense. It’s irrational. It’s infuriating. It also works as a key pressure point to force the enemy into concessions. (Pretty crude, rude and mean, huh? They want to create anger and fear.) * RULE 6: “A good tactic is one your people enjoy.” They’ll keep doing it without urging and come back to do more. They’re doing their thing, and will even suggest better ones. (Radical activists, in this sense, are no different that any other human being. We all avoid “un-fun” activities, and but we revel at and enjoy the ones that work and bring results.) * RULE 7: “A tactic that drags on too long becomes a drag.” Don’t become old news. (Even radical activists get bored. So to keep them excited and involved, organizers are constantly coming up with new tactics.) * RULE 8: “Keep the pressure on. Never let up.” Keep trying new things to keep the opposition off balance. As the opposition masters one approach, hit them from the flank with something new. (Attack, attack, attack from all sides, never giving the reeling organization a chance to rest, regroup, recover and re-strategize.) * RULE 9: “The threat is usually more terrifying than the thing itself.” Imagination and ego can dream up many more consequences than any activist. (Perception is reality. Large organizations always prepare a worst-case scenario, something that may be furthest from the activists’ minds. The upshot is that the organization will expend enormous time and energy, creating in its own collective mind the direst of conclusions. The possibilities can easily poison the mind and result in demoralization.) * RULE 10: “If you push a negative hard enough, it will push through and become a positive.” Violence from the other side can win the public to your side because the public sympathizes with the underdog. (Unions used this tactic. Peaceful [albeit loud] demonstrations during the heyday of unions in the early to mid-20th Century incurred management’s wrath, often in the form of violence that eventually brought public sympathy to their side.) * RULE 11: “The price of a successful attack is a constructive alternative.” Never let the enemy score points because you’re caught without a solution to the problem. (Old saw: If you’re not part of the solution, you’re part of the problem. Activist organizations have an agenda, and their strategy is to hold a place at the table, to be given a forum to wield their power. So, they have to have a compromise solution.) * RULE 12: Pick the target, freeze it, personalize it, and polarize it.” Cut off the support network and isolate the target from sympathy. Go after people and not institutions; people hurt faster than institutions. (This is cruel, but very effective. Direct, personalized criticism and ridicule works.)
John Stossel – A Nation Of Moochers
John Stossel – Serious Crony Capitalism
How Crony Capitalism Corrupts the Free Market | David Stockman
David Stockman on TARP, the Fed, Ron Paul and Reagan [FULL VERSION]
The Forgotten Cause of Sound Money | David Stockman
Carmen Reinhart on Financial Crisis and Fiscal Policy
Kenneth Rogoff – Why Austerity is right & Growth is critical (19.12.12)
Record Number Of Americans Receiving Disability Benefits – Stuart Varney – America’s Newsroom
Number Of People On Food Stamps Up 70% Since 2008 – America’s News HQ
Economics 101-The Dangers Of Government Dependency
Opinion: The Government Dependency Trap
Land of The Freebies, Home of the Enslaved
Is Government Dependence the New American Way – Working Doesn’t Pay
Welfare fraud investigation
Mark Levin: The Cloward Piven & Obama strategy
Matthew Vadum on Glenn Beck Program, May 28, 2009 (replayed June 4, 2009)
Glenn Beck Learns About Cloward-Piven Strategy of Orchestrated Crisis
The Cloward/Piven Strategy 1
The Cloward/Piven Strategy 2
The Cloward/Piven Strategy 3
The Cloward/Piven Strategy 4
The Cloward/Piven Strategy 5
The Cloward/Piven Strategy 6
Frances Fox Piven’s opinion of Glenn Beck
Professor Frances Fox Piven on Glenn Beck targeting her
Saul Alinsky speaking at UCLA 1/17/1969
Alinsky for Dummies (Mr. Joseph A. Morris – Acton Institute)
02-05-13 Macro Analytics – The Cloward Piven Strategy
What In The World Is Cloward-PIven (and is it working?)
The End of America….The Cloward-Piven Strategy
complete cloward piven strategy project
Cloward Piven Strategy
Fall 2010 Marc Sumerlin Lecture Series Featuring Prof. Carmen Reinhart
MILTON FRIEDMAN-what alinsky never told obama..
Milton Friedman Versus A Socialist
Thomas Sowell – Frances Fox Piven vs. Milton Friedman
Obama’s Vision for America by Thomas Sowell!
Thomas Sowell and a Conflict of Visions
Blues Brothers – Minnie the Moocher (Cab Calloway)
The great and calamitous fiscal trends of our time—dependence on government by an increasing portion of the American population, and soaring debt that threatens the financial integrity of the economy—worsened yet again in 2011 and 2012. This rise in government dependence happened despite the nation undergoing an economic recovery after the economic collapse of 2008 and 2009. The United States has reached the point at which it must reverse the direction of both trends or eventually face economic and social collapse. Yet policymakers have made little progress on either front since the 2012 Index of Dependence on Government was published. The United States held a dubious distinction in 2011—44.7 percent of the population pays no federal income taxes. While this percentage is a cause for concern, the figure is an improvement compared to the 48.5 percent of the population who paid no federal income taxes in 2010. Among the greatest danger is that the swelling over time of the ranks of Americans who enjoy government services and benefits for which they pay few or no taxes will lead to a spreading sense of entitlement that is simply incompatible with self-government.
America is increasingly moving away from a nation of self-reliant individuals, where civil society flourishes, toward a nation of individuals less inclined to practicing self-reliance and personal responsibility. Government programs not only crowd out civil society, but too frequently trap individuals and families in long-term dependence, leaving them incapable of escaping their condition for generations to come. Rebuilding civil society can rescue these individuals from the government dependence trap.
Related to these disturbing trends, publicly held debt continued its amazing ascent without any plan by the government to pay it back. As if those circumstances were not dire enough, the country is about to witness the largest generational retirement in world history by a population that will depend on currently insolvent pension and health programs.
The 2013 Index of Dependence on Government is designed to measure the amount of federal spending on programs that assume the responsibilities of individuals, families, communities, neighborhood groups, religious institutions, and other civil society institutions. It seeks to measure the overall extent to which the society as a whole, as opposed to any particular individual, is dependent on government.
The 2013 Index of Dependence on Government highlights the gathering fiscal storm clouds. Unsustainable increases in spending on dependence-creating programs that supplant the role of civil society predate the recent recession, and have continued to rise since the economy collapsed in 2008 and 2009. There is one silver lining to those clouds: A few policymakers and independent public policy groups have advanced plans for restoring fiscal balance in Washington. Among them is The Heritage Foundation. Heritage calls its fiscal plan Saving the American Dream. The Heritage plan reforms and funds those government programs that matter most to people who need the government’s help, and it frees the private sector to create the millions of jobs that will dramatically reduce the growth of dependence on government.
The Index of Dependence on Government measures the growth in spending on dependence-creating programs that supplant the role of civil society. Dependence on government in the U.S. rose again in 2011, the year of the most recently available data, and which is principally assessed by this report. A solid majority of Americans polled by Rasmussen believe that government dependence is too high. In a September 2013 poll, 67 percent of adults nationwide said that too many Americans are dependent on the government.[1]
Virtually no issue so dominates the current public policy debate as the future financial health of the United States. Americans are haunted by the specter of growing mountains of debt that sap the economic and social vitality of the country. The enormous growth in debt is largely driven by dependence-creating government programs. Only the painfully slow labor market recovery garners more attention, and many are beginning to believe that even that sluggishness is tied to the nation’s growing burden of publicly held debt.[2] Carmen M. Reinhart and Kenneth S. Rogoff of Harvard University created a unique data set of countries’ financial crises covering eight centuries. Reinhart and Rogoff conclude that a unifying problem among the financial crises they analyzed is government debt.[3] They coined the phrase “this-time-is-different syndrome,” that is, the “belief that financial crises are things that happen to other people in other countries at other times; crises do not happen to us, here and now. We are doing things better, we are smarter, we have learned from past mistakes.”[4] This syndrome is often displayed despite indicators of a forthcoming financial crisis being apparent to all. The U.S. federal government has accumulated a debt of staggering proportions. While the Congressional Budget Office (CBO) estimates strongly suggest that the federal government’s spending pattern is unsustainable,[5] Congress has done little to avert a foreseeable financial crisis.
Of course, the roots of the problems produced by the great and growing debt lie in the spending behaviors of the federal government. Annual deficits far greater than the government’s revenue are fueling explosive levels of debt. One such significant area of rapid growth is in those programs that create economic and social dependence on government.
The 2013 publication of the Index of Dependence on Government marks the 11th year that The Heritage Foundation has flashed warning lights about Americans’ growing dependence on government programs. When discussing dependence, one must make a careful distinction between different kinds of dependence. According to Yuval Levin, the editor of National Affairs:
We are all dependent on others. The question is whether we are dependent on people we know, and they on us—in ways that foster family and community, build habits of restraint and dignity, and instill in us responsibility and a sense of obligation—or we are dependent on distant, neutral, universal systems of benefits that help provide for our material wants without connecting us to any local and immediate nexus of care and obligation. It is not dependence per se, which is a universal fact of human life, but dependence without mutual obligation, that corrupts the soul.[6]
This Index is designed to measure the pace at which federal government services and programs have grown in areas once considered to be the responsibility of civil society. Civil society is the space between the individual and the state where individuals, families, communities, neighborhood groups, religious institutions, and other institutions of civil society preside. America is increasingly moving away from a nation of self-reliant individuals, where civil society flourishes, toward a nation of individuals less inclined to practicing self-reliance and personal responsibility. Government programs not only crowd out civil society, but too frequently trap individuals and families in long-term dependence, leaving them incapable of escaping their condition for generations to come. Rebuilding civil society can rescue these individuals from the government dependence trap.
The Index uses data drawn from a carefully selected set of federally funded programs that were chosen for their propensity to duplicate or replace assistance—shelter, food, monetary aid, health care, education, or employment training—that was traditionally provided to people in need by local organizations and families. Thus, government dependence does not include traditional government services that provide public goods, such as defense, police protection, and transportation infrastructure. In contrast to public goods, dependence on government for basic tasks that individuals were traditionally expected to perform themselves, or were provided on a voluntary basis to those in need through the civil society, runs the risk of generating political pressure from interest groups—such as health care organizations, nonprofit organizations, and the aid recipients themselves—to expand and cement federal support. Readers should be aware that the increasing dependence on government is not limited to the lower class. The Social Security and Medicare entitlements, and other programs, such as government-backed higher education loans, provide services to the middle and upper classes.
For more than a decade, the Index has signaled troubling and rapid increases in the growth of dependence-creating federal programs, as measured by the amount of spending devoted to them, and every year Heritage has raised concerns about the challenges that rapidly growing dependence poses to this country’s republican form of government, its economy, and the broader civil society. Index measurements begin in 1962; since then, the Index score has grown by more than 20 times its original amount. This means that, keeping inflation neutral in the calculations, more than 20 times the resources were committed to paying for people who depend on government in 2011 than in 1962. In 2011 alone, the Index of Dependence on Government grew by 3.3 percent. This rise in government dependence occurred despite the modest economic recovery.The Index variables that grew the most from 2010 to 2011 were:
Education: 40.4 percent
Retirement: 3.1 percent
The Index has now grown by 80.1 percent since 2001. One of the most worrying trends in the Index is the coinciding growth in the non-taxpaying public. The percentage of the population who do not pay federal income taxes, and who are not claimed as dependents by someone who does pay them, jumped from 15 percent in 1984 to 48.5 percent in 2010. However, the portion of the population who did not pay federal income taxes dropped to 44.7 percent in 2011. The recent decrease is likely due to expiring tax credits that were temporarily authorized by the American Recovery and Reinvestment Act of 2009, and the start of the economic recovery. This means that in 1984, 35.3 million paid no taxes; in 2011, 139.3 million paid nothing.[7]
It is the conjunction of these two trends—higher spending on dependence-creating programs, and a long-term trend in an increased portion of the population who do not pay for these programs—that concerns those interested in the fate of the American form of government. Americans have always expressed concern about becoming dependent on government, even while understanding that life’s challenges cause most people, at one time or another, to depend on some form of aid from someone else. Americans’ concern stems partly from deeply held views that life’s blessings are more readily obtained by independent people, and that growing dependence on government erodes the spirit of personal and mutual responsibility created through family and civil society institutions. These views help explain the broad public support for welfare reform in the 1990s.
This ethic of self-reliance combined with a commitment to the brotherly care of those in need appears threatened in a much greater way today than when the Index first appeared in 2002. This year, 2013, marks another year that the Index contains significant retirements by baby boomers. By 2040, 93.8 million people will be collecting Social Security checks and drawing Medicare benefits.[8] Many retirees will also be relying on long-term care in assisted living facilities or home health care providers under Medicaid. No event will financially challenge these programs over the next two decades more than this shift into retirement of the largest generation in American history.
Some may argue that any measure of government dependence should not cover Social Security, because beneficiaries previously paid payroll taxes into the program before receiving benefits. However, the Index is designed to measure the amount of federal spending on programs that assume the responsibilities of individuals, families, communities, neighborhood groups, religious institutions, and other civil society institutions. Clearly, Social Security has greatly encroached on the responsibility of individuals for providing their own retirement resources.
It is not only financial tests that these programs will face. Certainly, financial challenges will be great over the next several decades, given that none of these “entitlement” programs can easily meet its obligations even now. Doubling the number of people in retirement will constitute a massive growth of the U.S. population that is largely dependent on government programs, and a potentially ruinous drain on federal finances. Even accounting for the increased productivity of current and future workers, the rapid increase in retirees coincides with historically fewer workers supporting those in retirement. Perhaps the most important aspect of the boomer retirement is its dramatic reminder of the rapidly growing dependence on government in the United States.
While the major contributors to the nation’s debt crisis are health and income support entitlement programs, such as Medicare and Social Security, Congress spends hundreds of billions of dollars on discretionary social programs each year. These social programs are intended to address a whole host of social problems, including low academic skills, poverty, sex outside marriage, out-of-wedlock births, unemployability and low wages, bad parenting, and relationship troubles within and outside marriage. Things that once were the subject of personal responsibility are now under the federal government’s jurisdiction. When rigorously evaluated, federal social programs have been found to be overwhelmingly ineffective.[9]
There has been such a rapid growth in dependence in recent years that the twin concerns—how much damage this growth has done to the republican form of government and how harmful it has been to the country’s financial situation—have deepened significantly. Not only has the federal government effectively taken over half of the U.S. economy and expanded public-sector debt by more than all previous governments combined, it also oversaw a third year, in 2011, of enormous expansion in total government debt at the federal level. Much of that growth in new debt can be traced to programs that encourage dependence. Chart 2 illustrates how 69.4 percent of federal spending now goes to dependence-creating programs, up dramatically from 21.2 percent in 1962 and 48.5 percent in 1990.
Many Americans are expressing increasing frustration at this fiscally grim state of affairs. Most Members of recent Congresses have known that the major entitlement programs not only need major repairs, but also that these programs are starting to drive up annual deficits and promise to produce substantial deficits in the near future. Many Americans are especially frustrated by the way Congress ignores or, at best, claims to support, comprehensive budget reform plans. Plans like The Heritage Foundation’sSaving the American Dream[10] and Representative Paul Ryan’s (R–WI) “Roadmap,”[11] offer blueprints for getting federal finances under control, but Congress has not seriously debated these or any other such plans.
This absence of genuine efforts by Congress to manage the federal government’s worsening financial crisis is now worrying a number of international financial organizations, including the International Monetary Fund (IMF). On May 14, 2010, the IMF ranked the U.S. in second place among countries that must reduce their structural deficit (caused in part by spending on dependence-creating programs) or risk financial calamity. The IMF predicted that U.S. public-sector debt would equal 100 percent of its gross domestic product (GDP) by 2015 unless immediate actions were taken to cut the deficits by an amount equal to 12 percent of GDP by 2014. The IMF concluded that Greece needed to cut its deficits by 9 percent of its national output to avoid the risk of financial calamity.
Then, on August 5, 2011, the credit rating company Standard & Poor’s downgraded U.S. sovereign debt from its AAA rating to AA+.[12] This dramatic and highly controversial assessment of the federal government’s financial health followed Moody’s Investors Service’s announcement three days earlier that the prospects for the fiscal health of the central government had turned “negative.”[13] Not to be outdone, on November 28, the third big ratings agency, Fitch, also revised its outlook on U.S. credit from “stable” to “negative” (meaning there was a slightly greater than 50 percent chance that Fitch would downgrade U.S. credit from AAA over the next two years).[14] On February 27, 2013, Fitch again warned that a downgrade could be imminent, stating:
During the course of this year Fitch expects to resolve the Negative Outlook placed on the sovereign ratings of the US in late 2011 after the failure of the Congressional Joint Select Committee on Deficit Reduction. In Fitch’s opinion, further delay in reaching agreement on a credible medium-term deficit reduction plan would imply public debt reaching levels inconsistent with the US retaining its “AAA” status despite its exceptional credit strengths.[15]
The IMF, the rating agencies, and many watchful citizens are right to be concerned about the growing debt and growing dependence. Programs that encourage dependence quickly morph into political assets that policymakers readily embrace. Many voters support politicians or political parties that mandate higher incomes or subsidies for the essentials of life. No matter how well meaning policymakers are when they create such aid programs, these same programs quickly spiral beyond their mission and become severe liabilities.
Many countries have already passed the fiscal tipping point, at which reckless growth in dependence programs produces domestic debt crises. How far along the path to crisis is the United States? Are Americans closing in on a tipping point that endangers the workings of their democracy? Or have Americans already passed that point? Can this republican form of government withstand the political weight of a massively growing population of Americans who receive government benefits and who contribute little or nothing for them? How seriously have these federal programs eroded civil society by eroding once-social obligations, and by crowding out services that used to be provided by families, congregations, and community groups?
To explore these questions, one must measure how much federal programs have grown. The Index of Dependence on Government is an attempt to measure these patterns and provide data to help ascertain the implications of these trends. Specifically, the Index measures the amount of spending on federal programs that perform functions once primarily provided by civil society. Table 1 contains the 2013 Index scores—from 1962 to 2011, with 1980 as the base year. As the table indicates, dependence on government has grown steadily at an alarming rate.
Despite the prevailing view that people were left on their own to solve their problems before the creation of the welfare state, there is a rich history of Americans providing voluntary mutual aid before and during the Progressive Era.[16] Assistance was often provided by private charity, mutual aid societies, and state and local governments.[17]
For example, a considerable share of the Masonic mutual aid involved employment-seeking assistance, short-term housing, and character references.[18] Other organizations, such as the Ancient Order of United Workmen, offered life insurance to members.[19] While the exact numbers are unknown, University of Alabama professor of history David T. Beito estimates that fraternal life insurance societies in 1910 had at least 13 million members.[20] These fraternal societies were characterized by “an autonomous system of lodges, a democratic form of internal government, a ritual, and the provision of mutual aid for members and their families.”[21]
However, the rise of the welfare state, especially during the New Deal and Great Society, assumed much of the social responsibility that was once the province of voluntary associations.[22] In essence, the welfare state “crowded out” or diminished the role of private charities and voluntary associations in benefiting members of society. The year after the Social Security Act of 1935 saw the beginning of benefit retrenchment by fraternal societies and their eventual decline.[23] The decline in mutual aid societies and the growth of federal domestic programs are likely the direct results of the growth of the welfare state.
Complementary research[24] to the Index indicates that federal dependence-creating programs crowd out assistance from civil society institutions, even replacing aid that used to come from family members. While the social science literature on crowd-out has found mixed results, the preponderance of the literature finds at least small crowd-out effects.[25]
Theoretically, crowd-out can occur in two ways. First, charitable donors will treat the taxes they pay to provide government-run welfare services as a substitute for donations to private charities.[26] In other words, the taxes paid to finance welfare programs make individuals less likely to make private donations, because they are already paying for assistance programs. This result has been coined the classic crowd-out effect. Second, private charities will substitute government grants for private donations.[27]
An analysis of the impact of the New Deal on religious charitable activity confirms the presence of the classic crowd-out effect.[28] Based on data from church activity from 1929 to 1939 for six of the largest Christian denominations (representing more than 20 percent of churches) during this period, the authors found “strong evidence that the rise in New Deal spending led to a fall in church charitable activity.”[29]Specifically, the “New Deal crowded out at least 30% of benevolent church spending.”[30]
A more current example of the welfare state crowding out voluntary assistance is the impact that unemployment insurance (UI) has on familial assistance. Familial assistance takes the form of family members helping relatives in times of need. For example, a recently unemployed son may receive financial assistance from his parents to help him get through a difficult period. A study using data from the Panel Study in Income Dynamics (PSID) found a negative association between the receipt of UI benefits and familial support.[31] Specifically, one dollar in UI benefits displaces familial support by $0.24 to $0.40.[32]
Additional studies have found classic crowd-out effects of government welfare spending. A national study that covered 1975 to 1994 found that a 10 percent increase in government aid to the poor is associated with a 5.87 percent decrease in private charitable donations.[33] A similar study covering 1965 to 2003 also found that government welfare spending has a negative association with charitable giving.[34]
Researcher Ralph M. Kramer finds that individual giving as a proportion of personal income fell by 13 percent between 1960 and 1976, while the proportion of philanthropic giving devoted to social welfare dropped 15 percent to 6 percent.[35] By 1974, government was spending about 10 times as much on social services as did nonprofit agencies, and that year the nonprofit agencies themselves received close to half ($23 billion) of their total revenues from government (receiving $25 billion from all other sources combined).[36] Such data also raise traditional concern about the long-term viability of the political institutions in a republic when a significant portion of the population becomes dependent on government for most or all of its income.[37]
Alternatively, when government welfare services contract, charitable giving may increase. This proposition was tested when the Personal Responsibility and Work Opportunity Reconciliation Act of 1996 cut federally funded welfare services to noncitizens. A nationwide analysis of Presbyterian Church congregations from 1994 to 2000 suggests that the reduction in federal welfare services to noncitizens was associated with an increase in charitable giving.[38] Specifically, a one dollar decrease in county-wide per capita welfare spending was associated with an increase of $0.40 in the church congregation’s per-member donations to local community projects.[39]
There is also evidence to support the second type of crowd-out effect of private charities and nonprofits substituting government grants for private donations. A study of more than 8,000 tax returns from American charities found a crowd-out effect of about 76 percent.[40] For example, a government grant of $1,000 to a charity was associated with a decrease in $760 in private donations raised by the charity. However, the study found that most of this decline in private donations is the result of reduced private fundraising efforts by government-funded charities.
This second type of crowd-out increases the influence of government, for better or worse, over government-funded charities. The acceptance of government funding by private charities may cause these entities to become dependent on future government funding. Further, government funding opens charities to government mandates that may run counter to the mission of charities. To avoid such mandates, for example, Catholic Charities in Illinois has closed most of its affiliates in the state rather than comply with a state law requiring it consider same-sex couples as potential foster-care and adoptive parents, contrary to the tenets of its faith, in order to continue receiving state money.[41]
The Fiscal Calamities Created by Growing Dependence
Entitlements. The issue of dependence is particularly salient today, when more and more Americans are increasing their reliance on government as they pass into retirement. Some may argue that any measure of government dependence should not include Social Security, because beneficiaries paid payroll taxes into the program before they received benefits. However, the Index is designed to measure spending on federal government programs that have assumed the responsibilities of individuals, families, communities, neighborhood groups, religious institutions, and other civil society institutions. Workers rationally view Social Security taxes as a substitute for private savings.[42] Clearly, Social Security has greatly encroached on the responsibility of individuals for providing their own retirement funds, thus leaving millions of retirees dependent on younger, working generations to fund their retirement.
Current retirees become eligible for Social Security income, as well as for health care benefits from Medicare or Medicaid, at age 65.[43]Each day, 10,000 baby boomers begin to collect these benefits.[44]The three programs, along with the Children’s Health Insurance Program, currently make up 44 percent of all non-interest federal program spending. At the current growth rate, they will make up 57 percent in 2022.[45] By 2048, Social Security, Medicare, and Medicaid will absorb the entire tax revenue of the United States. Any additional spending would have to be borrowed.[46] All told, these programs will enable the government dependence of nearly 80 million baby boomers.
This phenomenon is particularly troubling because most of the soon-to-be users of these programs are middle-class to upper-class Americans who are less likely to need government support. Since eligibility for these programs is linked to age, not financial need, millionaires collect the same benefits, such as subsidized prescription drugs through Medicare Part D, as do low-income and struggling retirees.
Paying for these middle-class and upper-class entitlements in the coming years will require unprecedented levels of deficit spending. Focusing on Social Security and Medicare alone, Americans face $45.9 trillion in unfunded obligations (read: new borrowing) over the next 75 years. That was more than $160,000 per American citizen in 2010—an unsustainable level of debt that is sure to slow the economy and could force even higher rates of taxation in the future. The high costs of these programs, which will be shouldered by the children and grandchildren of baby boomers, could easily lead to further increases in dependence of future generations—which would be more likely to depend on welfare during a slow economy. This snowballing of dependence—caused by automatic reliance on Social Security, Medicare, and Medicaid—could easily send the country past the tipping point of endurable dependence, eroding civil society and endangering the functioning of democracy itself as citizens become dependent on government, instead of the other way around.
Additionally, the growing cost illustrates the budgetary problem of allowing dependence to expand unchecked. One reason this growth will be so significant is that these programs increase on autopilot, which further perpetuates dependence, since these programs are not subject to regular debate and evaluation. Unlike nearly all other federal outlays, Social Security, Medicare, and Medicaid are mandatory spending programs that operate outside the annual budget process. This exemption entitles these programs to call on all federal revenues first, regardless of other budgetary priorities. Substantive policy reform is required if this automatic dependence is to be halted. Part of the solution is to turn these programs into 30-year budgeted programs, subjecting the budgets to debate at least every five years.
Other policy reforms—that emphasize independence and self-reliance—must also be part of addressing the problems inherent in these and other programs. The concept of a safety net ought to be restored to gear Social Security, Medicare, and Medicaid toward those who truly need these programs. This restoration can be accomplished by relating benefits to retirees’ income and encouraging personal savings during working years.
Even though many Members of Congress and other policymakers show great hesitance in reforming these badly broken programs, good reforms that preserve the basic commitments this country has made to its retired and indigent populations do exist. The Heritage Foundation’s Saving the American Dream[47] plan strengthens the anti-poverty elements of these mandatory programs while protecting them from financial ruin. Doing nothing guarantees that seniors one day will find themselves largely without the benefits that currently play such an important part of their retirement plans.
Growth in the Non-Taxpaying Population. The challenges that Congress faces in reforming these entitlement programs are heightened by the rapid growth of other dependence-creating programs, such as subsidies for food and housing and college financial aid, and by the growing number of Americans who incur no obligations for receiving them. How likely is Congress to reform entitlements in any meaningful way under such circumstances? Can Congress rein in the massive middle-class entitlements in an environment of fast-expanding dependence programs?
In 1962, the first year measured in the Index of Dependence on Government, the percentage of people who did not pay federal income taxes themselves and who were not claimed as dependents by someone who did pay federal income taxes stood at 24.0 percent; it fell to 12.6 percent by 1969 before beginning a ragged and ultimately steady increase. By 2000, the percentage was 34.1 percent; by 2010, it was 48.5 percent.[48]Fortunately, this figure dropped to 44.7 percent in 2011. Despite the recent decline, the country is still at a point where nearly one-half of “taxpayers” do not pay federal income taxes,and where most of that same population receives generous federal benefits. (See Chart 1.) This high percentage of people who do not pay the federal income tax persists despite the nation undergoing an economic recovery since the economic collapse during 2008 and 2009.
This trend should concern everyone who supports America’s republican form of government. If the citizens’ representatives are elected by an increasing percentage of voters who pay no income tax, what will be the long-term consequences when these representatives respond more to demands of non-taxpaying voters who urge more spending on entitlements and subsidies than to the pleas of taxpaying voters who urge greater spending prudence?
Instead of encouraging more virtue, such as self-reliance, personal responsibility, and mutual cooperation, dependence on government encourages citizens who pay little taxes to view government as a source of ever expanding benefits, provided by other citizens who pay taxes, without any mutual obligations. Do Americans want a republic that encourages and validates a growing dependence on the state and a withering of civil society? Rejuvenating civil society can help people escape from dependence on government.
Section 1: The Purpose and Theory of the Index
The 2013 Index of Dependence on Government is divided into four major sections. Section 1 explains the purpose of and theory behind the Index; Section 2 features a methodology that describes how the Index is constructed; Section 3 discusses the Index in terms of the number of Americans who receive money from government programs; and Section 4 reviews major policy changes in five federal program areas.
The Index of Dependence on Government is designed to measure the pace at which federal government services and programs have grown in areas once considered to be the responsibility of individuals, families, communities, neighborhood groups, religious institutions, and other civil society institutions. By compiling and condensing these data into a simple annual score (composed of the scores for the five components in Section 4), the Index provides a useful tool for analyzing dependence on government. Policy analysts and political scientists can also use the Index and the patterns it reveals to develop forecasts of trends and consider how these trends might affect the politics of the federal budget.
The Index uses data drawn from a carefully selected set of federally funded programs. The programs were chosen for their propensity to duplicate or replace assistance, such as shelter, food, monetary aid, health care, education, or employment training, which was traditionally provided to people in need by local organizations and families.
In calculating the Index, the expenditures for these programs are weighted to reflect the relative importance of each service (such as shelter, health care, or food). The degree of a person’s dependence will vary with respect to the need. For example, a homeless person’s first need is generally shelter, followed by nourishment, health care, and income. Analysts in The Heritage Foundation’s Center for Data Analysis weighted the program expenditures based on this hierarchy of needs, which produces a weighted index of expenditures centered on the year 1980.
Historically, individuals and local entities have privately provided more assistance to members of society in need than they do today. Particularly during the 20th century, government gradually offered more and more services that were previously provided by self-help and mutual aid organizations.[49] Lower-cost housing is a good example. Mutual aid, religious, and educational organizations long have aided low-income Americans with limited housing assistance; after World War II, the federal and state governments began providing the bulk of low-cost housing. Today, government provides nearly all housing assistance for the poor and low-income.
Health care is another example of this pattern. Before World War II, Americans of modest income typically obtained health care and health insurance through a range of community institutions, some operated by religious institutions and social clubs. That entire health care infrastructure has since been replaced by publicly provided health insurance, largely through Medicaid and Medicare. Regardless of whether the medical and financial results are better today, the relationship between the people who receive health care assistance and those who pay for it has changed fundamentally. Few would dispute that this change has affected the total cost of health care, and the relationships among patients, doctors, and hospitals, negatively.
Financial help for those in need has also changed profoundly. Local, community-based charitable organizations once provided the majority of aid, resulting in a personal relationship between those who received assistance and those who provided it. Today, Social Security and other government programs provide much or all of the income to low-income and indigent households. Nearly all the financial support that was once provided to temporarily unemployed workers by unions, mutual aid societies, and local charities is now provided by federal income, food, and health programs.
This shift from local, community-based, mutual aid assistance to anonymous government payments has clearly altered the relationship between the receiver and the provider of the assistance. In the past, a person in need depended on help from people and organizations in his or her local community. The community representatives were generally aware of the person’s needs and tailored the assistance to meet those needs within the community’s budgetary constraints. Today, housing and other needs are addressed by government employees to whom the person in need is a complete stranger, and who have few or no ties to the community in which the needy person lives.
Both cases of aid involve a dependent relationship. The difference is that support provided by families, religious institutions , and other civil society groups aims to restore a person to full flourishing and personal responsibility, and, ultimately, perhaps to be able to aid another person in turn. The reciprocal relationship is essential to the existence of civil society itself. This kind of reciprocal expectation does not characterize the dependent relationship with the government. Government aid is usually based on one-sided aid without accountability for a person’s regained responsibility for self and toward his community. Indeed, the “success” of such government programs is frequently measured by the program’s growth rather than by whether it helps recipients to escape dependence. While the dependent relationship with civil society leads to a balance between the interests of the person in need and the community, the dependent relationship with the government is inherently prone to generating political pressure from interest groups—such as health care organizations, nonprofit organizations, and the aid recipients themselves—to expand and cement federal support. Perhaps more troubling is the expansion of means-tested safety-net programs, which have the unintended consequence of reducing the rewards to activities that increase one’s market income.[50] The unintended consequence of means-tested programs is that these welfare benefits penalize actions to improve one’s financial situation through one’s own labors. For example, increased working hours translate into increased income, meaning that means-tested assistance participants face decreased assistance if they earn more. Such a quandary can turn into a poverty trap for an individual weighing the “cost” of earning more income at the expense of means-tested assistance. In addition, the programs of the welfare state are likely to create an intergenerational cycle of dependence.
Welfare assistance causes intergenerational dependence because the welfare system generates a culture of dependence in both recipient parents and their children.[51] First, parental welfare participation may encourage children to accept unneeded welfare assistance later in life.[52] Second, parental welfare participation may decrease the employment prospects of the children through multiple avenues.[53] For instance, the lower attachment to work of many welfare-receiving parents may lead their children to be less aware of proper on-the-job behavior. Additionally, such parents may be less able to teach their children job-search skills and provide contacts with those able to provide employment opportunities. Any combination of these factors can significantly inhibit the ability of children to become economically self-sufficient. Third, parental participation may encourage some children to “learn how to ‘play the system’ at an early age.”[54]
A study using data from the PSID found that 20 percent of girls raised in families that were highly dependent[55] on Aid to Families with Dependent Children (AFDC) when the girls were 13 to 15 years old were themselves highly dependent on AFDC between the ages of 21 and 23.[56] The same was true for only 3 percent of girls from non-AFDC-recipient families. However, the results of this study should be interpreted with caution because the study failed to account for other factors that may contribute to participation in AFDC.
An analysis of intergenerational welfare participation based on the National Longitudinal Survey of Youth (NLSY) from 1979 to 1988 provides stronger evidence for welfare assistance causing intergenerational dependence.[57] After controlling for factors that may influence welfare participation, the study found that “exposure to welfare at home increases later offspring dependency.”[58] Specifically, children raised in families participating in AFDC were almost 4.6 times more likely to participate in AFDC during adulthood, compared to the adulthood participation rates of children raised in families never enrolled in AFDC.[59] A similar study using NLSY data found that women raised in households that received welfare were 1.67 to 2.74 times more likely to be dependent on AFDC in adulthood than their counterparts from non-welfare households.[60]
Other studies that account for factors that may influence welfare participation have confirmed an intergenerational link. According to a study based on a random sample of AFDC female recipients from Tennessee, growing up in a family that participated in AFDC was associated with an increased length of time for these women on AFDC in adulthood.[61] An analysis of welfare assistance in Canada found that a 1 percent increase in parental participation during a child’s pre-adult years (ages seven to 17) was associated with a participation rate increase of 0.29 percent during the child’s early adulthood (ages 18 to 21).[62] Converted to a monthly basis, a one-month increase in prior participation by parents is associated with a three-day increase in participation by their children when age 18 to 21.
The Index of Dependence on Government provides a way to assess the magnitude and implications of the change in government dependence in American society. The Index is based principally on historical data from the President’s fiscal year (FY) 2013 annual budget proposal.[63] The last year measured in the 2013 Index is FY 2011. The Center for Data Analysis (CDA) used a simple weighting scheme and inflation adjustment to restate these publicly available data. CDA analysts encourage replication of their work and will gladly provide the data that support this year’s Index upon request to professionals. The steps to prepare this year’s Index are described in the methodology in Section 2.
Section 2: The Methodology
After identifying the government programs that contribute to dependence, the Center for Data Analysis further examined the data to identify the components that contributed to variability. Relatively small programs that required little funding and short-term programs were excluded. The remaining expenditures were summed up on an annual basis for each of the five major categories listed in Table 2.[64] The program titles are those used by the federal Office of Management and Budget (OMB) for budget function and sub-function in the budget accounting system. For federal spending on higher education, U.S. Department of Education appropriations for higher education loans and grants were used instead of OMB data for fiscal years 1980 to 2011 because the CDA analysts determined them to be more accurate, and less prone to accounting technicalities in recent years.[65]
The CDA analysts collected data for FY 1962 through FY 2011. Deflators centered on 2005 were employed to adjust for inflation.
Indices are intended to provide insight into phenomena that are either so detailed or complicated that simplification through chosen but reasonable rules is required for obtaining useful insights. The Consumer Price Index (CPI) of the Bureau of Labor Statistics, for instance, is a series based on a selected “basket of goods” that the bureau surveys periodically for price changes. The components of this basket are weighted to reflect their relative importance to overall price change. Energy prices are weighted as more important than clothing prices. Multiplying the weight by the price produces a weighted price for each element of the CPI, and the total of the weighted prices produces the rough CPI score.
The Index of Dependence on Government generally works the same way. The raw (unweighted) value for each program (that program’s yearly expenditures) is multiplied by the weight reasonably assigned to it by CDA. The total of the weighted values is the Index score for that year.
The Index is calculated using the following weights:
Housing: 30 percent
Health Care and Welfare: 25 percent
Retirement: 20 percent
Higher Education: 15 percent
Rural and Agricultural Services: 10 percent
The same weighting procedure is consistently applied to each annual edition of the Index. The weights are “centered” on the year 1980. This means that the total of the weighted values for the Index components will equal 100 for 1980, and 1980 is the reference year in comparison to which all other Index values can be evaluated as percentages of 100.
The CDA chose the year 1980 due to its apparent significance in American political philosophy. Many analysts view 1980 as a watershed year in U.S. history because it seems to mark the beginning of the decline in left-of-center public policy and the emergence of right-of-center challenges to policies that were based on the belief that social systems fail without the guiding hand of government.[66]
The Index certainly reflects such a watershed. Chart 3 plots the Index from 1962 to 2011. The scores have clearly drifted upward throughout the entire period.
There are two plateaus in the Index—the 1980s and the period from 1995 to 2001—that suggest that policy changes may significantly influence the Index growth rate. During the early 1980s, the growth of some domestic programs was slowed to pay for increased defense spending, and Congress enacted significant policy changes in welfare and public housing during the 1990s. Both of these cutbacks reduced the Index growth rate.
Chart 4 connects the Index to major public policy changes. The largest jump in the Index occurred during the Johnson Administration, following the passage of the Great Society programs. The Johnson Administration not only launched Medicare and other publicly funded health programs, but also vastly expanded the federal role in providing and financing low-income housing. The Index also jumped 90 percent (from 39 to 74) under the Nixon and Ford Administrations, when Republicans were funding and implementing substantial portions of the Great Society programs.
The two periods of relatively less liberal public policy (the 1980s and 1995–2001) stand out clearly in Chart 4. The slowdowns in welfare spending increases during the Reagan years and after the 1994 congressional elections produced two periods of slightly negative change in the Index. These periods saw significant retreats from Great Society methods, particularly in the nation’s approach to welfare, but the return of budget surpluses during the last years of the Clinton Administration led to significant spending increases for all of the components, particularly education and health care. The George W. Bush years saw more leaps in retirement, housing, health, and welfare spending, and since 2009, health care and welfare spending has blasted upward like a rocket. Health care and welfare now stand at four and a third times the 1980 level (inflation-adjusted). With the continuing implementation of Obamacare (the Patient Protection and Affordable Care Act of 2010), the parameters of Chart 4 will most likely have to be expanded again to fit the higher Index number in the years to come.
Section 3: The Five Index Components
CDA analysts began by reviewing the federal budget to identify federal programs and state activities supported by federal appropriations that fit the definition of dependence—providing assistance in areas once considered to be the responsibility of individuals, families, neighborhood groups, religious institutions, and other civil society institutions. The immediate beneficiary of the program or activity must be an individual. This method generally excludes state programs; federally funded programs in which the states act as intermediaries for benefits to individuals are included.
Elementary and secondary education are the principal state-administered programs that are excluded under this stipulation. Post-secondary education is the only part of federal government–funded education included in the Index.[67] Expenditures on the military and federal employees are also excluded. National defense is the primary constitutionally mandated function of the federal government and thus does not promote dependence as measured by the Index. Non-military federal employees are also excluded from the Index based on the fact that these individuals are paid for their labor. In addition, military and federal employees are assumed to possess marketable skills that allow them to find work in the private sector should their federal jobs not exist.
CDA analysts then divided the qualifying programs into five broad components:
Housing
(a) Health Care and (b) Welfare
Retirement
Higher Education
Rural and Agricultural Services
The following sections discuss the pace and content of policy changes in these five components.
1) Housing.[68] The Department of Housing and Urban Development (HUD) was created in 1965 by consolidating several independent federal housing agencies into one executive department. The purpose of the consolidation was to elevate the importance of government housing assistance within the constellation of federal spending programs. At that time it was believed that the destructive riots that broke out in many cities in the early 1960s were a consequence of poor housing conditions and that these conditions were contributing to urban decay.
In any given year, about 80 percent of HUD’s budget is aimed at housing assistance, and the other 20 percent is focused on urban issues by way of the Community Development Block Grant (CDBG) program. Given the nature of these programmatic allocations, HUD budgetary and staff resources are concentrated on low-income households to an extent unmatched by any other federal department.
Within the 80 percent of the HUD budget spent on housing assistance are a series of means-tested housing programs, some of which date back to the Great Depression. Typically, these programs provide low-income people, including the elderly and disabled, with apartments at monthly rents scaled to their incomes. The lower the income, the lower the rent. Traditionally, HUD and the local housing agencies have provided eligible low-income households with “project-based” assistance, an apartment unit that is owned and maintained by the government.
Public housing projects have historically been the most common form of such assistance, but they began to fall out of favor in the 1960s due to the rampant decay and deterioration that followed from concentrating low-income families in a single complex or neighborhood. Periodically, new forms of project-based programs are adopted as “reform,” which also tend to fall out of favor after years of disappointing results. HOPE VI[69] is the most recent form of project-based assistance, and high costs and low benefits led the George W. Bush Administration to attempt, unsuccessfully, to terminate the program in 2006. Efforts are now underway by some in the Obama Administration to increase the program’s funding.
HUD also provides “tenant-based” housing assistance to low-income households in the form of rent vouchers and certificates. These certificates help low-income people rent apartments in the private sector by covering a portion of the rent. The lower the person’s or family’s income, the greater the share of rent covered by the voucher or certificate. Vouchers were implemented in the early 1970s as a cost-effective replacement for public housing and other forms of expensive project-based assistance; vouchers still account for only a portion of housing assistance, in part because of housing-industry resistance to terminating the lucrative project-based programs. However, the unintended consequence of the sliding contribution of vouchers based on income means that the assistance operates with the disincentives of marginal tax rates: Voucher participants face decreased housing assistance if they experience income gains. Such a dilemma can turn into a poverty trap for an individual weighing the “cost” of earning more income at the expense of losing housing assistance.
Finally, HUD provides block grants to cities and communities through the CDBG program according to a needs-based formula. Grant money can be spent at a community’s discretion among a series of permissible options. Among the allowable spending options is additional housing assistance, which many communities use to provide assistance to a greater number of low-income households. Although HUD programs are means-tested to determine eligibility, they are not entitlements. As a result, many eligible households do not receive any housing assistance due to funding limitations. In many communities, housing assistance requires waiting periods of several years—and in some cases local housing authorities no longer add new families to the waiting list because there is simply no foreseeable prospect of new applicants receiving an apartment.
Recognizing that HUD housing assistance can create dependence among those who receive its benefits, some Members of Congress have attempted to extend the work requirements of the 1996 Personal Responsibility and Work Opportunity Reconciliation Act (PRWOR) to HUD programs. Self-described advocates for the poor have thwarted these efforts. To date, the most that can be required of a HUD program beneficiary is eight hours per month of volunteer service to the community or housing project in which the beneficiary lives.
After a mid-decade jump reflecting spending to rebuild infrastructure destroyed by Hurricanes Katrina and Rita, the housing component of the Index moderated, but in 2008 it jumped significantly as the federal government added several mortgage-bailout programs to its traditional low-income, housing-assistance focus.
The Federal Housing Finance Agency (FHFA) took over the supervision of operations of Fannie Mae and Freddie Mac on July 24, 2008, as part of the Housing and Economic Recovery Act (HERA). The federal government provides direct financing to the mortgage market through Fannie Mae and Freddie Mac due to HERA. The net loss to the federal government from November 2008 to the end of March 2011 totaled $130 billion ($154 billion minus $24 billion in dividends on the agencies’ respective preferred stock). Moreover, any agency debt issued by Fannie Mae and Freddie Mac is not considered official government debt, and, therefore, is not included in the accounting of federal publicly held debt.
The change in agency status is important since Fannie Mae and Freddie Mac directly hold purchased mortgages and issue mortgage-backed securities (MBS). Their role in the single-family residential mortgage market is substantial. Fannie Mae and Freddie Mac guarantee approximately half of outstanding U.S. mortgages,[70] and they finance more than 70 percent of all single-family residential mortgages.[71]
In the past two years, under the Obama Administration, there have been incremental steps to extend help to homeowners. The Administration established two broad programs to help U.S. homeowners through the Making Home Affordable (MHA) initiative[72]—the Home Affordable Modification Program (HAMP) and the Home Affordable Refinancing Program (HARP).[73]
These programs go beyond extending federal government support to low-income Americans. The HAMP program uses Troubled Asset Relief Program (TARP) funds to reduce the burden of mortgage-related debt service from homeowners at risk of foreclosure. These are targeted homeowners that took a sub-prime or alternative high-risk mortgage, and are paying more than 31 percent of their household income on their primary mortgage.[74] HARP, however, extends federal support in housing to many moderate-income and upper-middle-income households[75] by allowing eligible homeowners to refinance their mortgage at historically low interest rates and to change their term structure on loans. All mortgages refinanced under HARP are either owned or underwritten by Fannie Mae or Freddie Mac.
2(a) Health Care.[76]Increasing spending and enrollment in public health care programs, and particularly Medicare, Medicaid, and the Children’s Health Insurance Program (CHIP), is leading to greater dependence on government. In 2011, total combined enrollment in these three programs was nearly 109 million individuals—approximately 32 percent of the entire U.S. population.[77] The three programs accounted for $999 billion, or 6.6 percent of GDP.[78] According to the Centers for Medicare and Medicaid Services (CMS), by 2021, government spending on health care will represent nearly 50 percent of total national health expenditures.[79]
In its 2011 annual report on health insurance coverage, the U.S. Census Bureau published figures that underscore the current trend toward greater dependence on government health programs.[80]The percentage of Americans enrolled in government health programs is rising faster than ever, in part due to a struggling economy, Medicaid and CHIP expansions, and a rapidly growing elderly population transitioning into Medicare. The consequence is greater dependence on taxpayer-subsidized coverage.
Medicare. Congress established Medicare in 1965 through Title XVIII of the Social Security Act. Medicare pays for health care for individuals ages 65 and above, and for those with certain disabilities. Medicare enrollment has steadily increased since its enactment due to increases in both population and individual life expectancy. In 1970, 20.4 million individuals were enrolled in Medicare.[81] By 2011, the number of enrollees had more than doubled to 48.7 million.[82]In 2011, the first of 81.5 million baby boomers became eligible for Medicare, leading to an expected dramatic increase in enrollment over the next 10 years.[83]
The heavily taxpayer-subsidized Medicare coverage increases overall demand for health care and places upward pressure on health care pricing. Medicare fee-for-service is the primary source of coverage for beneficiaries. However, traditional Medicare’s fee-for-service structure adds to rising costs by rewarding providers for higher volumes of services. Moreover, gaps in coverage lead 90 percent of enrollees to carry supplemental plans, such as employer-provided retiree coverage, Medigap plans, or Medicaid.[84] By design, supplemental policies shield seniors from the financial effects of their health care decisions.
Growing enrollment and rising spending are quickly leading Medicare to become an unsustainable program. Under current law, the program faces $26.9 trillion in long-term unfunded obligations; under an alternative, more plausible, scenario, the estimate reaches $36.9 trillion over the long term.[85] Medicare Part A is already running yearly deficits, and according to the Trustees, the Hospital Insurance Trust Fund will become insolvent in 2024. Between 1985 and 2011, gross federal spending for Medicare rose from 1.7 percent of GDP to 3.7 percent, and under the CBO’s extended alternative fiscal scenario, gross federal spending on Medicare will reach 6.7 percent of GDP by 2037.[86]
The last decade has seen a significant expansion of benefits provided by Medicare, including the addition of a prescription drug benefit (Medicare Part D). From 2004 to 2011, Part D was responsible for $337.9 billion in spending.[87] Though the role of competition in its defined-contribution financing model has caused its costs during this period to be 48 percent lower than initial CMS projections, the program has added substantially to health care entitlement spending.[88] Additionally, the publicly funded Part D program has crowded out private coverage alternatives. Research suggests that before Medicare Part D was enacted, 75 percent of seniors currently receiving public coverage held private drug coverage. Part D also increased average spending on prescription drugs by seniors, an expense that is funded by an increase in public spending of 184 percent, accompanied by a reduction in seniors’ out-of-pocket spending of 39 percent and private insurance plan spending of 37 percent.[89]
Medicaid and CHIP. Medicaid, the joint federal–state health care program for specific categories of the poor, was also established in 1965, through Title XIX of the Social Security Act. In 2011, 56.1 million Americans were enrolled in Medicaid, an increase of 2.2 million individuals in just one year, and 21.6 million since 2000.[90] Medicaid serves a diverse population of the poor, including children, mothers, the elderly, and the disabled. Combined, the total national cost of Medicaid and CHIP in 2011 is estimated at $441 billion, and is projected to rise to $963 billion by 2021.[91]
The generous, open-ended federal reimbursement that states receive for Medicaid spending encourages many states to grow the program beyond what could be expected if state taxpayers funded the full cost. The structure of the Medicaid program varies from state to state because states determine their own eligibility and benefit levels after meeting a minimum federal standard. States have used this flexibility to expand eligibility and benefit packages. Indeed, past research has shown that a majority of Medicaid expenditures are for optional services or groups.[92]
Incremental Medicaid expansions and the addition of CHIP[93]have increased the number of individuals eligible for government health programs. CHIP has led many working families who would otherwise enroll their children in private coverage to opt for public coverage. The CBO concluded that private coverage crowd-out from CHIP expansions ranges from 25 percent to 50 percent.[94] In 2011, 5.7 million children were enrolled in CHIP—an increase of 300,000 children from the year before, and 3.7 million from 2000.[95]
Impact of Obamacare. The Patient Protection and Affordable Care Act (PPACA), enacted in 2010, relies on a massive expansion in Medicaid and the creation of a new income-related subsidy to purchase insurance through government-controlled insurance exchanges.
The most recent CBO estimate projects that, by 2022, 25 million individuals will receive subsidized coverage in the new exchanges.[96]CMS originally estimated that over 20 million additional Americans would be enrolled in Medicaid and CHIP by 2019 due to the PPACA.[97] However, the CBO has an updated estimate that reflects the recent June 2012 Supreme Court decision, which made the Medicaid expansion optional for states, causing a smaller amount of additional Medicaid enrollees—11 million in 2022.
These new provisions are projected to cost the federal government nearly $1.7 trillion between 2012 and 2022. To reduce the impact on the federal deficit, the PPACA depends on a variety of offsetting provisions, including an estimated $716 billion from Medicare.[98] Thus, instead of extending Medicare’s solvency, these reductions were used to fund the new spending provisions. Moreover, both the CMS Actuary and the CBO warn that much of these Medicare spending reductions are unlikely to materialize due to the effects they will have on health care providers’ profitability, and subsequently, seniors’ access to care.[99]
Conclusion. The growing dependence on government health programs, the result of recently enacted legislation, and other factors will have a direct negative impact on federal and state taxpayers. Spending on Medicare and Medicaid, two of the largest entitlement programs, is on track to well surpass current levels. By 2021, Medicare spending is expected to surpass $1 trillion, and total spending (federal and state) for Medicaid and CHIP will reach $963 billion, with exchange spending totaling $136 billion, at which point government spending will represent nearly half of all health care expenditures.[100]
2(b) Welfare.[101]The 1996 Welfare Reform Act (PRWORA) replaced the decades-long Aid to Families with Dependent Children (AFDC)—which entitled recipients to unconditional benefits—with the Temporary Assistance for Needy Families (TANF) program. Enacted during the Great Depression, AFDC, an old cash-welfare program, was intended to provide financial assistance to children in need. Over the decades, the program swelled and added adults, such as unemployed parents of enrolled children. Welfare rolls peaked in 1994, reaching more than 5 million cases—14.2 million individual recipients. Before welfare reform, one child in seven received AFDC.
An open-ended assistance program, AFDC granted states more money as their welfare rolls continued to increase. At the individual level, AFDC handed out benefits without any expectations from the recipients, who were entitled to cash aid as long as they fell below the need standards set by the states. The entitlement created perverse incentives—discouraging work among able-bodied adults and discouraging marriage.
Welfare reform effectively altered the fundamental premise of receiving public aid and ended it as an entitlement. Receiving assistance became temporary and tied to demonstrable efforts by able-bodied adult recipients to find work or take part in work-related activities. Self-sufficiency became the goal. The successes of welfare reform are undeniable. Between August 1996 and December 2011, welfare caseloads declined by 59.1 percent—from 4.4 million families to 1.8 million families. The legislation also reduced child poverty by 1.6 million children.[102]
The initial years after welfare reform brought significant progress. By the late 1990s, most states had met the PRWORA’s work goals, and motivation to reduce dependence and encourage work among recipients even more began to wane. The national TANF caseload has flatlined in the past few years, and the percentage of TANF families with work-eligible adults who worked at least 30 hours per week (20 hours for those with young children) never rose above the 38.3 percent attained in 1999, and has hovered near 30 percent in recent years.
In February 2006, after four years of debate, Congress reauthorized TANF under the Deficit Reduction Act. The new legislation reiterated the need to engage recipients in acceptable work activities and promote self-sufficiency. Once again, states were required to increase work participation and to reduce their welfare caseloads, using the lower 2005 caseload levels as the new baseline—which essentially restarted the 1996 reform. As required by Congress, the Department of Health and Human Services also issued new regulations to strengthen work-participation standards.
The 2006 TANF reauthorization also contained a notable measure that began to rectify the inattention to the other two 1996 welfare reform goals: reducing unwed childbearing and restoring stable family formation.[103] The erosion of marriage and family is a primary contributing factor to child poverty and welfare dependence, and it figures significantly in a host of social problems. A child born outside marriage is nearly six times more likely to be poor than a child raised by married parents, and more than 80 percent of long-term child poverty occurs in single-parent homes. Moreover, unwed parents and the absence of fathers in the home negatively affects a child’s development, educational achievement, and psychological well-being, as well as increases children’s propensity toward delinquency and substance abuse.[104]
For the past four decades, the unwed birth rate in America has been rising steadily, from 5.3 percent in 1960 to 40.7 percent in 2011.[105] Among blacks, 72.3 percent of children born in 2011 were to unmarried parents; among Hispanics, the percentage was 53.3 percent.[106] The percentage among whites was 29.0 percent.[107] Although the pace of growth in the proportions of births to unmarried women slowed in the immediate years after welfare reform, more recently, it has risen rapidly. From 2002 to 2009, the share of non-marital births increased by one-fifth—34.0 percent to 41.0 percent.[108] Since then, the share of non-marital births appears to have leveled off at 40.8 percent and 40.7 percent in 2010 and 2011, respectively.[109]
In 2011, 1.6 million children were born to unmarried parents.[110] Contrary to popular belief, the typical single mother is not a teenager, but in her twenties. Whereas in 1970 one-half of all out-of-wedlock births were to teens, in 2011 births to girls younger than 18 years of age comprised only 5.9 percent of such births.[111] Almost 61 percent of out-of-wedlock births are to women in their twenties.[112]About 49 percent are high-school dropouts, and 34 percent are high-school graduates. Fourteen percent have had some college education; only 2 percent have a college degree.[113] Tragically, the Obama Administration seems bent on derailing the successful 1996 welfare reforms. In July 2012, the Administration’s Department of Health and Human Services announced that it would allow states to waive the work requirement, the heart of the reform law. The Administration’s policy threatens the success of the law in helping those in need attain self-sufficiency.
Welfare reform should be restored. Additionally, comprehensive welfare reform of the federal government’s many other welfare programs is needed. Today’s welfare system is a convoluted machinery of 80 programs, 13 federal departments, and a voluminous collection of state agencies and programs. Overall, the welfare system amounts to over $900 billion in spending per year.[114]
Since President Lyndon Johnson declared the War on Poverty in 1964, the federal government has spent approximately $20 trillion on means-tested welfare aid. Today, means-tested assistance is the fastest-growing part of government, with the nation spending more on welfare than on national defense. Under the Obama Administration, welfare spending has increased dramatically. For example, since FY 2008, spending on the Supplemental Nutrition Assistance Program (SNAP), formerly the Food Stamp program, more than doubled from $37.6 billion to $78.4 billion for FY 2012.[115] The tremendous growth in the SNAP budget means that more and more Americans are dependent on the program. In 1969, 1.4 percent of the population or about 2.9 million people participated in the program.[116] By 2008, the participation rate increased to 9.3 percent of the population with 28.2 million individuals receiving benefits. In 2011, 44.7 million people (14.3 percent of the population) participated in the program. (See Chart 12.) The figure for FY 2012 is 14.8 percent—meaning that one of every 6.7 people in the nation is participating in the program. Over the next 10 years, total welfare spending is expected to cost taxpayers $12.7 trillion.The Obama Administration has worked rapidly to expand the welfare state further.[117]Such growth is clearly unsustainable.
The 1996 Welfare Reform Act was the first phase of meaningful welfare reform. The work requirements in this law must be restored and strengthened. The next phase of welfare reform should focus on the following: First, since means-tested welfare spending goes to more than 80 federal programs, Congress should require the President’s annual budget to detail current and future aggregate federal means-tested spending. The budget should also provide estimates of state contributions to federal welfare programs. Second, continuing reform should rein in the explosive growth in spending. When the unemployment rate returns to the historically normal level of approximately 5 percent, aggregate welfare funding should be capped at pre-recession (FY 2007) levels plus inflation. Third, building on the successful 1996 model, further reform should continue to promote personal responsibility by encouraging work. For example, SNAP, one of the largest means-tested programs, should be restructured to require able-bodied adult recipients to work or prepare to work, in order to be eligible for food stamps.[118]
3) Retirement.[119]Since the time of President Franklin D. Roosevelt, the American retirement system has been described as a three-legged stool consisting of Social Security, employment-based pensions, and personal retirement savings. The reality is quite different. Almost half of American workers (about 78 million) are employed by companies that do not offer any type of pension or retirement savings plan. This proportion of employer-based retirement savings coverage has remained roughly stable for many years, and experience has shown that few workers can save enough for retirement without such a payroll-deduction savings plan. For workers without a pension plan, the reality of their retirement consists almost entirely of Social Security.
Since 1935, Social Security has provided a significant proportion of most Americans’ retirement incomes. The program pays a monthly check to retired workers, and monthly benefits to surviving spouses and children under the age of 18.[120] Monthly benefits are based on the indexed average of a worker’s monthly income over a 35-year period, with lower-income workers receiving proportionately higher payments and higher-income workers receiving proportionately less. The lowest-income workers receive about 70 percent of their pre-retirement income; average-income workers receive 40 percent to 45 percent; and upper-income workers average about 23 percent.
However, the demographic forces that once made Social Security affordable have reversed, and the program is on an inexorable course toward fiscal crisis. To break even, Social Security needs at least 2.9 workers to pay taxes for each retiree who receives benefits. The current ratio is 3.3 workers per retiree and dropping because the baby boomers produced fewer children than their parents did and have begun to reach retirement. The ratio will reach 2.9 workers per retiree around 2015 and drop to two workers per retiree in the 2030s.
Current retiree benefits are paid from the payroll taxes collected from today’s workers. Social Security has not collected enough taxes to pay for all its promised benefits since 2010. Both the Social Security Administration and the CBO say that these deficits are permanent.
Between 1983 and 2009, workers paid more in payroll taxes than the Social Security program needed in order to pay benefits. These additional taxes were supposed to be retained to help finance retirement benefits for baby boomers. But the government did not save or invest the excess taxes for the future. Instead, the government used the money to finance other government programs. In return for the diverted revenue, Social Security’s trust fund received special-issue U.S. Treasury bonds. Now that Social Security has begun to spend the interest that is accumulating on those Treasury bonds and will soon begin to redeem them, the federal government will be required to raise the money through higher taxes or massive borrowing.
Social Security’s uncertain future is a problem for all workers, and especially for roughly half the American workforce that has no other retirement program. Few of these Americans have any significant savings, and unless the situation improves, they will depend heavily on the government for their retirement incomes.
This dependence is largely the result of government policies. By soaking up money that should have been invested for the future, Social Security’s high tax rate makes it much harder for lower-income and moderate-income workers to accumulate any substantial savings. Workers logically view Social Security taxes as a substitute for private savings—the problem is that the government is spending, rather than saving that money, and the complexity of the program, along with its long-term fiscal insolvency, prevents workers from knowing precisely what they will receive in return for their Social Security taxes.[121]
Additionally, Social Security reduces private savings by relieving people of the responsibility for factors such as securing assets to last into very old age or to pay for medical treatments not covered by insurance. If Social Security did not provide a guaranteed lifetime benefit, people would have to increase their private savings to provide for a longer retirement. And, the Supplemental Security Insurance (SSI) component of Social Security, which provides additional income and medical benefits to individuals who run out of private savings, discourages lower-income workers from saving money that could prevent them from receiving additional government assistance.[122]
Complex government regulations also discourage the expansion of occupational pensions to cover a higher proportion of the workforce. Over the past few decades, the costs of traditional pension plans have skyrocketed, and thousands of them have shut down. Efforts to develop innovative hybrid pension plans stalled when confusing laws and regulations resulted in lawsuits.
4) Higher Education.[123]Federal post-secondary education spending continues to grow at a rapid pace. During the 2011–2012 school year, total federal spending on student aid programs (including tax credits and deductions, grants, and loans) was approximately $236.7 billion—making total federal aid 218 percent higher than for the 2001–2002 school year (total inflation-adjusted federal aid totaled $108.6 billion that year).[124] In the 2010–2011 school year, federal grant aid increased to $50.3 billion, a 2.7 percent increase over the previous year (Pell Grants: $34.5 billion; other federal grants: $14.8 billion; Work Study: $1 billion).[125] Between 2000 and 2011, inflation-adjusted Pell Grant funding grew 191 percent.[126] Notably, federal intervention into the student lending market has also continued to grow. The U.S. Department of Education notes that “as of July 1, 2010, all Subsidized and Unsubsidized Stafford Loans, PLUS, and Consolidation Loans are originated in the Direct Loan (DL) program.”[127]
The data in Chart 11 is limited to spending expressed in 2005 dollars, so tax credits, deductions, and loan liabilities are not included. As the chart shows, higher education spending steadily increased since 1962. Higher education increased from $1.8 billion in 1962 to $40.9 billion in 2011—an increase of a staggering 2,172 percent.
Over the past decade, growing federal higher-education subsidies have increased the number and percentage of post-secondary students who depend on government aid. In the 2011–2012 school year, 9.4 million students received Pell Grant scholarships—more than double the number of students who received Pell Grants in the 2001–2002 school year.[128]The maximum Pell Grant award rose to $5,550 during the 2011–2012 school year.[129] Moreover, during the 2007–2008 school year (the most recent data available), 47 percent of students received federal student aid (including both grants and loans).[130]Federal borrowing through the Stafford loan program grew to 10.4 million loans from just 5.4 million loans during the 2001–2002 school year, a 95 percent increase.[131]
Both federal spending and students’ dependence on government are likely to continue to rise in 2013. In seeking to make the United States the country with “the highest proportion of college graduates in the world by 2020,” President Obama has pushed for significant increases in federal subsidies.[132] The President’s 2013 budget request increases funding for federal grants, loans, and work-study programs to $165 billion—a 69 percent increase since 2008.[133]Moreover, “the administration’s budget would provide a record $36.1 billion in Pell Grants to nearly 10 million students during the 2013–2014 award year.”[134]
Increases in federal student aid subsidies over the years have done nothing to mitigate ever-rising college costs. Tuition and fees at private and public four-year institutions rose by 13 percent and 27 percent, respectively, after adjusting for inflation, from the 2007–2008 academic year to the 2012–2013 academic year.[135] In the decade from 2002 to 2012, tuition and fees rose by an average annual rate of 5.2 percent at public universities.[136]Since 1982, the cost of college tuition and fees has increased by 439 percent—more than four times the rate of inflation.[137]
Decades-long increases in federal subsidies for college have led to increases in college tuition and fees because universities know that more aid makes students less sensitive to rising college costs. Economist Richard Vedder argues that “some of these [federal] financial aid programs have contributed mightily to the explosion in tuition and fees in modern times.”[138] Vedder also notes that it “is not clear that higher education has major positive spillover effects that justify government subsidies in the first place, and the private loan market that can handle anything from automobile loans to billion-dollar government bond sales can handle financial assistance to students if necessary.”[139]
Instead of continuing to expand the government’s role in student lending, federal subsidies should be limited to those students with the greatest financial need. Limiting the number of years that students are able to receive federal subsidies would also likely begin to tackle the college cost problem.[140]
5) Rural and Agricultural Services.[141] Government dependence in the rural and agriculture sector is largely driven by farm subsidies. Direct payments are designed to supplement farm income; production quotas inflate crop prices; and premium subsidies offset the cost of crop insurance. The government also pays farmers to adopt conservation methods, and provides export subsidies that enable them to undercut commodity prices overseas.[142]
Supporters of farm subsidies often characterize farmers as particularly vulnerable to both natural and economic forces. But risk exists in all types of commercial endeavors, and there are a host of nongovernmental methods with which farmers themselves can manage risk, including crop diversification, credit reserves, and private insurance.
In fact, American farmers are doing quite well. Net farm income hit a record $117.9 billion in 2011, and is forecast by the U.S. Department of Agriculture (USDA) to reach $128.2 billion in 2013—the highest level on record in four decades.[143] Chart 12 shows that average farm-household income began to eclipse the average of all U.S. households in 1996, and remains so (despite the fact that most farm-household income is derived from off-farm sources).[144]
Meanwhile, the top five earnings years during the past three decades have all occurred since 2004.[145]The debt-to-asset ratio[146] for 2012 is pegged at just 10.3 percent,[147] meaning that debt is only about one-tenth of total assets—the strongest position in some 40 years, due largely to rising land values.[148]Farm subsidies are higher now than in the early 1990s, when farm-household income and that of the rest of America were roughly equal.
Farm subsidies, commodity quotas, and tariffs largely enrich upper-income producers of grains, oilseeds, cotton, milk, and sugar, and ignore most other commodities. Nearly 80 percent of farms with gross cash farm income of $250,000 to $999,999 receive government payments, compared to 24 percent of farms with gross cash farm income of $10,000 to $249,999.
Instead of payments based on need, farm subsidies are largely based on the type of crops grown, and the volume produced over time. Because yield has long been a primary factor in the allocation of subsidies, bigger farms receive a larger proportion of the payments. Since the operators of bigger farms tend to have higher household incomes than their smaller counterparts, subsidies have shifted to higher income households.
This is where the rationale for farm subsidies falls apart. Large farms are generally more viable than small farms by virtue of economies of scale and access to technology.[149] Large farms can afford more sophisticated machinery and can take advantage of the latest scientific advances—both of which allow operators to manage more acreage and increase yields. To the extent that taxpayers absorb the costs of farming, farmers are less likely to optimize efficiency or minimize risk.
In 1996, Congress appeared to acknowledge the failures of centrally planned agriculture. That year’s Federal Agricultural Improvement and Reform Act[150](also known as the Freedom to Farm Act) was designed to phase out farm subsidies by 2002 and allow the agricultural sector to operate as a free market. After spending just $6.2 billion on what is called farm “income stabilization” in 1997—half the amount that was spent in 1992—Congress overreacted to a temporary dip in crop prices in 1998 (resulting from the Asian economic slowdown) by passing the first in a series of annual emergency bailouts for farmers.
By 2000, farm income stabilization spending hit a record $33.4 billion. Farmers quickly grew accustomed to massive government subsidies, and competition for the farm vote induced a bipartisan bidding war on the eve of the 2002 elections. That same year, lawmakers gave up on reform and enacted the largest farm bill in American history, projected to cost at least $180 billion over the following decade. Despite escalating costs and negative economic effects, farm subsidization continued to be the overwhelming preference of Congress and the White House.
Rather than fix this broken system, the 2008 farm bill made it worse.[151] Congress repealed key limits on the subsidies a farmer may receive, thereby ignoring President George W. Bush’s call to subsidize only those farmers who earn less than $200,000 a year, which would have effectively ended subsidies for corporate farms. The bill created a permanent new disaster program, increased subsidy rates, and used gimmicks to cover up a spending increase of approximately $25 billion over 10 years. Even corn farmers, who already benefit from soaring prices resulting from federal ethanol policies, continued to receive billions in annual subsidies.
With the national debt above $16 trillion, lawmakers are finally considering cuts to some farm subsidies. For example, the House and Senate have passed farm bills that would repeal a set of wasteful and antiquated commodity programs. Unfortunately, they would supplant those cuts with new subsidy programs, dubbed “shallow loss” and “target price” programs.[152] A shallow loss program protects farmers from even minor (shallow) losses, effectively removing virtually all risk from farming. In the Senate, farmers would be guaranteed protection for up to 88 percent of their revenue; in the House it would be 85 percent of the revenue. Since the cost of the shallow loss programs is based on an average of commodity prices from the previous five years, the numbers could skyrocket if prices are higher than expected. For both bills, the Congressional Budget Office assumed that commodity prices would stay at or near record highs. If the prices return to long-term averages, taxpayers could pay far more than what is projected.[153]
A target price program sets a specific price in law. If a commodity price falls below that level, farmers of the specific commodity receive a payment. In the House bill particularly, the target prices have been set so high that payments for some commodities would likely be guaranteed, such as payments to peanut farmers.
Not surprisingly, decades of farm subsidies have created an entitlement mentality among a class of farmers who have significant influence in Congress. Prospects for reform also are stymied by the sprawling scope of previous farm bills, which have encompassed food stamps, child nutrition, forestry, telecommunications, energy, and rural development. This concentration of special interests constitutes a powerful force for the status quo.
Major reforms are sorely needed to reduce farmers’ unnecessary dependence on taxpayers. First and foremost, lawmakers must separate the food stamp program from the agriculture-related programs of the farm bill so that reform is a possibility. Nearly 80 percent of the farm bill is composed of food stamps, making it really the “food stamp bill.” These distinct programs are combined solely for political reasons in order to get them passed. If the programs are separated, lawmakers could have the chance to consider each of these programs on its own merits. Thereafter, Congress can move toward elimination of numerous subsidies, placing restrictions on eligibility, and imposing income limits and subsidy caps.
Conclusion
Public policy decisions can alter the fabric of society. Changes in the Index of Dependence on Government are clearly traceable to public policy decisions that expanded or constricted the reach of government. The rapid increase in the 1960s and 1970s corresponds with a new commitment by the federal government to solve local social and economic problems, which had previously been the responsibility of local governments, civil society organizations, communities, and families. Both the number of government employees and people covered by government programs surged in the wake of the War on Poverty.
The 1980s and 1990s generally witnessed much slower growth in the Index as public policy emphasized reining in the size and influence of government. Unfortunately, the first decade of the new millennium was a different story: The Index resumed the growth rates attained during the era of big government and they are now growing even faster.
Americans should be concerned about this relentless upward march in Index scores. Dependence on the federal government for life’s many challenges strips civil society of its historical—and necessary—role in providing aid and renewal through the intimate relationships of family, community, and local institutions and local governments. While the Index does not measure the decay of civil society, it reflects an increase in the size and scope of government with a concurrent displacement of the institutions of civil society.
Today, the growth of government spending is of particular concern as the retirement of the baby-boomer generation has caused sharp increases in government spending. At the same time, the tax code has become a morass of tax credits and deductions that remove millions of Americans from the tax rolls, insulating them from the cost of government.
Perhaps the greatest danger is that the swelling ranks of Americans who enjoy government services and benefits for which they pay few or no taxes will lead to a spreading sense of entitlement that is simply incompatible with self-government. Americans have reached a point in the life of their republic at which the democratic political process has become a means for many voters to defend and expand the “benefits” they receive from government. Do Americans want a republic that encourages and validates a growing dependence on the state and a withering of civil society? Do Americans want sharp class lines drawn between those who receive government largesse and those who pay for it? These are questions increasingly in need of urgent answers. How Americans answer them may well determine the ultimate fate of their political system—and of their society.
It is not too late: The individual genius of Americans, acting through their civil society institutions, can still steer the nation from its present disastrous course. Civil society is not dead today. While government programs have crowded out civil society, Americans do not have to look far beyond their own neighborhoods to find fellow citizens voluntarily helping each other in times of need. Such noble examples should inspire Americans to shed their dependence on government programs that breed a sense of entitlement without any responsibility. The alternative—nurturing family and community relationships that foster voluntary mutual assistance—will help restore civil society as a strong pillar of American exceptionalism.
About the Authors
David B. Muhlhausen, PhD, is Research Fellow in Empirical Policy Analysis in the Center for Data Analysis at The Heritage Foundation.
Patrick D. Tyrrell is Research Coordinator in the Center for Data Analysis.
The former Director of the Center for Data Analysis, William Beach, made a substantial contribution to this report. Former Heritage Foundation policy expert David C. John and current Heritage Foundation policy experts Daren Bakst, Diane Katz, Lindsey Burke, Alyene Senger, Rachel Sheffield, and John Ligon contributed significantly to the 2013 Index.
America waits with bated breath while Washington struggles to bring the U.S. economy back from the brink of disaster. But many of those same politicians caused the crisis, and if left to their own devices will do so again.
Despite the mass media news blackout, a series of books, talk radio and the blogosphere have managed to expose Barack Obama’s connections to his radical mentors — Weather Underground bombers William Ayers and Bernardine Dohrn, Communist Party member Frank Marshall Davis and others. David Horowitz and his Discover the Networks.org have also contributed a wealth of information and have noted Obama’s radical connections since the beginning.
Yet, no one to my knowledge has yet connected all the dots between Barack Obama and the Radical Left. When seen together, the influences on Obama’s life comprise a who’s who of the radical leftist movement, and it becomes painfully apparent that not only is Obama a willing participant in that movement, he has spent most of his adult life deeply immersed in it.
But even this doesn’t fully describe the extreme nature of this candidate. He can be tied directly to a malevolent overarching strategy that has motivated many, if not all, of the most destructive radical leftist organizations in the United States since the 1960s.
The Cloward-Piven Strategy of Orchestrated Crisis
In an earlier post, I noted the liberal record of unmitigated legislative disasters, the latest of which is now being played out in the financial markets before our eyes. Before the 1994 Republican takeover, Democrats had sixty years of virtually unbroken power in Congress – with substantial majorities most of the time. Can a group of smart people, studying issue after issue for years on end, with virtually unlimited resources at their command, not come up with a single policy that works? Why are they chronically incapable?
Why?
One of two things must be true. Either the Democrats are unfathomable idiots, who ignorantly pursue ever more destructive policies despite decades of contrary evidence, or they understand the consequences of their actions and relentlessly carry on anyway because they somehow benefit.
I submit to you they understand the consequences. For many it is simply a practical matter of eliciting votes from a targeted constituency at taxpayer expense; we lose a little, they gain a lot, and the politician keeps his job. But for others, the goal is more malevolent – the failure is deliberate. Don’t laugh. This method not only has its proponents, it has a name: the Cloward-Piven Strategy. It describes their agenda, tactics, and long-term strategy.
The Strategy was first elucidated in the May 2, 1966 issue of The Nation magazine by a pair of radical socialist Columbia University professors, Richard Andrew Cloward and Frances Fox Piven. David Horowitz summarizes it as:
The strategy of forcing political change through orchestrated crisis. The “Cloward-Piven Strategy” seeks to hasten the fall of capitalism by overloading the government bureaucracy with a flood of impossible demands, thus pushing society into crisis and economic collapse.
Cloward and Piven were inspired by radical organizer [and Hillary Clinton mentor] Saul Alinsky:
“Make the enemy live up to their (sic) own book of rules,” Alinsky wrote in his 1989 book Rules for Radicals. When pressed to honor every word of every law and statute, every Judeo-Christian moral tenet, and every implicit promise of the liberal social contract, human agencies inevitably fall short. The system’s failure to “live up” to its rule book can then be used to discredit it altogether, and to replace the capitalist “rule book” with a socialist one. (Courtesy Discover the Networks.org)
Their strategy to create political, financial, and social chaos that would result in revolution blended Alinsky concepts with their more aggressive efforts at bringing about a change in U.S. government. To achieve their revolutionary change, Cloward and Piven sought to use a cadre of aggressive organizers assisted by friendly news media to force a re-distribution of the nation’s wealth.
In their Nation article, Cloward and Piven were specific about the kind of “crisis” they were trying to create:
By crisis, we mean a publicly visible disruption in some institutional sphere. Crisis can occur spontaneously (e.g., riots) or as the intended result of tactics of demonstration and protest which either generate institutional disruption or bring unrecognized disruption to public attention.
No matter where the strategy is implemented, it shares the following features:
The offensive organizes previously unorganized groups eligible for government benefits but not currently receiving all they can.
The offensive seeks to identify new beneficiaries and/or create new benefits.
The overarching aim is always to impose new stresses on target systems, with the ultimate goal of forcing their collapse.
Capitalizing on the racial unrest of the 1960s, Cloward and Piven saw the welfare system as their first target. They enlisted radical black activist George Wiley, who created the National Welfare Reform Organization (NWRO) to implement the strategy. Wiley hired militant foot soldiers to storm welfare offices around the country, violently demanding their “rights.” According to a City Journal article bySol Stern, welfare rolls increased from 4.3 million to 10.8 million by the mid-1970s as a result, and in New York City, where the strategy had been particularly successful, “one person was on the welfare rolls… for every two working in the city’s private economy.”
The movement’s impact on New York City was jolting: welfare caseloads, already climbing 12 percent a year in the early sixties, rose by 50 percent during Lindsay’s first two years; spending doubled… The city had 150,000 welfare cases in 1960; a decade later it had 1.5 million.
The vast expansion of welfare in New York City that came of the NWRO’s Cloward-Piven tactics sent the city into bankruptcy in 1975. Rudy Giuliani citedCloward and Piven by name as being responsible for “an effort at economic sabotage.” He also credited Cloward-Piven with changing the cultural attitude toward welfare from that of a temporary expedient to a lifetime entitlement, an attitude which in-and-of-itself has caused perhaps the greatest damage of all.
Cloward and Piven looked at this strategy as a gold mine of opportunity. Within the newly organized groups, each offensive would find an ample pool of foot soldier recruits willing to advance its radical agenda at little or no pay, and expand its base of reliable voters, legal or otherwise. The radicals’ threatening tactics also would accrue an intimidating reputation, providing a wealth of opportunities for extorting monetary and other concessions from the target organizations. In the meantime, successful offensives would create an ever increasing drag on society. As they gleefully observed:
Moreover, this kind of mass influence is cumulative because benefits are continuous. Once eligibility for basic food and rent grants is established, the drain on local resources persists indefinitely.
The next time you drive through one of the many blighted neighborhoods in our cities, or read of the astronomical crime, drug addiction, and out-of-wedlock birth rates, or consider the failed schools, strapped police and fire resources of every major city, remember Cloward and Piven’s thrill that “…the drain on local resources persists indefinitely.”
ACORN, the new tip of the Cloward-Piven spear
In 1970, one of George Wiley’s protégés, Wade Rathke — like Bill Ayers, a member of the radical Students for a Democratic Society (SDS) — was sent to found the Arkansas Community Organizations for Reform Now. While NWRO had made a good start, it alone couldn’t accomplish the Cloward-Piven goals. Rathke’s group broadened the offensive to include a wide array of low income “rights.” Shortly thereafter they changed “Arkansas” to “Association of” andACORN went nationwide.
Today ACORN is involved in a wide array of activities, including housing, voting rights, illegal immigration and other issues. According to ACORN’s website: “ACORN is the nation’s largest grassroots community organization of low-and moderate-income people with over 400,000 member families organized into more than 1,200 neighborhood chapters in 110 cities across the country,” It is perhaps the largest radical group in the U.S. and has been cited for widespread criminal activity on many fronts.
Voting
On voting rights, ACORN and its voter mobilization subsidiary, Project Vote, have been involved nationwide in efforts to grant felons the vote and lobbied heavily for the Motor Voter Act of 1993, a law allowing people to register at motor vehicle departments, schools, libraries and other public places. That law had been sought by Cloward and Piven since the early1980s and they were present, standing behind President Clinton at the signing ceremony.
ACORN’s voter rights tactics follow the Cloward-Piven Strategy:
1. Register as many Democrat voters as possible, legal or otherwise and help them vote, multiple times if possible.
2. Overwhelm the system with fraudulent registrations using multiple entries of the same name, names of deceased, random names from the phone book, even contrived names.
3. Make the system difficult to police by lobbying for minimal identification standards.
In this effort, ACORN sets up registration sites all over the country and has beenfrequently cited for turning in fraudulent registrations, as well as destroying republican applications. In the 2004-2006 election cycles alone, ACORN was accused of widespread voter fraud in 12 states. It may have swung the election for one state governor.
ACORN’s website brags: “Since 2004, ACORN has helped more than 1.7 million low- and moderate-income and minority citizens apply to register to vote.” Project vote boasts 4 million. I wonder how many of them are dead? For the 2008 cycle, ACORN and Project Vote have pulled out all the stops. Given their furious nationwide effort, it is not inconceivable that this presidential race could be decided by fraudulent votes alone.
By advocating massive, no-holds-barred voter registration campaigns, they [Cloward & Piven] sought a Democratic administration in Washington, D.C. that would re-distribute the nation’s wealth and lead to a totalitarian socialist state.
Illegal Immigration
As I have written elsewhere, the Radical Left’s offensive to promote illegal immigration is “Cloward-Piven on steroids.” ACORN is at the forefront of this movement as well, and was a leading organization among a broad coalition of radical groups, including Soros’ Open Society Institute, the Service Employees International Union (ACORN founder Wade Rathke also runs a SEIU chapter), and others, that became the Coalition for Comprehensive Immigration Reform. CCIR fortunately failed to gain passage for the 2007 illegal immigrant amnesty bill, but its goals have not changed.
The burden of illegal immigration on our already overstressed welfare system has been widely documented. Some towns in California have even been taken over byillegal immigrant drug cartels. The disease, crime and overcrowding brought by illegal immigrants places a heavy burden on every segment of society and every level of government, threatening to split this country apart at the seams. In the meantime, radical leftist efforts to grant illegal immigrants citizenship guarantee a huge pool of new democrat voters. With little border control, terrorists can also filter in.
Obama aided ACORN as their lead attorney in a successful suit he broughtagainst the Illinois state government to implement the Motor Voter law there. The law had been resisted by Republican Governor Jim Edgars, who feared the law was an opening to widespread vote fraud.
His fears were warranted as the Motor Voter law has since been cited as a major opportunity for vote fraud, especially for illegal immigrants, even terrorists.According to the Wall Street Journal: “After 9/11, the Justice Department found that eight of the 19 hijackers were registered to vote…”
ACORN’s dual offensives on voting and illegal immigration are handy complements. Both swell the voter rolls with reliable democrats while assaulting the country ACORN seeks to destroy with overwhelming new problems.
Mortgage Crisis
And now we have the mortgage crisis, which has sent a shock wave through Wall Street and panicked world financial markets like no other since the stock market crash of 1929. But this is a problem created in Washington long ago. It originated with the Community Reinvestment Act (CRA), signed into law in 1977 by President Jimmy Carter. The CRA was Carter’s answer to a grassroots activist movement started in Chicago, and forced banks to make loans to low income, high risk customers. PhD economist and former Texas Senator Phil Gramm has called it: “a vast extortion scheme against the nation’s banks.”
In the 1980s, groups such as the activists at ACORN began pushing charges of “redlining”-claims that banks discriminated against minorities in mortgage lending. In 1989, sympathetic members of Congress got the Home Mortgage Disclosure Act amended to force banks to collect racial data on mortgage applicants; this allowed various studies to be ginned up that seemed to validate the original accusation.
In fact, minority mortgage applications were rejected more frequently than other applications-but the overwhelming reason wasn’t racial discrimination, but simply that minorities tend to have weaker finances.
ACORN showed its colors again in 1991, by taking over the House Banking Committee room for two days to protest efforts to scale back the CRA.Obama represented ACORN in the Buycks-Roberson v. Citibank Fed. Sav. Bank, 1994 suit against redlining. Most significant of all, ACORN was the driving force behind a 1995 regulatory revision pushed through by the Clinton Administration that greatly expanded the CRA and laid the groundwork for the Fannie Mae, Freddie Mac borne financial crisis we now confront. Barack Obama was the attorney representing ACORN in this effort. With this new authority, ACORN used its subsidiary, ACORN Housing, to promote subprime loans more aggressively.
A 1995 strengthening of the Community Reinvestment Act required banks to find ways to provide mortgages to their poorer communities. It also let community activists intervene at yearly bank reviews, shaking the banks down for large pots of money.
Banks that got poor reviews were punished; some saw their merger plans frustrated; others faced direct legal challenges by the Justice Department.
Flexible lending programs expanded even though they had higher default rates than loans with traditional standards. On the Web, you can still find CRA loans available via ACORN with “100 percent financing . . . no credit scores . . . undocumented income . . . even if you don’t report it on your tax returns.” Credit counseling is required, of course.
Ironically, an enthusiastic Fannie Mae Foundation report singled out one paragon of nondiscriminatory lending, which worked with community activists and followed “the most flexible underwriting criteria permitted.” That lender’s $1 billion commitment to low-income loans in 1992 had grown to $80 billion by 1999and $600 billion by early 2003.
The lender they were speaking of was Countrywide, which specialized in subprime lending and had a working relationship with ACORN.
The revisions also allowed for the first time the securitization of CRA-regulated loans containing subprime mortgages. The changes came as radical “housing rights” groups led by ACORN lobbied for such loans. ACORN at the time was represented by a young public-interest lawyer in Chicago by the name of Barack Obama. (Emphasis, mine.)
Since these loans were to be underwritten by the government sponsored Fannie Mae and Freddie Mac, the implicit government guarantee of those loans absolved lenders, mortgage bundlers and investors of any concern over the obvious risk. As Bloomberg reported: “It is a classic case of socializing the risk while privatizing the profit.”
And if you think Washington policy makers cared about ACORN’s negative influence, think again. Before this whole mess came down, a Democrat-sponsored bill on the table would have created an “Affordable Housing Trust Fund,” granting ACORN access to approximately $500 million in Fannie Mae and Freddie Mac revenues with little or no oversight.
Even now, unbelievably — on the brink of national disaster — Democrats have insisted ACORN benefit from bailout negotiations! Senator Lindsay Graham reported last night (9/25/08) in an interview with Greta Van Susteren of On the Record that Democrats want 20 percent of the bailout money to go to ACORN!
This entire fiasco represents perhaps the pinnacle of ACORN’s efforts to advance the Cloward-Piven Strategy and is a stark demonstration of the power they wield in Washington.
Enter Barack Obama
In attempting to capture the significance of Barack Obama’s Radical Left connections and his relation to the Cloward Piven strategy, I constructed following flow chart. It is by no means complete. There are simply too many radical individuals and organizations to include them all here. But these are perhaps the most significant.
The chart puts Barack Obama at the epicenter of an incestuous stew of American radical leftism. Not only are his connections significant, they practically define who he is. Taken together, they constitute a who’s who of the American radical left, and guiding all is the Cloward-Piven strategy.
Conspicuous in their absence are any connections at all with any other group, moderate, or even mildly leftist. They are all radicals, firmly bedded in the anti-American, communist, socialist, radical leftist mesh.
Saul Alinsky
Most people are unaware that Barack Obama received his training in “community organizing” from Saul Alinsky’s Industrial Areas Foundation. But he did. In and of itself that marks his heritage and training as that of a radical activist. One really needs go no further. But we have.
Bill Ayers
Obama objects to being associated with SDS bomber Bill Ayers, claiming he is being smeared with “guilt by association.” But they worked together at theWoods Fund. The Wall Street Journal added substantially to our knowledge by describing in great detail Obama’s work over five years with SDS bomber Bill Ayers on the board of a non-profit, the Chicago Annenberg Challenge, to push a radical agenda on public school children. As Stanley Kurtz states:
“…the issue here isn’t guilt by association; it’s guilt by participation. As CAC chairman, Mr. Obama was lending moral and financial support to Mr. Ayers and his radical circle. That is a story even if Mr. Ayers had never planted a single bomb 40 years ago.”
Also included in the mix is Theresa Heinz Kerry’s favorite charity, the Tides Foundation. A partial list of Tides grants tells you all you need to know: ACLU, ACORN, Center for American Progress, Center for Constitutional Rights (a communist front,) CAIR, Earth Justice, Institute for Policy Studies (KGB spy nest), National Lawyers Guild (oldest communist front in U.S.), People for the Ethical Treatment of Animals (PETA), and practically every other radical group there is. ACORN’s Wade Rathke runs a Tides subsidiary, the Tides Center.
Carl Davidson and the New Party
We have heard about Bomber Bill, but we hear little about fellow SDS memberCarl Davidson. According to Discover the Networks, Davidson was an early supporter of Barack Obama and a prominent member of Chicago’s New Party, a synthesis of CPUSA members, Socialists, ACORN veterans and other radicals. Obama sought and received the New Party’s endorsement, and they assisted with his campaign. The New Party also developed a strong relationship with ACORN. As an excellent article on the New Party observes: “Barack Obama knew what he was getting into and remains an ideal New Party candidate.”
George Soros
The chart also suggests the reason for George Soros’ fervent support of Obama. The President of his Open Society Institute is Aryeh Neier, founder of the radical Students for a Democratic Society (SDS). As mentioned above, three other former SDS members had extensive contact with Obama: Bill Ayers, Carl Davidson and Wade Rathke. Surely Aryeh Neier would have heard from his former colleagues of the promising new politician. More to the point, Neier is firmly committed to supporting the hugely successful radical organization, ACORN, and would be certain back their favored candidate, Barack Obama.
ACORN
Obama has spent a large portion of his professional life working for ACORN or its subsidiaries, representing ACORN as a lawyer on some of its most critical issues, and training ACORN leaders. Stanley Kurtz’s excellent National Review article, “Inside Obama’s Acorn.” also describes Obama’s ACORN connection in detail. But I can’t improve on Obama’s own words:
I’ve been fighting alongside ACORN on issues you care about my entire career (emphasis added). Even before I was an elected official, when I ran Project Vote voter registration drive in Illinois, ACORN was smack dab in the middle of it, and we appreciate your work. – Barack Obama, Speech to ACORN, November 2007 (Courtesy Newsmax.)
In another excellent article on Obama’s ACORN connections, Newsmax asks a nagging question:
It would be telling to know if Obama, during his years at Columbia, had occasion to meet Cloward and study the Cloward-Piven Strategy.
I ask you, is it possible ACORN would train Obama to take leadership positions within ACORN without telling him what he was training for? Is it possible ACORN would put Obama in leadership positions without clueing him into what his purpose was?? Is it possible that this most radical of organizations would put someone in charge of training its trainers, without him knowing what it was he was training them for?
As a community activist for ACORN; as a leadership trainer for ACORN; as alead organizer for ACORN’s Project Vote; as an attorney representing ACORN’s successful efforts to impose Motor Voter regulations in Illinois; as ACORN’s representative in lobbying for the expansion of high risk housing loans through Fannie Mae and Freddie Mac that led to the current crisis; as a recipient of their assistance in his political campaigns — both with money and campaign workers; it is doubtful that he was unaware of ACORN’s true goals. It is doubtful he was unaware of the Cloward-Piven Strategy.
Fast-forward to 2005 when an obsequious, servile and scraping Daniel Mudd, CEO of Fannie Mae spoke at the Congressional Black Caucus swearing in ceremony for newly-elected Illinois Senator, Barack Obama. Mudd called, the Congressional Black Caucus “our family” and “the conscience of Fannie Mae.”
In his few years as a U.S. senator, Obama has received campaign contributions of $126,349, from Fannie and Freddie, second only to the $165,400 received by Senator Chris Dodd, who has been getting donations from them since 1988. What makes Obama so special?
Johnson had to step down as adviser on Obama’s V.P. search after this gem came out:
An Office of Federal Housing Enterprise Oversight (OFHEO) report[1] from September 2004 found that, during Johnson’s tenure as CEO, Fannie Mae had improperly deferred $200 million in expenses. This enabled top executives, including Johnson and his successor, Franklin Raines, to receive substantial bonuses in 1998.[2] A 2006 OFHEO report[3] found that Fannie Mae had substantially under-reported Johnson’s compensation. Originally reported as $6-7 million, Johnson actually received approximately $21 million.
Obama denies ties to Raines but the Washington Post calls him a member of “Obama’s political circle.” Raines and Johnson were fined $3 million by the Office of Federal Housing Oversight for their manipulation of Fannie books. The fine is small change however, compared to the $50 million Raines was able to obtain in improper bonuses as a result of juggling the books.
Most significantly, Penny Pritzker, the current Finance Chairperson of Obama’s presidential campaign helped develop the complicated investment bundling of subprime securities at the heart of the meltdown. She did so in her position as shareholder and board chair of Superior Bank. The Bank failed in 2001, one of the largest in recent history, wiping out $50 million in uninsured life savings of approximately 1,400 customers. She was named in a RICO class action law suit but doesn’t seem to have come out of it too badly.
As a young attorney in the 1990s, Barack Obama represented ACORN in Washington in their successful efforts to expand Community Reinvestment Act (CRA) authority. In addition to making it easier for ACORN groups to force banks into making risky loans, this also paved the way for banks like Superior to package mortgages as investments, and for the Government Sponsored Enterprises Fannie Mae and Freddie Mac to underwrite them. These changes created the conditions that ultimately lead to the current financial crisis.
Did they not know this would occur? Were these smart people, led by a Harvard graduate, unaware of the Econ 101 concept of moral hazard that would result from the government making implicit guarantees to underwrite private sector financial risk? They should have known that freeing the high-risk mortgage market of risk, calamity was sure to ensue. I think they did.
Barack Obama, the Cloward-Piven candidate, no matter how he describes himself, has been a radical activist for most of his political career. That activism has been in support of organizations and initiatives that at their heart seek to tear the pillars of this nation asunder in order to replace them with their demented socialist vision. Their influence has spread so far and so wide that despite their blatant culpability in the current financial crisis, they are able to manipulate Capital Hill politicians to cut them into $140 billion of the bailout pie!
God grant those few responsible yet remaining in Washington, DC the strength to prevent this massive fraud from occurring. God grant them the courage to stand up in the face of this Marxist tidal wave.
Editors Note: Shortly after becoming part of a local Tea Party Group, I became aware of something called The Cloward-Piven Strategy. After researching this topic extensively, I discovered an article written in September, 2008 BEFORE Barack Obama was elected President. The article was written by James Simpson and originally posted at American Thinker. Here’s a link to the original post if you’d like to check it out. Mr. Simpson has graciously given us permission to repost the article here and will be contributing other material to this site in the future. We are looking forward to his further investigations! As far was TeaPartyConnect.com is concerned, this article should be required reading for all Tea Party members.TheGuru
The Cloward-Piven Strategy, Part II:
Barack Obama and the Strategy of Manufactured Crisis
America waits with bated breath while Washington struggles to bring the U.S. economy back from the brink of disaster. But many of those same politicians caused the crisis, and if left to their own devices will do so again.
Despite the mass media news blackout, a series of books, talk radio and the blogosphere have managed to expose Barack Obama’s connections to his radical mentors – Weather Underground bombers William Ayers and Bernardine Dohrn, Communist Party member Frank Marshall Davis and others. David Horowitz and his Discover the Networks.org have also contributed a wealth of information and have noted Obama’s radical connections since the beginning.
Yet, no one to my knowledge has connected all the dots between Barack Obama and the Radical Left. When seen together, the influences on Obama’s life comprise a who’s who of the radical leftist movement, and it becomes painfully apparent that not only is Obama a willing participant in that movement, he has spent most of his adult life deeply immersed in it.
But even this doesn’t fully describe the extreme nature of this candidate. He can be tied directly to a malevolent overarching strategy that has motivated many, if not all, of the most destructive radical leftist organizations in the United States since the 1960s.
The Cloward-Piven Strategy of Orchestrated Crisis
In an earlier post, I noted the liberal record of legislative disasters, the latest of which is now being played out in the financial markets before our eyes. Before the 1994 Republican takeover, Democrats had sixty years of virtually unbroken power in Congress – with substantial majorities most of the time. Can a group of smart people, studying issue after issue for years on end, with virtually unlimited resources at their command, not come up with a single policy that works? Why are they chronically incapable?
Why?
One of two things must be true. Either the Democrats are unfathomable idiots, who ignorantly pursue ever more destructive policies despite decades of contrary evidence, or they understand the consequences of their actions and relentlessly carry on anyway because they somehow benefit.
I submit to you they understand the consequences. For many it is simply a practical matter of eliciting votes from a targeted constituency at taxpayer expense; we lose a little, they gain a lot, and the politician keeps his job. But for others, the goal is more malevolent – the failure is deliberate. Don’t laugh. This method not only has its proponents, it has a name: the Cloward-Piven Strategy. It animates their agenda, tactics, and long-term strategy.
The Strategy was first elucidated in the May 2, 1966 issue of The Nation magazine by a pair of radical socialist Columbia University professors, Richard Andrew Cloward and Frances Fox Piven. David Horowitz summarizes it as:
The strategy of forcing political change through orchestrated crisis. The “Cloward-Piven Strategy” seeks to hasten the fall of capitalism by overloading the government bureaucracy with a flood of impossible demands, thus pushing society into crisis and economic collapse.
Cloward and Piven were inspired by radical organizer [and Hillary Clinton mentor] Saul Alinsky:
“Make the enemy live up to their (sic) own book of rules,” Alinsky wrote in his 1989 book Rules for Radicals. When pressed to honor every word of every law and statute, every Judeo-Christian moral tenet, and every implicit promise of the liberal social contract, human agencies inevitably fall short. The system’s failure to “live up” to its rule book can then be used to discredit it altogether, and to replace the capitalist “rule book” with a socialist one. (Courtesy of Discover the Networks.org)
Their strategy to create political, financial, and social chaos that would result in revolution blended Alinsky concepts with their more aggressive efforts at bringing about a change in U.S. government. To achieve their revolutionary change, Cloward and Piven sought to use a cadre of aggressive organizers assisted by friendly news media to force a re-distribution of the nation’s wealth.
In their Nation article, Cloward and Piven were specific about the kind of “crisis” they were trying to create:
By crisis, we mean a publicly visible disruption in some institutional sphere. Crisis can occur spontaneously (e.g., riots) or as the intended result of tactics of demonstration and protest which either generate institutional disruption or bring unrecognized disruption to public attention.
No matter where the strategy is implemented, it shares the following features:
The offensive organizes previously unorganized groups eligible for government benefits but not currently receiving all they can.
The offensive seeks to identify new beneficiaries and/or create new benefits.
The overarching aim is always to impose new stresses on target systems, with the ultimate goal of forcing their collapse.
Capitalizing on the racial unrest of the 1960s, Cloward and Piven saw the welfare system as their first target. They enlisted radical black activist George Wiley, who created the National Welfare Rights Organization (NWRO) to implement the strategy. Wiley hired militant foot soldiers to storm welfare offices around the country, violently demanding their “rights.” According to a City Journal article by Sol Stern, welfare rolls increased from 4.3 million to 10.8 million by the mid-1970s as a result, and in New York City, where the strategy had been particularly successful, “one person was on the welfare rolls… for every two working in the city’s private economy.”
The movement’s impact on New York City was jolting: welfare caseloads, already climbing 12 percent a year in the early sixties, rose by 50 percent during Lindsay’s first two years; spending doubled… The city had 150,000 welfare cases in 1960; a decade later it had 1.5 million.
The vast expansion of welfare in New York City that came of the NWRO’s Cloward-Piven tactics sent the city into bankruptcy in 1975. Rudy Giuliani cited Cloward and Piven by name as being responsible for “an effort at economic sabotage.” He also credited Cloward-Piven with changing the cultural attitude toward welfare from that of a temporary expedient to a lifetime entitlement, an attitude which in-and-of-itself has caused perhaps the greatest damage of all.
Cloward and Piven looked at this strategy as a gold mine of opportunity. Within the newly organized groups, each offensive would find an ample pool of foot soldier recruits willing to advance its radical agenda at little or no pay, and expand its base of reliable voters, legal or otherwise. The radicals’ threatening tactics also would accrue an intimidating reputation, providing a wealth of opportunities for extorting monetary and other concessions from the target organizations. In the meantime, successful offensives would create an ever increasing drag on society. As they gleefully observed:
Moreover, this kind of mass influence is cumulative because benefits are continuous. Once eligibility for basic food and rent grants is established, the drain on local resources persists indefinitely.
The next time you drive through one of the many blighted neighborhoods in our cities, or read of the astronomical crime, drug addiction, and out-of-wedlock birth rates, or consider the failed schools, strapped police and fire resources of every major city, remember Cloward and Piven’s thrill that “…the drain on local resources persists indefinitely.”
ACORN, the new tip of the Cloward-Piven spear
In 1970, one of George Wiley’s protégés, Wade Rathke – like Bill Ayers, a member of the radical Students for a Democratic Society (SDS) – was sent to found the Arkansas Community Organizations for Reform Now. While NWRO had made a good start, it alone couldn’t accomplish the Cloward-Piven goals. Rathke’s group broadened the offensive to include a wide array of low income “rights.” Shortly thereafter they changed “Arkansas” to “Association of” and ACORN went nationwide.
Today ACORN is involved in a wide array of activities, including housing, voting rights, illegal immigration and other issues. According to ACORN’s website: “ACORN is the nation’s largest grassroots community organization of low- and moderate-income people with over 400,000 member families organized into more than 1,200 neighborhood chapters in 110 cities across the country,” It is perhaps the largest radical group in the U.S. and has been cited for widespread criminal activity on many fronts.
Voting
On voting rights, ACORN and its voter mobilization subsidiary, Project Vote, have been involved nationwide in efforts to grant felons the vote and lobbied heavily for the Motor Voter Act of 1993, a law allowing people to register at motor vehicle departments, schools, libraries and other public places. That law had been sought by Cloward and Piven since the early1980s and they were present, standing behind President Clinton at the signing ceremony.
ACORN’s voter rights tactics follow the Cloward-Piven Strategy:
Register as many democrat voters as possible, legal or otherwise and help them vote, multiple times if possible.
Overwhelm the system with fraudulent registrations using multiple entries of the same name, names of deceased, random names from the phone book, even contrived names.
Make the system difficult to police by lobbying for minimal identification standards.
In this effort, ACORN sets up registration sites all over the country and has been frequently cited for turning in fraudulent registrations, as well as destroying republican applications. In the 2004-2006 election cycles alone, ACORN was accused of widespread voter fraud in 12 states. It may have swung the election for one state governor.
ACORN’s website brags:
“Since 2004, ACORN has helped more than 1.7 million low- and moderate-income and minority citizens apply to register to vote.”
Project Vote boasts 4 million. I wonder how many of them had a pulse. For the 2008 cycle, ACORN and Project Vote have pulled out all the stops. Given their furious nationwide effort, it is not inconceivable that this presidential race could be decided by fraudulent votes alone.
By advocating massive, no-holds-barred voter registration campaigns, they [Cloward & Piven] sought a Democratic administration in Washington, D.C. that would re-distribute the nation’s wealth and lead to a totalitarian socialist state.
Illegal Immigration
As I have written elsewhere, the Radical Left’s offensive to promote illegal immigration is “Cloward-Piven on steroids.” ACORN is at the forefront of this movement as well, and was a leading organization among a broad coalition of radical groups, including Soros’ Open Society Institute, the Service Employees International Union (ACORN founder Wade Rathke also runs a SEIU chapter), and others, that became theCoalition for Comprehensive Immigration Reform. CCIR fortunately failed to gain passage for the 2007 illegal immigrant amnesty bill, but its goals have not changed.
The burden of illegal immigration on our already overstressed welfare system has been widely documented. Some towns in California have even been taken over by illegal immigrant drug cartels. The disease, crime and overcrowding brought by illegal immigrants places a heavy burden on every segment of society and every level of government, threatening to split this country apart at the seams. In the meantime, radical leftist efforts to grant illegal immigrants citizenship guarantee a huge pool of new democrat voters. With little border control, terrorists can also filter in.
Obama aided ACORN as their lead attorney in a successful suit he brought against the Illinois state government to implement the Motor Voter law there. The law had been resisted by Republican Governor Jim Edgars, who feared the law was an opening to widespread vote fraud.
His fears were warranted as the Motor Voter law has since been cited as a major opportunity for vote fraud, especially for illegal immigrants, even terrorists. According to the Wall Street Journal: “After 9/11, the Justice Department found that eight of the 19 hijackers were registered to vote…”
ACORN’s dual offensives on voting and illegal immigration are handy complements. Both swell the voter rolls with reliable democrats while assaulting the country ACORN seeks to destroy with overwhelming new problems.
Mortgage Crisis
And now we have the mortgage crisis, which has sent a shock wave through Wall Street and panicked world financial markets like no other since the stock market crash of 1929. But this is a problem created in Washington long ago. It originated with the Community Reinvestment Act (CRA), signed into law in 1977 by President Jimmy Carter. The CRA was Carter’s answer to a grassroots activist movement started in Chicago, and forced banks to make loans to low income, high risk customers. PhD economist and former Texas Senator Phil Gramm has called it: “a vast extortion scheme against the nation’s banks.”
In the 1980s, groups such as the activists at ACORN began pushing charges of “redlining”—claims that banks discriminated against minorities in mortgage lending. In 1989, sympathetic members of Congress got the Home Mortgage Disclosure Act amended to force banks to collect racial data on mortgage applicants; this allowed various studies to be ginned up that seemed to validate the original accusation.
In fact, minority mortgage applications were rejected more frequently than other applications—but the overwhelming reason wasn’t racial discrimination, but simply that minorities tend to have weaker finances.
ACORN showed its colors again in 1991, by taking over the House Banking Committee room for two days to protest efforts to scale back the CRA. Most significant of all, ACORN was the driving force behind a 1995 regulatory revision pushed through by the Clinton Administration that greatly expanded the CRA and laid the groundwork for the Fannie Mae, Freddie Mac borne financial crisis we now confront. Barack Obama was the attorney representing ACORN in this effort. With this new authority, ACORN used its subsidiary,ACORN Housing, to promote subprime loans more aggressively. Barack Obama represented ACORN in this effort.
A 1995 strengthening of the Community Reinvestment Act required banks to find ways to provide mortgages to their poorer communities. It also let community activists intervene at yearly bank reviews, shaking the banks down for large pots of money.
Banks that got poor reviews were punished; some saw their merger plans frustrated; others faced direct legal challenges by the Justice Department.
Flexible lending programs expanded even though they had higher default rates than loans with traditional standards. On the Web, you can still find CRA loans available via ACORN with “100 percent financing . . . no credit scores . . . undocumented income . . . even if you don’t report it on your tax returns.” Credit counseling is required, of course.
Ironically, an enthusiastic Fannie Mae Foundation report singled out one paragon of nondiscriminatory lending, which worked with community activists and followed “the most flexible underwriting criteria permitted.” That lender’s $1 billion commitment to low-income loans in 1992 had grown to $80 billion by 1999 and $600 billion by early 2003.
The lender they were speaking of was Countrywide – rescued by Bank of America in July – which specialized in subprime lending and had a working relationship with ACORN.
The revisions also allowed for the first time the securitization of CRA-regulated loans containing subprime mortgages. The changes came as radical “housing rights” groups led by ACORN lobbied for such loans. ACORN at the time was represented by a young public-interest lawyer in Chicago by the name of Barack Obama. (Emphasis, mine.)
Since these loans were to be underwritten by the government sponsored Fannie Mae and Freddie Mac, the implicit government guarantee of those loans absolved lenders, mortgage bundlers and investors of any concern over the obvious risk. As Bloomberg reported: “It is a classic case of socializing the risk while privatizing the profit.”
And if you think Washington policy makers cared about ACORN’s negative influence, think again. Before this whole mess came down, a Democrat-sponsored bill on the table would have created an “Affordable Housing Trust Fund,” granting ACORN access to approximately $500 million in Fannie Mae and Freddie Mac revenues with little or no oversight.
Even now, unbelievably – on the brink of national disaster – Democrats have insisted ACORN benefit from bailout negotiations! Senator Lindsay Graham reported Thursday night (9/25/08) in an interview with Greta Van Susteren of On the Record that Democrats want 20 percent of the bailout money to go to ACORN!
This entire fiasco represents perhaps the pinnacle of ACORN’s efforts to advance the Cloward-Piven Strategy and is a stark demonstration of the power they wield in Washington.
Enter Barack Obama.
In attempting to capture the significance of Barack Obama’s Radical Left connections and his connection to the Cloward Piven strategy, I constructed following flow chart. It is by no means complete. There are simply too many radical individuals and organizations to include them all here. But these are perhaps the most significant.
The chart puts Barack Obama at the epicenter of an incestuous stew of American radical leftism. Not only are his connections significant, they practically define who he is. Taken together, they constitute a who’s who of the American Radical Left, and guiding all is the Cloward-Piven strategy.
Conspicuous in their absence are any connections at all with any other group, moderate, or even mildly leftist. They are all radicals, firmly bedded in the anti-American, communist, socialist, radical leftist mesh.
Saul Alinsky
Most people are unaware that Barack Obama received his training in “community organizing” from Saul Alinsky’s Industrial Areas Foundation. But he did. In and of itself that marks his heritage and training as that of a radical activist. One really need go no further. But we have.
Bill Ayers
Obama objects to being associated with SDS bomber Bill Ayers, claiming he is being smeared with “guilt by association.” But they worked together at the Woods Fund. The Wall Street Journal has added substantially to our knowledge by describing in great detail Obama’s work over five years with Ayers on the board of the Chicago Annenberg Challenge, a non-profit Ayers designed to push a radical agenda on public school children. As Stanley Kurtz states: “…the issue here isn’t guilt by association; it’s guilt by participation. As CAC chairman, Mr. Obama was lending moral and financial support to Mr. Ayers and his radical circle. That is a story even if Mr. Ayers had never planted a single bomb 40 years ago.”
Also included in the mix is John and Theresa Heinz Kerry’s favorite charity, the Tides Foundation. A partial list of Tides grants tells you all you need to know: ACLU, ACORN, Center for American Progress, Center for Constitutional Rights (a communist front,) CAIR, Earth Justice, Institute for Policy Studies (KGB spy nest), National Lawyers Guild (oldest communist front in U.S.), People for the Ethical Treatment of Animals (PETA), and practically every other radical group there is. ACORN’s Wade Rathke runs a Tides subsidiary, the Tides Center. No wonder Kerry, Kennedy et al love Obama. Just one big happy family.
Carl Davidson and the New Party
We have heard about Bomber Bill, but we hear little about fellow SDS member Carl Davidson. According toDiscover the Networks, Davidson was an early supporter of Barack Obama and a prominent member of Chicago’s New Party, a synthesis of CPUSA members, Socialists, ACORN veterans and other radicals. Obama sought and received the New Party’s endorsement, and they assisted with his campaign. The New Party also developed a strong relationship with ACORN. As an excellent article on the New Party observes: “Barack Obama knew what he was getting into and remains an ideal New Party candidate.”
George Soros
The chart also suggests one reason for George Soros’ fervent support of Obama. The President of his Open Society Institute is Aryeh Neier, founder of the radical Students for a Democratic Society (SDS). As mentioned above, three other former SDS members had extensive contact with Obama: Bill Ayers, Carl Davidson and Wade Rathke. Surely Aryeh Neier would have heard of the promising new politician from his former colleagues. More to the point, Neier is firmly committed to supporting the hugely successful radical organization, ACORN, and would be certain back their favored candidate, Barack Obama. Soros is a natural suspect in this fiasco as he has made all his ill-gotten gains short-selling on national disaster. The extent of his dirty dealings is worthy of its own book.
ACORN
Obama has spent a large portion of his professional life working for ACORN or its subsidiaries, representing ACORN as a lawyer on some of its most critical issues, and training ACORN leaders. Stanley Kurtz’s excellent National Review article, “Inside Obama’s Acorn.” also describes Obama’s ACORN connection in detail. But I can’t improve on Obama’s own words:
I’ve been fighting alongside ACORN on issues you care about my entire career (emphasis added). Even before I was an elected official, when I ran Project Vote voter registration drive in Illinois, ACORN was smack dab in the middle of it, and we appreciate your work. — Barack Obama, Speech to ACORN, November 2007 (Courtesy Newsmax.)
In another excellent article on Obama’s ACORN connections, Newsmax asks a nagging question:
It would be telling to know if Obama, during his years at Columbia, had occasion to meet Cloward and study the Cloward-Piven Strategy.
I will put it more bluntly: Barack Obama is fully aware of the Cloward-Piven strategy and has actively worked to achieve its goals for most of his adult life.
I ask you, is it possible ACORN would train Obama to take leadership positions within ACORN without telling him what he was training for? Is it possible ACORN would put Obama in leadership positions without clueing him into what his purpose was?? Is it possible that this most radical of organizations would put someone in charge of training its trainers, without him knowing what it was he was training them for???
As a community activist for ACORN; as a leadership trainer for ACORN; as a lead organizer for ACORN’s Project Vote; as an attorney representing ACORN’s successful efforts to impose Motor Voter regulations in Illinois; as ACORN’s representative in lobbying for the expansion of high risk housing loans through Fannie Mae and Freddie Mac that led to the current crisis; as a recipient of their assistance in his political campaigns – both with money and campaign workers; it is inconceivable that he was unaware of ACORN’s true goals. It is inconceivable he was unaware of the Cloward-Piven Strategy.
Fast-forward to 2005 when an obsequious, servile and scraping Daniel Mudd, CEO of Fannie Mae spoke at the Congressional Black Caucus swearing in ceremony for newly-elected Illinois Senator, Barack Hussein Obama. Mudd called, the Congressional Black Caucus “our family” and “the conscience of Fannie Mae.”
In his few years as a U.S. senator, Obama has received campaign contributions of $126,349, from Fannie and Freddie, second only to the $165,400 received by Senator Chris Dodd, who has been getting donations from them since 1988. What makes Obama so special?
Johnson had to step down as adviser on Obama’s V.P. search after this gem came out:
An Office of Federal Housing Enterprise Oversight (OFHEO) report[1] from September 2004 found that, during Johnson’s tenure as CEO, Fannie Mae had improperly deferred $200 million in expenses. This enabled top executives, including Johnson and his successor, Franklin Raines, to receive substantial bonuses in 1998.[2] A 2006 OFHEO report[3] found that Fannie Mae had substantially under-reported Johnson’s compensation. Originally reported as $6-7 million, Johnson actually received approximately $21 million.
Obama denies ties to Raines but the Washington Post calls him a member of “Obama’s political circle.” Raines and Johnson were fined $3 million by the Office of Federal Housing Oversight for their manipulation of Fannie books. The fine is small change however, compared to the $50 million Raines was able to obtain in improper bonuses as a result of juggling the books. To add insult to injury, the $3 million fine was paid with Fannie Mae’s insurance fund.
Most significantly, Penny Pritzker, the current Finance Chairperson of Obama’s presidential campaign, helped develop the complicated investment bundling of subprime securities at the heart of the meltdown. She did so in her position as owner and board chair of Superior Bank. The Bank failed in 2001, one of the largest in recent history, wiping out $50 million in life savings of the bank’s approximately 1,400 customers. She was named in a RICO class action law suit but doesn’t seem to have come out of it too badly.
As a young attorney in the 1990s, Barack Obama represented ACORN in Washington in their successful efforts to expand Community Reinvestment Act (CRA) authority. In addition to making it easier for ACORN groups to force banks into making risky loans, this also paved the way for banks like Superior to package mortgages as investments, and for the Government Sponsored Enterprises Fannie Mae and Freddie Mac to underwrite them. These changes created the conditions that ultimately lead to the current financial crisis.
Did they not know this would occur? Were these smart people, led by a Harvard graduate, unaware of the Econ 101 concept of moral hazard that would result from the government making implicit guarantees to underwrite private sector financial risk? They should have known that freeing the high-risk mortgage market of risk, calamity was sure to ensue. I think they did.
Barack Obama, the Cloward-Piven candidate, no matter how he describes himself, has been a radical activist for most of his political career. That activism has been in support of organizations and initiatives that at their heart seek to tear the pillars of this nation asunder in order to replace them with their demented socialist vision. Their influence has spread so far and so wide that despite their blatant culpability in the current financial crisis, they are able to manipulate Capital Hill politicians to cut them into $140 billion of the bailout pie!
God grant those few responsible yet remaining in Washington, DC the strength to prevent this massive fraud from occurring. God grant them the courage to stand up in the face of this Marxist tidal wave.
You can access the other parts of the Cloward-Piven series of articles by James Simpson at the American Daughter Media Center which also includes versions of these articles in Word Document format for downloading and re-printing.
The Cloward–Piven strategy is a political strategy outlined in 1966 by American sociologists and political activists Richard Cloward and Frances Fox Piven that called for overloading the U.S. public welfare system in order to precipitate a crisis that would lead to a replacement of the welfare system with a national system of “a guaranteed annual income and thus an end to poverty”. Cloward and Piven were a married couple who were both professors at the Columbia University School of Social Work. The strategy was formulated in a May 1966 article in liberal[1] magazine The Nation titled “The Weight of the Poor: A Strategy to End Poverty”.[2]
The two stated that many Americans who were eligible for welfare were not receiving benefits, and that a welfare enrollment drive would strain local budgets, precipitating a crisis at the state and local levels that would be a wake-up call for the federal government, particularly the Democratic Party. There would also be side consequences of this strategy, according to Cloward and Piven. These would include: easing the plight of the poor in the short-term (through their participation in the welfare system); shoring up support for the national Democratic Party then-splintered by pluralistic interests (through its cultivation of poor and minority constituencies by implementing a national “solution” to poverty); and relieving local governments of the financially and politically onerous burdens of public welfare (through a national “solution” to poverty)[citation needed].
Cloward and Piven’s article is focused on forcing the Democratic Party, which in 1966 controlled the presidency and both houses of the United States Congress, to take federal action to help the poor. They stated that full enrollment of those eligible for welfare “would produce bureaucratic disruption in welfare agencies and fiscal disruption in local and state governments” that would “deepen existing divisions among elements in the big-city Democratic coalition: the remaining white middle class, the working-class ethnic groups and the growing minority poor. To avoid a further weakening of that historic coalition, a national Democratic administration would be constrained to advance a federal solution to poverty that would override local welfare failures, local class and racial conflicts and local revenue dilemmas.”[3] They wrote:
“
The ultimate objective of this strategy—to wipe out poverty by establishing a guaranteed annual income—will be questioned by some. Because the ideal of individual social and economic mobility has deep roots, even activists seem reluctant to call for national programs to eliminate poverty by the outright redistribution of income.[3]
”
Michael Reisch and Janice Andrews wrote that Cloward and Piven “proposed to create a crisis in the current welfare system – by exploiting the gap between welfare law and practice – that would ultimately bring about its collapse and replace it with a system of guaranteed annual income. They hoped to accomplish this end by informing the poor of their rights to welfare assistance, encouraging them to apply for benefits and, in effect, overloading an already overburdened bureaucracy.”[4]
Focus on Democrats
The authors pinned their hopes on creating disruption within the Democratic Party. “Conservative Republicans are always ready to declaim the evils of public welfare, and they would probably be the first to raise a hue and cry. But deeper and politically more telling conflicts would take place within the Democratic coalition,” they wrote. “Whites – both working class ethnic groups and many in the middle class – would be aroused against the ghetto poor, while liberal groups, which until recently have been comforted by the notion that the poor are few… would probably support the movement. Group conflict, spelling political crisis for the local party apparatus, would thus become acute as welfare rolls mounted and the strains on local budgets became more severe.”[5]
Reception and criticism
Howard Phillips, chairman of The Conservative Caucus, was quoted in 1982 as saying that the strategy could be effective because “Great Society programs had created a vast army of full-time liberal activists whose salaries are paid from the taxes of conservative working people.”[6]
Liberal commentator Michael Tomasky, writing about the strategy in the 1990s and again in 2011, called it “wrongheaded and self-defeating”, writing: “It apparently didn’t occur to [Cloward and Piven] that the system would just regard rabble-rousing black people as a phenomenon to be ignored or quashed.”[7]
Impact of the strategy
In papers published in 1971 and 1977, Cloward and Piven argued that mass unrest in the United States, especially between 1964 and 1969, did lead to a massive expansion of welfare rolls, though not to the guaranteed-income program that they had hoped for.[8]Political scientist Robert Albritton disagreed, writing in 1979 that the data did not support this thesis; he offered an alternative explanation for the rise in welfare caseloads.
In his 2006 book Winning the Race, political commentator John McWhorter attributed the rise in the welfare state after the 1960s to the Cloward–Piven strategy, but wrote about it negatively, stating that the strategy “created generations of black people for whom working for a living is an abstraction.”[9]
According to historian Robert E. Weir in 2007, “Although the strategy helped to boost recipient numbers between 1966 and 1975, the revolution its proponents envisioned never transpired.”[10]
Some commentators have blamed the Cloward–Piven strategy for the near-bankruptcy of New York City in 1975.[11][12]
Conservative commentator Glenn Beck referred to the Cloward-Piven Strategy often on his Fox News television show, Glenn Beck, during its run from 2009 to 2011, reiterating his opinion that it had helped to inspire President Barack Obama‘s economic policy. On February 18, 2010, for example, Beck said, “you’ve got total destruction of wealth coming … It’s the final phase of the Cloward-Piven strategy, which is collapse the system.”[13]
Richard Kim, writing in 2010 in The Nation (in which the original essay appeared), called such assertions “a reactionary paranoid fantasy …” but says that “the left’s gut reaction upon hearing of it–to laugh it off as a Scooby-Doo comic mystery–does nothing to blunt its appeal or limit its impact.”[14]The Nation later stated that Beck blames the “Cloward-Piven Strategy” for “the financial crisis of 2008, healthcare reform, Obama’s election and massive voter fraud” and has resulted in the posting of much violent and threatening rhetoric by users on Beck’s website, including death threats against Frances Fox Piven.[15] For her part, Piven vigorously continues to defend the original idea, calling its conservative interpretation “lunatic”.[16]
Jump up^Albritton, Robert (December 1979). Social Amelioration through Mass Insurgency? A Reexamination of the Piven and Cloward Thesis. American Political Science Review. JSTOR1953984.
Peter Schiff Thinks ‘Unfunded Liabilities’ Is An Economic Indicator
Deficits, Debts and Unfunded Liabilities: The Consequences of Excessive Government Spending
Economist: Real national debt is over $70 trillion, not $17 trillion
The First 12 Hours of a US Dollar Collapse
Overdose: The Next Financial Crisis
Global Debt Exceeds $100 Trillion as Governments Binge, BIS Says
By John Glover Mar 9, 2014 6:00 AM CT
The amount of debt globally has soared more than 40 percent to $100 trillion since the first signs of the financial crisis as governments borrowed to pull their economies out of recession and companies took advantage of record low interest rates, according to the Bank for International Settlements.
The $30 trillion increase from $70 trillion between mid-2007 and mid-2013 compares with a $3.86 trillion decline in the value of equities to $53.8 trillion in the same period, according to data compiled by Bloomberg. The jump in debt as measured by the Basel, Switzerland-based BIS in its quarterly review is almost twice the U.S.’s gross domestic product.
Borrowing has soared as central banks suppress benchmark interest rates to spur growth after the U.S. subprime mortgage market collapsed and Lehman Brothers Holdings Inc.’s bankruptcy sent the world into its worst financial crisis since the Great Depression. Yields on all types of bonds, from governments to corporates and mortgages, average about 2 percent, down from more than 4.8 percent in 2007, according to the Bank of America Merrill Lynch Global Broad Market Index.
“Given the significant expansion in government spending in recent years, governments (including central, state and local governments) have been the largest debt issuers,” according to Branimir Gruic, an analyst, and Andreas Schrimpf, an economist at the BIS. The organization is owned by 60 central banks and hosts the Basel Committee on Banking Supervision, a group of regulators and central bankers that sets global capital standards.
Austerity Measures
Marketable U.S. government debt outstanding has surged to a record $12 trillion, up from $4.5 trillion at the end of 2007, according to U.S. Treasury data compiled by Bloomberg. Corporate bond sales globally jumped during the period, with issuance totaling more than $21 trillion, Bloomberg data show.
Concerned that high debt loads would cause international investors to avoid their markets, many nations resorted to austerity measures of reduced spending and increased taxes, reining in their economies in the process as they tried to restore the fiscal order they abandoned to fight the worldwide recession.
Adjusting budgets to ignore interest payments, the International Monetary Fund said late last year that the so-called primary deficit in the Group of Seven countries reached an average 5.1 percent in 2010 when also smoothed to ignore large economic swings. The measure will fall to 1.2 percent this year, the IMF predicted.
The unprecedented retrenchments between 2010 and 2013 amounted to 3.5 percent of U.S. gross domestic product and 3.3 percent of euro-area GDP, according to Julian Callow, chief international economist at Barclays Plc in London.
The riskiest to the most-creditworthy bonds have returned more than 31 percent since 2007, according to Bank of America Merrill Lynch index data. Treasury and agency debt handed investors gains of 27 percent in the period, while corporate bonds worldwide returned more than 40 percent, the indexes show.
Story 1: Obama’s Era of Austerity is Over — Let The Big Spending Beginning — President Is Delusional Suffers From Spending Addiction Disorder (SAD) — Videos
In the past few years, debt held by the public has been significantly greater relative to GDP than at any time since just after World War II, and under current law it will continue to be quite high by historical standards during the next decade. With debt so large, federal spending on interest payments will increase substantially as interest rates rise to more typical levels. Moreover, because federal borrowing generally reduces national saving, the capital stock and wages will be smaller than if debt was lower. In addition, lawmakers would have less flexibility than they otherwise would to use tax and spending policies to respond to unanticipated challenges. Finally, such a large debt poses a greater risk of precipitating a fiscal crisis, during which investors would lose so much confidence in the government’s ability to manage its budget that the government would be unable to borrow at affordable rates.
posted by Barry Blom & Leigh Angres on february 20, 2014
CBO recently released The Budget and Economic Outlook: 2014 to 2024. In that report, CBO projects that if current laws remain in place, the federal budget deficit will total $514 billion in fiscal year 2014. That deficit will be $166 billion smaller than the figure posted in 2013 and down sharply from the shortfalls recorded between 2009 and 2012, which exceeded $1 trillion annually. At 3.0 percent of gross domestic product (GDP), this year’s deficit would be near the average experienced over the past 40 years and about 7 percentage points lower than the figure recorded in 2009.
Today’s post summarizes CBO’s assessment of the budget outlook over the next decade. Three more posts—to appear over the next several days—will provide more detail about the outlook for spending, revenues, and the economy. One more post will expand upon CBO’s economic forecast, explaining the reasons behind the slow recovery of the labor market.
Under Current Law, Federal Debt Will Grow to 79 Percent of GDP at the End of 2024, CBO Estimates
CBO constructs it baseline projections of federal revenues and spending over the coming decade under the assumption that current laws generally remain unchanged. Under that assumption, revenues are projected to grow by about 1 percentage point of GDP over the next 10 years—from 17.5 percent in 2014 to 18.4 percent in 2024. But outlays are projected to rise twice as much, from 20.5 percent of GDP in 2014 to 22.4 percent in 2024. The increase in outlays reflects substantial growth in the cost of the largest benefit programs—Social Security, Medicare, and Medicaid—and in payments of interest on the government’s debt; those increases would more than offset a significant decline in discretionary spending relative to the size of the economy.
Although the deficit in CBO’s baseline projections continues to decline as a percentage of GDP in 2015, to 2.6 percent, it then starts to increase again in 2016, reaching 4.0 percent of GDP in 2024. That figure for the end of the 10-year projection period is roughly 1 percentage point above the average deficit over the past 40 years relative to the size of the economy.
That pattern of lower deficits initially, followed by higher deficits for the remainder of the projection period, would cause debt held by the public to follow a similar trajectory (see the figure below). Relative to the nation’s output, debt held by the public is projected to decline from 74 percent of GDP in 2014 to 72 percent of GDP in 2017, but to rise thereafter, to 79 percent of GDP at the end of 2024. (As recently as the end of 2007, debt held by the public was equal to 35 percent of GDP.)
In the past few years, debt held by the public has been significantly greater relative to GDP than at any time since just after World War II, and under current law it will continue to be quite high by historical standards during the next decade. With debt so large, federal spending on interest payments will increase substantially as interest rates rise to more typical levels. Moreover, because federal borrowing generally reduces national saving, the capital stock and wages will be smaller than if debt was lower. In addition, lawmakers would have less flexibility than they otherwise would to use tax and spending policies to respond to unanticipated challenges. Finally, such a large debt poses a greater risk of precipitating a fiscal crisis, during which investors would lose so much confidence in the government’s ability to manage its budget that the government would be unable to borrow at affordable rates. (For a discussion of the consequences of elevated debt, see CBO’s December 2013 report Choices for Deficit Reduction: An Update.)
Projected Deficits Reflect Substantial Growth in the Cost of the Largest Benefit Programs
Projected deficits and debt for the coming decade reflect some of the long-term budgetary pressures facing the nation. The aging of the population, the rising costs of health care, and the expansion in federal subsidies for health insurance that is now under way will substantially boost federal spending on Social Security and the government’s major health care programs by 2 percentage points of GDP over the next 10 years (see the figure below). But the pressures of aging and the rising costs of health care will intensify during the next few decades. Unless the laws governing those programs are changed—or the increased spending is accompanied by corresponding reductions in other spending relative to GDP, by sufficiently higher tax revenues, or by a combination of those changes—debt will rise sharply relative to GDP after 2024. (For a more detailed discussion of the long-term budget situation, see CBO’s September 2013 report The 2013 Long-Term Budget Outlook.)
Moreover, holding discretionary spending within the limits required under current law—an assumption that underlies these projections—may be quite difficult. The caps on discretionary budget authority established by the Budget Control Act of 2011 (Public Law 112-25) and subsequently amended will reduce such spending to an unusually small amount relative to the size of the economy. With those caps in place, CBO projects, discretionary spending will equal 5.2 percent of GDP in 2024; by comparison, the lowest share for discretionary spending in any year since 1962 (the earliest year for which such data have been reported) was 6.0 percent in 1999. (Nevertheless, total federal spending would be a larger share of GDP than its average during the past 40 years because of higher spending on Social Security, Medicare, Medicaid, other health insurance subsidies for low-income people, and interest payments on the debt.) Because the allocation of discretionary spending is determined by annual appropriation acts, lawmakers have not yet decided which specific government services and benefits will be reduced or constrained to meet the specified overall limits.
The Budget Outlook for the Coming Decade Has Worsened Since May 2013
The baseline budget outlook has worsened since May 2013, when CBO last published its 10-year projections. A description of the changes in CBO’s baseline since May 2013 can be found in Appendix A of the report. At that time, deficits projected under current law totaled $6.3 trillion for the 2014–2023 period, or about 3 percent of GDP. Deficits are now projected to be about $1 trillion larger. The bulk of that change occurred in CBO’s estimates of revenues: The agency has reduced its projection of total revenues by $1.6 trillion, mostly because of changes in the economic outlook. A decrease of $0.6 trillion in projected outlays through 2023 partially offset that change.
Barry Blom is an analyst in CBO’s Budget Analysis Division and Leigh Angres is special assistant to the CBO Director.
Bar Chart Data Source: Monthly Treasury Statement (MTS) published by the U. S. Treasury Department. WE DON’T MAKE THIS UP! IT COMES FROM THE U. S. GOVERNMENT! NO ADJUSTMENTS.
The MTS published in October, reports the final actual expenditures for the previous FY. This chart shows FY2013 actual spending data. Here is the link to download your own copy from the Treasury Department web site.
The chart normally shows the proposed budget line for the next fiscal year (FY2014 started 1 October 2013), but the two-year deal for 2014-2015 signed in December 2013, has so few details that showing a “budget” for 2014 or 2015 is no possible. And now Congress has passed the Appropriations (spending) bill that funds the budget through end of FY2014. The details are in a 1500+ page bill that no one in Congress read. But you CAN read it. Here it is H.R.3547 – Consolidated Appropriations Act, 2014. (it’s a large pdf document … give it time.)
But we may have an option; we will use the historical tables published by the OMB, about mid-FY2014, take the data from the “estimated” 2014 column. Look for it later.
Look at the bar chart to find items that are growing and items that are being reduced. The largest growth is at the Department of Agriculture; it handles Food Stamps (SNAP). You pay taxes, your money is paying for food stamps.
NDAC studies the Budget Proposals submitted to the U.S. Senate each year by the President of the United States and the House of Representatives. One of the documents that goes along with the budget proposals, “Historical Tables“, is published by the Office of Management and Budget (OMB). Our analysis is discussed on the home page of this web site.
Out-of-Control Spending Is to Blame for America’s Deficit Problem
Federal spending is projected to grow at a rapid pace beyond the 10-year budget window. Without reforms, spending on interest on the debt, health care programs (Medicare, Medicaid, Obamacare, etc.), and Social Security will reach unsustainable levels. As a result, these spending levels will cause exploding deficits as tax revenues will be at their modern average level (1952-2008).
Where Does All the Money Go?
In 2012, the major entitlement programs-Social Security, Medicare, Medicaid, and other health care-consumed 45 percent of all federal spending. These programs, and interest on the debt, are on track to consume an even greater share of spending in future years, while the portion of federal spending dedicated to other national priorities will decline.
SHARE OF FEDERAL SPENDING IN 2012
Entitlement Program Spending Is Massive
Annual spending on Social Security, Medicare, Medicaid, and other health programs is massive compared to other federal spending priorities. There is too much waste and inappropriate spending in the discretionary budget as well, but Congress will not be able to rein in spending and debt without reforming the entitlement programs.
ESTIMATED ANNUAL SPENDING IN 2014
Publicly Held Debt Set to Skyrocket
Runaway spending on Medicare, Medicaid, and Social Security will drive federal debt to unsustainable levels over the next few decades. Total national debt comprises publicly held debt (the most relevant to credit markets) and debt that one part of the government owes to another, such as the Social Security Trust Fund.
All Tax Revenue Will Go Toward Entitlements and Net Interest by 2030
In less than two decades, all projected tax revenues would be consumed by three federal programs (Medicare, Social Security, and Medicaid, which includes CHIP and Obamacare) and interest on the debt. Entitlement reform is a must.
What if a Typical Family Spent and Borrowed Like the Federal Government?
Families understand that it is unwise to repeatedly spend much more than they take in. But Washington continues its shopping spree on the taxpayer credit card with seemingly no regard to the stack of bills the nation has already piled up.
The Beatles – Taxman
How Obama could kill the Democratic Party
The Price of a U.S. Credit Rating Downgrade
U.S. deficit to decline, then rise as labor market struggles: CBO
Top 10 MILITARY BUDGETS
America : DHS preparing for possible Riots / Martial Law on Nov 1st over Food Stamps
With 2015 budget request, Obama will call for an end to era of austerity
By Zachary A. Goldfarb
President Obama’s forthcoming budget request will seek tens of billions of dollars in fresh spending for domestic priorities while abandoning a compromise proposal to tame the national debt in part by trimming Social Security benefits.
With the 2015 budget request, Obama will call for an end to the era of austerity that has dogged much of his presidency and to his efforts to find common ground with Republicans. Instead, the president will focus on pumping new cash into job training, early-childhood education and other programs aimed at bolstering the middle class, providing Democrats with a policy blueprint heading into the midterm elections.
As part of that strategy, Obama will jettison the framework he unveiled last year for a so-called grand bargain that would have raised taxes on the rich and reined in skyrocketing retirement spending. A centerpiece of that framework was a proposal — demanded by GOP leaders — to use a less-generous measure of inflation to calculate Social Security benefits.
The idea infuriated Democrats and never gained much traction with rank-and-file Republicans, who also were unwilling to contemplate tax increases of any kind. On Thursday, administration officials said that the grand-bargain framework remains on the table but that it was time to move on.
“Over the course of last year, Republicans consistently showed a lack of willingness to negotiate on a deficit-reduction deal, refusing to identify even one unfair tax loophole they would be willing to close,” said a White House official, speaking on the condition of anonymity to describe the budget before its official release. “That is not going to stop the president from promoting new policies that should be part of our public debate.”
Republicans said emerging details of the president’s budget prove he was never serious about addressing the nation’s long-term debt problems.
“This reaffirms what has become all too apparent: the president has no interest in doing anything, even modest, to address our looming debt crisis,” Brendan Buck, a spokesman for House Speaker John A. Boehner (R-Ohio), said in a statement. “The one and only idea the president has to offer is even more job-destroying tax hikes, and that non-starter won’t do anything to save the entitlement programs that are critical to so many Americans.”
The new budget request, due out March 4, comes during a relative lull in Washington’s lengthy budget wars. Late last year, Congress approved a two-year spending plan negotiated by the chairmen of the House and Senate Budget committees, Rep. Paul Ryan (R-Wis.) and Sen. Patty Murray (D-Wash.), that would ease automatic cuts, known as the sequester, that were eating away at agency spending. And this month, Congress agreed to forgo another battle over the federal debt limit, voting to suspend its enforcement until March 2015.
The lack of conflict is due in part to the collapse of the deficit as a political issue. While annual budget deficits remain high by historical standards, they have shrunken rapidly over the past few years as the economy recovered and Congress acted to cut spending.
The latest estimates from the nonpartisan Congressional Budget Office show the deficit falling to$514 billion this year and to $478 billion in fiscal 2015 — well below the trillion-dollar deficits the nation racked up during the recession and immediately afterward. But the CBO warned that deficits would start to grow again in a few years.
n recognition of that fact, Obama would retain some parts of his grand-bargain framework, including a proposal to require wealthy seniors to pay more for Medicare benefits than they do now. White House officials said the president continues to believe that entitlement programs such as Medicare and Social Security must be reformed to be sustainable.
Meanwhile, Obama would fully pay for proposed new spending in his budget request, administration officials said, including $56 billion for what they called “Opportunity, Growth and Security Initiative.” The package, which would be split between domestic programs and defense, will include fresh cash for 45 new manufacturing institutes; a “Race to the Top” for states that promote energy efficiency; new job training programs and apprenticeships; and expanded educational programs for preschoolers.
White House officials declined to say Thursday how they would fund the initiative. But Obama has in the past proposed limiting the value of income-tax deductions for wealthy households and closing a variety of corporate tax breaks.
A senior administration official said the budget would also propose new corporate tax rules aimed at preventing companies from moving profits overseas to avoid U.S. taxes. For instance, the rules will seek to limit a company’s ability to borrow domestically — and take large tax deductions on the interest — and then invest the money overseas.
Prohibiting corporations from gaming the tax code has been a popular issue among Senate Democrats and would help emphasize bread-and-butter themes in a year when Democrats will also be focusing on raising the minimum wage and other populist measures.
“President Obama’s budget will be a powerful statement of Democratic principles,” Senate Majority Leader Harry M. Reid (D-Nev.) said in a statement.
Senior administration officials said they decided to chart a more partisan, aspirational path after Republicans failed to respond to the olive branch offered last year. Then, after two years of near-misses on the budget in negotiations with Boehner, Obama still believed a deal was possible.
Now, they said, the president is not so optimistic. And he believes it is up to Republicans to make the next move.
At the same time, the nation’s debt problem has become markedly less urgent, they said, leading the president to back away from the most controversial part of his debt-reduction framework — the proposal to adopt a new measure of inflation known as the chained consumer price index, or chained CPI.
Although other cost-cutting proposals could yet cause tensions within his party, Obama’s decision not to include chained CPI in his budget request immediately won praise from Democrats.
“I applaud President Obama for his important decision to protect Social Security,” Sen. Bernard Sanders, the liberal independent from Vermont, said in a statement. “With the middle class struggling and more people living in poverty than ever before, we cannot afford to make life even more difficult for seniors and some of the most vulnerable people in America.”
Officials said Obama’s budget request will include other nuggets of note. For example, it assumes that an overhaul of the nation’s immigration laws will pass Congress despite deep divisions in Republican ranks. It also assumes that a sharp, but somewhat mysterious slowdown in health-care spending will continue throughout the next decade.
As a result, the White House projects that annual budget deficits will fall below 2 percent of gross domestic product by the end of the decade. That outlook is much rosier than CBO projections, which show the deficit rising to 4 percent of GDP in 2024.
President Obama’s legally-required but constantly-delayed official budget request to Congress will be on Capitol Hill soon. The Washington Post reportsthat “Obama will call for an end to the era of austerity that has dogged much of his presidency.” There is much wrong with this worldview.
The only coherent way in which “austerity” has defined much of President Obama’s presidency is one in which America faced a once-in-a-generation economic crisis that President Obama himself responded to by massively ramping up federal spending over the course of his first few years in office. That increase in federal spending was combined with below-average tax revenue to create massive budget deficits that everyone, including President Obama, agreed were a problem.
If I were a self-absorbed “fact checker” I’d rate this claim half-true. We’ve largely tamed the medium-term deficit through a mixture of tax hikes and spending cuts. Taming the deficit doesn’t mean that it won’t be a problem in the future – and indeed, the Congressional Budget Office’s newest reports confirm that the deficit should still rate highly on the problems that policymakers should be looking to solve.
The CBO’s long-term budget report finds that the deficit will dip in 2014 and 2015 but then will start rising – and will never stop due to our increasing health and retirement obligations. The CBO reports on why that’s bad:
In the past few years, debt held by the public has been significantly greater relative to GDP than at any time since just after World War II, and under current law it will continue to be quite high by historical standards during the next decade. With debt so large, federal spending on interest payments will increase substantially as interest rates rise to more typical levels. Moreover, because federal borrowing generally reduces national saving, the capital stock and wages will be smaller than if debt was lower. In addition, lawmakers would have less flexibility than they otherwise would to use tax and spending policies to respond to unanticipated challenges. Finally, such a large debt poses a greater risk of precipitating a fiscal crisis, during which investors would lose so much confidence in the government’s ability to manage its budget that the government would be unable to borrow at affordable rates.
It’s absurd that anyone would need to have a refresher on this, but apparently it’s needed: more debt is worse than less debt!
The CBO also confirms what has become even more apparent in the wake of Obamacare: the federal government is becoming less of a traditional government and more of a social insurance state, as more and more spending will go toward health and retirement entitlements, as well as the mere cost of servicing debt:
As Jonathan Chait points out, as a practical political reality, fighting the rise of our retirement obligations has about a ten-year lag time. It’s impractical to change the structure of retirement benefits – both Social Security and Medicare – for current and near-future beneficiaries. We need to get started on reforms now.
President Obama may want to put an end to the “era of austerity,” but it’s an era that he explicitly pushed for through his rhetoric, his desire for tax hikes and his compromises on spending cuts. The medium-term deficit might be under control, but that doesn’t mean fighting future deficits should no longer be a priority for policymakers.
Say, did you know that we are living in the age of austerity budgets in Washington? This year’s budget will spend more than last year’s $3.44 trillion, but not as much as Barack Obama requested for FY2014, which was an apparently austere $3.778 trillion. Nevertheless, the Washington Post reports that a newly-emboldened President will demandan end to an “era of austerity” that we haven’t seen in decades with his new FY2015 budget proposal:
President Obama’s forthcoming budget request will seek tens of billions of dollars in fresh spending for domestic priorities while abandoning a compromise proposal to tame the national debt in part by trimming Social Security benefits.
With the 2015 budget request, Obama will call for an end to the era of austerity that has dogged much of his presidency and to his efforts to find common ground with Republicans. Instead, the president will focus on pumping new cash into job training, early-childhood education and other programs aimed at bolstering the middle class, providing Democrats with a policy blueprint heading into the midterm elections. …
Republicans said emerging details of the president’s budget prove he was never serious about addressing the nation’s long-term debt problems.
“This reaffirms what has become all too apparent: the president has no interest in doing anything, even modest, to address our looming debt crisis,” Brendan Buck, a spokesman for House Speaker John A. Boehner (R-Ohio), said in a statement. “The one and only idea the president has to offer is even more job-destroying tax hikes, and that non-starter won’t do anything to save the entitlement programs that are critical to so many Americans.”
The new budget request, due out March 4, comes during a relative lull in Washington’s lengthy budget wars. Late last year, Congress approved a two-year spending plan negotiated by the chairmen of the House and Senate Budget committees, Rep. Paul Ryan (R-Wis.) and Sen. Patty Murray (D-Wash.), that would ease automatic cuts, known as the sequester, that were eating away at agency spending. And this month, Congress agreed to forgo another battle over the federal debt limit, voting to suspend its enforcement until March 2015.
So what will be the top-line number for the FY2015 budget that will end this “era of austerity”? Actually, the Post doesn’t report the top-line outlay number, and the OMB doesn’t have the budget request available on the White House portal yet. One presumes that ending austerity means a demand north of the $3.498 trillion that House Republicans proposed in their budget plan from late last year. It may just be an additional $56 billion over the actual FY2014 levels, which would make it far below his FY2014 proposed budget.
Let’s take a look at all that austerity in the Obama presidency, shall we? Heritage produced this handy graphic in the middle of last year, but it’s very useful now:
Outlays for FY2014 authorized in the recent budget deal are still a bit ambiguous in the reams of data from both Congress and the White House, but CBO estimates it at $3.54 trillion. At that level, we are spending 9.3% more in FY2014 than in FY2008, the last budget signed by George W. Bush (Democrats stalled the FY2009 budget with continuing resolutions until Obama signed an omnibus bill in March 2009 to complete that budget).If the new budget ends “austerity” by returning to Obama’s original top-line outlay demand of last year’s budget request, that will mean an additional increase of federal spending of 6.7% in just one year. If it’s just $56 billion more than the actual FY2014 outlays, then the notion that this ends “austerity” is doubly laughable.
The notion that we’ve been laboring under an “era of austerity” is as ridiculous and out of touch as … well, as most of Obama’s budget requests during his presidency. This one has just as much chance of being enacted, too. The Post suggests that Democrats can use this to beat up Republicans on the campaign trail, but the GOP can easily parry that with this question: “Do you really believe Washington deserves a 6.7% raise after ObamaCare?” Good luck winning on this issue.
OBAMA BUDGET COULD BE COSTLY TO DEMS The White House is teasing the president’s soon-to-be released blueprint for the next federal fiscal year. In a nod to his core liberal supporters, the president has dropped a prior nod to entitlement fixes, so-called “chained CPI,” a change in how to calculate the size of future increases to Social Security and other programs. The president is sucking up to his political base, the members of which consider the current trajectory for future hikes to be sacrosanct. That’s pretty good politics, especially since Obama did not seem particularly enthused about the idea before and that there is zero chance that this budget or any budget will be passed this election year. Republicans may be harrumphing about the president’s “unserious” approach to the debt, but it’s not like they thought otherwise before. Nor will the House GOP budget be anything more than pipe dreams. Poof!
You call that austerity? – Many pixels are being slaughtered to discuss the president’s irrelevant budget. Why? Partly, it’s because reporters salivate over anything that looks exclusive or new in a city where governing goes to die. Here in the great gridlock desert, this stuff may pass for news. But also because liberals are excited to see their champion drop the smokescreen of deficit concern. The prevailing Democratic wisdom is that deficits don’t matter and that Republicans ought to shut up about them. The WaPo enthused: “With the 2015 budget request, Obama will call for an end to the era of austerity that has dogged much of his presidency and to his efforts to find common ground with Republicans.” Austerity? The federal government continues to spend way more than it takes in and outlays in the Obama era have increased. From 2009 through 2012, the administration spent about $3.5 trillion a year. The approximate federal spending for the fiscal year that ended in October was $3.62 trillion. The estimate for the current year: $3.78 trillion. The Greeks would love to get some austerity like that.
Unicorns, rainbows and midterms – The WaPo goes on to say that instead of worrying about deficits, “…the president will focus on pumping new cash into job training, early-childhood education and other programs aimed at bolstering the middle class, providing Democrats with a policy blueprint heading into the midterm elections… The lack of conflict is due in part to the collapse of the deficit as a political issue. While annual budget deficits remain high by historical standards, they have shrunken rapidly over the past few years as the economy recovered and Congress acted to cut spending.” Wait. What? A Fox News Poll at the end of January showed that more voters said the federal deficit and Social Security outranked terrorism, foreign policy, guns and immigration as the most important issues for the government. Only the economy and health care were higher on the list of voter concerns. Nothing come close to those two, but do Democrats really think that they are off the hook for being the party of more borrowing and spending? Just because Republicans scampered away from the last debt limit lift fight doesn’t mean this isn’t potent stuff. If Democrats believe that borrowing more than half-a-trillion dollars can be turned into a political plus, they must be back to smoking Hopium. And remember, we haven’t even heard about all of the new taxes that the president will propose. Democrats are marching forward with the banner of bigger government aloft at precisely the moment Americans are fed up with ObamaCare the last big government initiative the Obama Democrats bequeathed them.
Story 2: The Economy Still Stagnating As The 10 Million Plus Jobs Gap Widens — Videos
Making Sense of Today’s January Jobs Report
February 7th 2014 CNBC Stock Market Squawk Box (January Jobs Report)
Employment Level
145,224,000
Series Id:           LNS12000000
Seasonally Adjusted
Series title:        (Seas) Employment Level
Labor force status:  Employed
Type of data:        Number in thousands
Age:                 16 years and over
Year
Jan
Feb
Mar
Apr
May
Jun
Jul
Aug
Sep
Oct
Nov
Dec
Annual
2000
136559(1)
136598
136701
137270
136630
136940
136531
136662
136893
137088
137322
137614
2001
137778
137612
137783
137299
137092
136873
137071
136241
136846
136392
136238
136047
2002
135701
136438
136177
136126
136539
136415
136413
136705
137302
137008
136521
136426
2003
137417(1)
137482
137434
137633
137544
137790
137474
137549
137609
137984
138424
138411
2004
138472(1)
138542
138453
138680
138852
139174
139556
139573
139487
139732
140231
140125
2005
140245(1)
140385
140654
141254
141609
141714
142026
142434
142401
142548
142499
142752
2006
143150(1)
143457
143741
143761
144089
144353
144202
144625
144815
145314
145534
145970
2007
146028(1)
146057
146320
145586
145903
146063
145905
145682
146244
145946
146595
146273
2008
146378(1)
146156
146086
146132
145908
145737
145532
145203
145076
144802
144100
143369
2009
142152(1)
141640
140707
140656
140248
140009
139901
139492
138818
138432
138659
138013
2010
138451(1)
138599
138752
139309
139247
139148
139179
139427
139393
139111
139030
139266
2011
139287(1)
139422
139655
139622
139653
139409
139524
139904
140154
140335
140747
140836
2012
141677(1)
141943
142079
141963
142257
142432
142272
142204
142947
143369
143233
143212
2013
143384(1)
143464
143393
143676
143919
144075
144285
144179
144270
143485
144443
144586
2014
145224(1)
Civilian Labor Force
155,460,000
Series Id:           LNS11000000
Seasonally Adjusted
Series title:        (Seas) Civilian Labor Force Level
Labor force status:  Civilian labor force
Type of data:        Number in thousands
Age:                 16 years and over
Year
Jan
Feb
Mar
Apr
May
Jun
Jul
Aug
Sep
Oct
Nov
Dec
Annual
2000
142267(1)
142456
142434
142751
142388
142591
142278
142514
142518
142622
142962
143248
2001
143800
143701
143924
143569
143318
143357
143654
143284
143989
144086
144240
144305
2002
143883
144653
144481
144725
144938
144808
144803
145009
145552
145314
145041
145066
2003
145937(1)
146100
146022
146474
146500
147056
146485
146445
146530
146716
147000
146729
2004
146842(1)
146709
146944
146850
147065
147460
147692
147564
147415
147793
148162
148059
2005
148029(1)
148364
148391
148926
149261
149238
149432
149779
149954
150001
150065
150030
2006
150214(1)
150641
150813
150881
151069
151354
151377
151716
151662
152041
152406
152732
2007
153144(1)
152983
153051
152435
152670
153041
153054
152749
153414
153183
153835
153918
2008
154063(1)
153653
153908
153769
154303
154313
154469
154641
154570
154876
154639
154655
2009
154210(1)
154538
154133
154509
154747
154716
154502
154307
153827
153784
153878
153111
2010
153404(1)
153720
153964
154642
154106
153631
153706
154087
153971
153631
154127
153639
2011
153198(1)
153280
153403
153566
153526
153379
153309
153724
154059
153940
154072
153927
2012
154328(1)
154826
154811
154565
154946
155134
154970
154669
155018
155507
155279
155485
2013
155699(1)
155511
155099
155359
155609
155822
155693
155435
155473
154625
155284
154937
2014
155460(1)
Labor Force Participation Rate
63.0%
Series Id:           LNS11300000
Seasonally Adjusted
Series title:        (Seas) Labor Force Participation Rate
Labor force status:  Civilian labor force participation rate
Type of data:        Percent or rate
Age:                 16 years and over
Year
Jan
Feb
Mar
Apr
May
Jun
Jul
Aug
Sep
Oct
Nov
Dec
Annual
2000
67.3
67.3
67.3
67.3
67.1
67.1
66.9
66.9
66.9
66.8
66.9
67.0
2001
67.2
67.1
67.2
66.9
66.7
66.7
66.8
66.5
66.8
66.7
66.7
66.7
2002
66.5
66.8
66.6
66.7
66.7
66.6
66.5
66.6
66.7
66.6
66.4
66.3
2003
66.4
66.4
66.3
66.4
66.4
66.5
66.2
66.1
66.1
66.1
66.1
65.9
2004
66.1
66.0
66.0
65.9
66.0
66.1
66.1
66.0
65.8
65.9
66.0
65.9
2005
65.8
65.9
65.9
66.1
66.1
66.1
66.1
66.2
66.1
66.1
66.0
66.0
2006
66.0
66.1
66.2
66.1
66.1
66.2
66.1
66.2
66.1
66.2
66.3
66.4
2007
66.4
66.3
66.2
65.9
66.0
66.0
66.0
65.8
66.0
65.8
66.0
66.0
2008
66.2
66.0
66.1
65.9
66.1
66.1
66.1
66.1
66.0
66.0
65.9
65.8
2009
65.7
65.8
65.6
65.7
65.7
65.7
65.5
65.4
65.1
65.0
65.0
64.6
2010
64.8
64.9
64.9
65.2
64.9
64.6
64.6
64.7
64.6
64.4
64.6
64.3
2011
64.2
64.2
64.2
64.2
64.2
64.0
64.0
64.1
64.2
64.1
64.1
64.0
2012
63.7
63.9
63.8
63.7
63.8
63.8
63.7
63.5
63.6
63.7
63.6
63.6
2013
63.6
63.5
63.3
63.4
63.4
63.5
63.4
63.2
63.2
62.8
63.0
62.8
2014
63.0
Unemployment Level
10,236,000
Series Id:           LNS13000000
Seasonally Adjusted
Series title:        (Seas) Unemployment Level
Labor force status:  Unemployed
Type of data:        Number in thousands
Age:                 16 years and over
Year
Jan
Feb
Mar
Apr
May
Jun
Jul
Aug
Sep
Oct
Nov
Dec
Annual
2000
5708
5858
5733
5481
5758
5651
5747
5853
5625
5534
5639
5634
2001
6023
6089
6141
6271
6226
6484
6583
7042
7142
7694
8003
8258
2002
8182
8215
8304
8599
8399
8393
8390
8304
8251
8307
8520
8640
2003
8520
8618
8588
8842
8957
9266
9011
8896
8921
8732
8576
8317
2004
8370
8167
8491
8170
8212
8286
8136
7990
7927
8061
7932
7934
2005
7784
7980
7737
7672
7651
7524
7406
7345
7553
7453
7566
7279
2006
7064
7184
7072
7120
6980
7001
7175
7091
6847
6727
6872
6762
2007
7116
6927
6731
6850
6766
6979
7149
7067
7170
7237
7240
7645
2008
7685
7497
7822
7637
8395
8575
8937
9438
9494
10074
10538
11286
2009
12058
12898
13426
13853
14499
14707
14601
14814
15009
15352
15219
15098
2010
14953
15121
15212
15333
14858
14483
14527
14660
14578
14520
15097
14373
2011
13910
13858
13748
13944
13873
13971
13785
13820
13905
13604
13326
13090
2012
12650
12883
12732
12603
12689
12702
12698
12464
12070
12138
12045
12273
2013
12315
12047
11706
11683
11690
11747
11408
11256
11203
11140
10841
10351
2014
10236
Unemployment Rate
6.6%
Series Id:           LNS14000000
Seasonally Adjusted
Series title:        (Seas) Unemployment Rate
Labor force status:  Unemployment rate
Type of data:        Percent or rate
Age:                 16 years and over
Year
Jan
Feb
Mar
Apr
May
Jun
Jul
Aug
Sep
Oct
Nov
Dec
Annual
2000
4.0
4.1
4.0
3.8
4.0
4.0
4.0
4.1
3.9
3.9
3.9
3.9
2001
4.2
4.2
4.3
4.4
4.3
4.5
4.6
4.9
5.0
5.3
5.5
5.7
2002
5.7
5.7
5.7
5.9
5.8
5.8
5.8
5.7
5.7
5.7
5.9
6.0
2003
5.8
5.9
5.9
6.0
6.1
6.3
6.2
6.1
6.1
6.0
5.8
5.7
2004
5.7
5.6
5.8
5.6
5.6
5.6
5.5
5.4
5.4
5.5
5.4
5.4
2005
5.3
5.4
5.2
5.2
5.1
5.0
5.0
4.9
5.0
5.0
5.0
4.9
2006
4.7
4.8
4.7
4.7
4.6
4.6
4.7
4.7
4.5
4.4
4.5
4.4
2007
4.6
4.5
4.4
4.5
4.4
4.6
4.7
4.6
4.7
4.7
4.7
5.0
2008
5.0
4.9
5.1
5.0
5.4
5.6
5.8
6.1
6.1
6.5
6.8
7.3
2009
7.8
8.3
8.7
9.0
9.4
9.5
9.5
9.6
9.8
10.0
9.9
9.9
2010
9.7
9.8
9.9
9.9
9.6
9.4
9.5
9.5
9.5
9.5
9.8
9.4
2011
9.1
9.0
9.0
9.1
9.0
9.1
9.0
9.0
9.0
8.8
8.6
8.5
2012
8.2
8.3
8.2
8.2
8.2
8.2
8.2
8.1
7.8
7.8
7.8
7.9
2013
7.9
7.7
7.5
7.5
7.5
7.5
7.3
7.2
7.2
7.2
7.0
6.7
2014
6.6
Employment-Population Ratio
58.8%
Series Id:           LNS12300000
Seasonally Adjusted
Series title:        (Seas) Employment-Population Ratio
Labor force status:  Employment-population ratio
Type of data:        Percent or rate
Age:                 16 years and over
Year
Jan
Feb
Mar
Apr
May
Jun
Jul
Aug
Sep
Oct
Nov
Dec
Annual
2000
64.6
64.6
64.6
64.7
64.4
64.5
64.2
64.2
64.2
64.2
64.3
64.4
2001
64.4
64.3
64.3
64.0
63.8
63.7
63.7
63.2
63.5
63.2
63.0
62.9
2002
62.7
63.0
62.8
62.7
62.9
62.7
62.7
62.7
63.0
62.7
62.5
62.4
2003
62.5
62.5
62.4
62.4
62.3
62.3
62.1
62.1
62.0
62.1
62.3
62.2
2004
62.3
62.3
62.2
62.3
62.3
62.4
62.5
62.4
62.3
62.3
62.5
62.4
2005
62.4
62.4
62.4
62.7
62.8
62.7
62.8
62.9
62.8
62.8
62.7
62.8
2006
62.9
63.0
63.1
63.0
63.1
63.1
63.0
63.1
63.1
63.3
63.3
63.4
2007
63.3
63.3
63.3
63.0
63.0
63.0
62.9
62.7
62.9
62.7
62.9
62.7
2008
62.9
62.8
62.7
62.7
62.5
62.4
62.2
62.0
61.9
61.7
61.4
61.0
2009
60.6
60.3
59.9
59.8
59.6
59.4
59.3
59.1
58.7
58.5
58.6
58.3
2010
58.5
58.5
58.5
58.7
58.6
58.5
58.5
58.6
58.5
58.3
58.2
58.3
2011
58.4
58.4
58.4
58.4
58.4
58.2
58.2
58.3
58.4
58.4
58.5
58.5
2012
58.5
58.5
58.6
58.5
58.6
58.6
58.5
58.4
58.6
58.8
58.7
58.6
2013
58.6
58.6
58.5
58.6
58.7
58.7
58.7
58.6
58.6
58.2
58.6
58.6
2014
58.8
Unemployment Rate – 16-19 Yrs
20.7%
Series Id:           LNS14000012
Seasonally Adjusted
Series title:        (Seas) Unemployment Rate - 16-19 yrs.
Labor force status:  Unemployment rate
Type of data:        Percent or rate
Age:                 16 to 19 years
Year
Jan
Feb
Mar
Apr
May
Jun
Jul
Aug
Sep
Oct
Nov
Dec
Annual
2000
12.7
13.8
13.3
12.6
12.8
12.3
13.4
14.0
13.0
12.8
13.0
13.2
2001
13.8
13.7
13.8
13.9
13.4
14.2
14.4
15.6
15.2
16.0
15.9
17.0
2002
16.5
16.0
16.6
16.7
16.6
16.7
16.8
17.0
16.3
15.1
17.1
16.9
2003
17.2
17.2
17.8
17.7
17.9
19.0
18.2
16.6
17.6
17.2
15.7
16.2
2004
17.0
16.5
16.8
16.6
17.1
17.0
17.8
16.7
16.6
17.4
16.4
17.6
2005
16.2
17.5
17.1
17.8
17.8
16.3
16.1
16.1
15.5
16.1
17.0
14.9
2006
15.1
15.3
16.1
14.6
14.0
15.8
15.9
16.0
16.3
15.2
14.8
14.6
2007
14.8
14.9
14.9
15.9
15.9
16.3
15.3
15.9
15.9
15.4
16.2
16.8
2008
17.8
16.6
16.1
15.9
19.0
19.2
20.7
18.6
19.1
20.0
20.3
20.5
2009
20.7
22.3
22.2
22.2
23.4
24.7
24.3
25.0
25.9
27.2
26.9
26.7
2010
26.0
25.6
26.2
25.4
26.5
26.0
25.9
25.6
25.8
27.3
24.8
25.3
2011
25.5
24.1
24.3
24.5
23.9
24.8
24.8
25.1
24.5
24.2
24.1
23.3
2012
23.5
23.8
24.8
24.6
24.2
23.7
23.7
24.4
23.8
23.8
23.9
24.0
2013
23.5
25.2
23.9
23.7
24.1
23.8
23.4
22.6
21.3
22.0
20.8
20.2
2014
20.7
Average Weeks Unemployed
35.4 Weeks
Series Id:           LNS13008275
Seasonally Adjusted
Series title:        (Seas) Average Weeks Unemployed
Labor force status:  Unemployed
Type of data:        Number of weeks
Age:                 16 years and over
Year
Jan
Feb
Mar
Apr
May
Jun
Jul
Aug
Sep
Oct
Nov
Dec
Annual
2000
13.1
12.6
12.7
12.4
12.6
12.3
13.4
12.9
12.2
12.7
12.4
12.5
2001
12.7
12.8
12.8
12.4
12.1
12.7
12.9
13.3
13.2
13.3
14.3
14.5
2002
14.7
15.0
15.4
16.3
16.8
16.9
16.9
16.5
17.6
17.8
17.6
18.5
2003
18.5
18.5
18.1
19.4
19.0
19.9
19.7
19.2
19.5
19.3
19.9
19.8
2004
19.9
20.1
19.8
19.6
19.8
20.5
18.8
18.8
19.4
19.5
19.7
19.4
2005
19.5
19.1
19.5
19.6
18.6
17.9
17.6
18.4
17.9
17.9
17.5
17.5
2006
16.9
17.8
17.1
16.7
17.1
16.6
17.1
17.1
17.1
16.3
16.2
16.1
2007
16.3
16.7
17.8
16.9
16.6
16.5
17.2
17.0
16.3
17.0
17.3
16.6
2008
17.5
16.9
16.5
16.9
16.6
17.1
17.0
17.7
18.6
19.9
18.9
19.9
2009
19.8
20.2
20.9
21.7
22.4
23.9
25.1
25.3
26.6
27.5
28.9
29.7
2010
30.3
29.9
31.6
33.3
33.9
34.5
33.8
33.6
33.4
34.2
33.9
34.8
2011
37.2
37.5
39.2
38.7
39.5
39.7
40.4
40.2
40.2
39.1
40.3
40.7
2012
40.1
40.0
39.4
39.3
39.6
40.0
38.8
39.1
39.4
40.3
39.2
38.0
2013
35.4
36.9
37.0
36.6
36.9
35.7
36.7
37.0
36.8
36.0
37.1
37.1
2014
35.4
Median Weeks Unemployed
16.0 weeks
Series Id:           LNS13008276
Seasonally Adjusted
Series title:        (Seas) Median Weeks Unemployed
Labor force status:  Unemployed
Type of data:        Number of weeks
Age:                 16 years and over
Year
Jan
Feb
Mar
Apr
May
Jun
Jul
Aug
Sep
Oct
Nov
Dec
Annual
2000
5.8
6.1
6.0
6.1
5.8
5.7
6.0
6.3
5.2
6.1
6.1
6.0
2001
5.8
6.1
6.6
5.9
6.3
6.0
6.8
6.9
7.2
7.3
7.7
8.2
2002
8.4
8.3
8.4
8.9
9.5
11.0
8.9
9.0
9.5
9.6
9.3
9.6
2003
9.6
9.5
9.7
10.2
9.9
11.5
10.3
10.1
10.2
10.4
10.3
10.4
2004
10.6
10.2
10.2
9.5
9.9
11.0
8.9
9.2
9.6
9.5
9.7
9.5
2005
9.4
9.2
9.3
9.0
9.1
9.0
8.8
9.2
8.4
8.6
8.5
8.7
2006
8.6
9.1
8.7
8.4
8.5
7.3
8.0
8.4
8.0
7.9
8.3
7.5
2007
8.3
8.5
9.1
8.6
8.2
7.7
8.7
8.8
8.7
8.4
8.6
8.4
2008
9.0
8.7
8.7
9.4
7.9
9.0
9.7
9.7
10.2
10.4
9.8
10.5
2009
10.7
11.7
12.3
13.1
14.2
17.2
16.0
16.3
17.8
18.9
19.8
20.1
2010
20.0
19.9
20.5
22.1
22.3
25.0
22.2
20.9
20.2
21.4
21.0
22.0
2011
21.5
21.2
21.7
20.9
21.6
22.1
21.8
22.2
21.9
20.7
20.9
20.6
2012
20.9
20.0
19.6
19.2
19.8
19.8
17.2
18.2
18.7
20.0
18.6
17.8
2013
16.0
17.7
18.1
17.3
16.9
16.2
15.8
16.5
16.4
16.5
17.0
17.1
2014
16.0
Not in Labor Force, Searched for Work and Available
2,592,000
Series Id:                       LNU05026642
Not Seasonally Adjusted
Series title:                    (Unadj) Not in Labor Force, Searched For Work and Available
Labor force status:              Not in labor force
Type of data:                    Number in thousands
Age:                             16 years and over
Job desires/not in labor force:  Want a job now
Reasons not in labor force:      Available to work now
Year
Jan
Feb
Mar
Apr
May
Jun
Jul
Aug
Sep
Oct
Nov
Dec
Annual
2000
1207
1281
1219
1216
1113
1142
1172
1097
1166
1044
1100
1125
1157
2001
1295
1337
1109
1131
1157
1170
1232
1364
1335
1398
1331
1330
1266
2002
1532
1423
1358
1397
1467
1380
1507
1456
1501
1416
1401
1432
1439
2003
1598
1590
1577
1399
1428
1468
1566
1665
1544
1586
1473
1483
1531
2004
1670
1691
1643
1526
1533
1492
1557
1587
1561
1647
1517
1463
1574
2005
1804
1673
1588
1511
1428
1583
1516
1583
1438
1414
1415
1589
1545
2006
1644
1471
1468
1310
1388
1584
1522
1592
1299
1478
1366
1252
1448
2007
1577
1451
1385
1391
1406
1454
1376
1365
1268
1364
1363
1344
1395
2008
1729
1585
1352
1414
1416
1558
1573
1640
1604
1637
1947
1908
1614
2009
2130
2051
2106
2089
2210
2176
2282
2270
2219
2373
2323
2486
2226
2010
2539
2527
2255
2432
2223
2591
2622
2370
2548
2602
2531
2609
2487
2011
2800
2730
2434
2466
2206
2680
2785
2575
2511
2555
2591
2540
2573
2012
2809
2608
2352
2363
2423
2483
2529
2561
2517
2433
2505
2614
2516
2013
2443
2588
2326
2347
2164
2582
2414
2342
2302
2283
2096
2427
2360
2014
2592
Total Unemployment Rate U-6
12.7%
Series Id:           LNS13327709
Seasonally Adjusted
Series title:        (seas) Total unemployed, plus all marginally attached workers plus total employed part time for economic reasons, as a percent of all civilian labor force plus all marginally attached workers
Labor force status:  Aggregated totals unemployed
Type of data:        Percent or rate
Age:                 16 years and over
Percent/rates:       Unemployed and mrg attached and pt for econ reas as percent of labor force plus marg attached
Year
Jan
Feb
Mar
Apr
May
Jun
Jul
Aug
Sep
Oct
Nov
Dec
Annual
2000
7.1
7.2
7.1
6.9
7.1
7.0
7.0
7.1
7.0
6.8
7.1
6.9
2001
7.3
7.4
7.3
7.4
7.5
7.9
7.8
8.1
8.7
9.3
9.4
9.6
2002
9.5
9.5
9.4
9.7
9.5
9.5
9.6
9.6
9.6
9.6
9.7
9.8
2003
10.0
10.2
10.0
10.2
10.1
10.3
10.3
10.1
10.4
10.2
10.0
9.8
2004
9.9
9.7
10.0
9.6
9.6
9.5
9.5
9.4
9.4
9.7
9.4
9.2
2005
9.3
9.3
9.1
8.9
8.9
9.0
8.8
8.9
9.0
8.7
8.7
8.6
2006
8.4
8.4
8.2
8.1
8.2
8.4
8.5
8.4
8.0
8.2
8.1
7.9
2007
8.4
8.2
8.0
8.2
8.2
8.3
8.4
8.4
8.4
8.4
8.4
8.8
2008
9.2
9.0
9.1
9.2
9.7
10.1
10.5
10.8
11.0
11.8
12.6
13.6
2009
14.2
15.2
15.8
15.9
16.5
16.5
16.4
16.7
16.7
17.1
17.1
17.1
2010
16.7
17.0
17.1
17.2
16.6
16.4
16.4
16.5
16.8
16.6
16.9
16.6
2011
16.1
16.0
15.9
16.1
15.8
16.1
16.0
16.1
16.3
15.9
15.6
15.2
2012
15.1
15.0
14.5
14.6
14.8
14.8
14.9
14.7
14.7
14.4
14.4
14.4
2013
14.4
14.3
13.8
13.9
13.8
14.2
13.9
13.6
13.6
13.7
13.1
13.1
2014
12.7
Employment Situation Summary
Transmission of material in this release is embargoed until                      USDL-14-0168
8:30 a.m. (EST) Friday, February 7, 2014

Technical information:
Household data:        (202) 691-6378  •  cpsinfo@bls.gov  •  www.bls.gov/cps
Establishment data:    (202) 691-6555  •  cesinfo@bls.gov  •  www.bls.gov/ces

Media contact:         (202) 691-5902  •  PressOffice@bls.gov

                                 THE EMPLOYMENT SITUATION -- JANUARY 2014

Total nonfarm payroll employment rose by 113,000 in January, and the unemployment rate
was little changed at 6.6 percent, the U.S. Bureau of Labor Statistics reported today.
Employment grew in construction, manufacturing, wholesale trade, and mining.

  ------------------------------------------------------------------------------------
 |                        Changes to the Employment Situation Data                    |
 |                                                                                    |
 |Establishment survey data have been revised as a result of the annual benchmarking  |
 |process and the updating of seasonal adjustment factors. Also, household survey data|
 |for January 2014 reflect updated population estimates. See the notes at the end of  |
 |this release for more information about these changes.                              |
 |                                                                                    |
  ------------------------------------------------------------------------------------

Household Survey Data

Both the number of unemployed persons, at 10.2 million, and the unemployment rate, at
6.6 percent, changed little in January. Since October, the jobless rate has decreased by
0.6 percentage point. (See table A-1.)  (See the note and tables B and C for information
about the effect of annual population adjustments to the household survey estimates.)

Among the major worker groups, the unemployment rates for adult men (6.2 percent), adult
women (5.9 percent), teenagers (20.7 percent), whites (5.7 percent), blacks (12.1 percent),
and Hispanics (8.4 percent) showed little change in January. The jobless rate for Asians
was 4.8 percent (not seasonally adjusted), down by 1.7 percentage points over the year.
(See tables A-1, A-2, and A-3.)

The number of long-term unemployed (those jobless for 27 weeks or more), at 3.6 million,
declined by 232,000 in January. These individuals accounted for 35.8 percent of the
unemployed. The number of long-term unemployed has declined by 1.1 million over the year.
(See table A-12.)

After accounting for the annual adjustment to the population controls, the civilian labor
force rose by 499,000 in January, and the labor force participation rate edged up to 63.0
percent. Total employment, as measured by the household survey, increased by 616,000 over
the month, and the employment-population ratio increased by 0.2 percentage point to 58.8
percent. (See table A-1. For additional information about the effects of the population
adjustments, see table C.)

The number of persons employed part time for economic reasons (sometimes referred to as
involuntary part-time workers) fell by 514,000 to 7.3 million in January. These individuals
were working part time because their hours had been cut back or because they were unable to
find full-time work. (See table A-8.)

In January, 2.6 million persons were marginally attached to the labor force, little changed
from a year earlier. (The data are not seasonally adjusted.) These individuals were not in
the labor force, wanted and were available for work, and had looked for a job sometime in
the prior 12 months. They were not counted as unemployed because they had not searched for
work in the 4 weeks preceding the survey. (See table A-16.)

Among the marginally attached, there were 837,000 discouraged workers in January, about
unchanged from a year earlier. Discouraged workers are persons not currently looking for
work because they believe no jobs are available for them. The remaining 1.8 million persons
marginally attached to the labor force in January had not searched for work for reasons such
as school attendance or family responsibilities. (See table A-16.)

Establishment Survey Data

Total nonfarm payroll employment increased by 113,000 in January. In 2013, employment growth
averaged 194,000 per month. In January, job gains occurred in construction, manufacturing,
wholesale trade, and mining. (See table B-1.)

Construction added 48,000 jobs over the month, more than offsetting a decline of 22,000 in
December. In January, job gains occurred in both residential and nonresidential building
(+13,000 and +8,000, respectively) and in nonresidential specialty trade contractors
(+13,000). Heavy and civil engineering construction also added 10,000 jobs.

Employment in manufacturing increased in January (+21,000). Over the month, job gains
occurred in machinery (+7,000), wood products (+5,000), and motor vehicles and parts
(+5,000). Manufacturing added an average of 7,000 jobs per month in 2013.

In January, wholesale trade added 14,000 jobs, with most of the increase occurring in
nondurable goods (+10,000).

Mining added 7,000 jobs in January, compared with an average monthly gain of 2,000 jobs
in 2013.

Employment in professional and business services continued to trend up in January (+36,000).
The industry added an average of 55,000 jobs per month in 2013. Within the industry,
professional and technical services added 20,000 jobs in January.

Leisure and hospitality employment continued to trend up over the month (+24,000). Job
growth in the industry averaged 38,000 per month in 2013.

Employment in health care was essentially unchanged in January for the second consecutive
month.  Health care added an average of 17,000 jobs per month in 2013.

Employment in retail trade changed little in January (-13,000). Within the industry, sporting
goods, hobby, book, and music stores lost 22,000 jobs, offsetting job gains in the prior 3
months. In January, motor vehicle and parts dealers added 7,000 jobs.

In January, federal government employment decreased by 12,000; the U.S. Postal Service
accounted for most of this decline (-9,000).

Employment in other major industries, including transportation and warehousing, information,
and financial activities, showed little or no change over the month.

In January, the average workweek for all employees on private nonfarm payrolls was unchanged
at 34.4 hours. The manufacturing workweek declined by 0.2 hour to 40.7 hours, and factory
overtime edged down by 0.1 hour to 3.4 hours. The average workweek for production and
nonsupervisory employees on private nonfarm payrolls was unchanged at 33.5 hours. (See
tables B-2 and B-7.)

Average hourly earnings for all employees on private nonfarm payrolls rose by 5 cents to
$24.21. Over the year, average hourly earnings have risen by 46 cents, or 1.9 percent. In
January, average hourly earnings of private-sector production and nonsupervisory employees
increased by 6 cents to $20.39. (See tables B-3 and B-8.)

The change in total nonfarm payroll employment for November was revised from +241,000 to
+274,000, and the change for December was revised from +74,000 to +75,000. With these
revisions, employment gains in November and December were 34,000 higher than previously
reported. Monthly revisions result from additional reports received from businesses since
the last published estimates and the monthly recalculation of seasonal factors. The annual
benchmark process also contributed to the revisions in this news release.

_____________
The Employment Situation for February is scheduled to be released on Friday, March 7, 2014,
at 8:30 a.m. (EST).

                                  Revisions to Establishment Survey Data

In accordance with annual practice, the establishment survey data released today have been
benchmarked to reflect comprehensive counts of payroll jobs for March 2013. These counts
are derived principally from the Quarterly Census of Employment and Wages (QCEW), which
enumerates jobs covered by the UI tax system. The benchmark process results in revisions
to not seasonally adjusted data from April 2012 forward. Seasonally adjusted data from
January 2009 forward are subject to revision. In addition, data for some series prior to
2009, both seasonally adjusted and unadjusted, incorporate revisions.

The total nonfarm employment level for March 2013 was revised upward by 369,000 (+347,000
on a not seasonally adjusted basis, or 0.3 percent). The average benchmark revision over
the past 10 years was plus or minus 0.3 percent.

This revision incorporates the reclassification of jobs in the QCEW. Private household
employment is out of scope for the establishment survey. The QCEW reclassified some
private household employment into an industry that is in scope for the establishment
survey--services for the elderly and persons with disabilities. This reclassification
accounted for an increase of 466,000 jobs in the establishment survey. This increase of
466,000 associated with reclassification was offset by survey error of -119,000 for a
total net benchmark revision of +347,000 on a not seasonally adjusted basis. Historical
time series have been reconstructed to incorporate these revisions.

The effect of these revisions on the underlying trend in nonfarm payroll employment was
minor. For example, the over-the-year change in total nonfarm employment for 2013 was
revised from 2,186,000 to 2,322,000 seasonally adjusted. Table A presents revised total
nonfarm employment data on a seasonally adjusted basis for January through December 2013.

All revised historical CES data, as well as an article that discusses the benchmark and
post-benchmark revisions and other technical issues can be accessed through the CES
homepage at www.bls.gov/ces/. Information on the data released today also may be obtained
by calling (202) 691-6555.

Table A. Revisions in total nonfarm employment, January-December 2013, seasonally adjusted
(Numbers in thousands)

------------------------------------------------------------------------------------------
                    |                                    |
                    |                Level               |      Over-the-month change
                    |---------------------------------------------------------------------
    Year and month  |    As     |           |            |    As    |         |
                    |previously |    As     | Difference |previously|   As    | Difference
                    |published  |  revised  |            |published | revised |
------------------------------------------------------------------------------------------
                    |           |           |            |          |         |
          2013      |           |           |            |          |         |
                    |           |           |            |          |         |
 January............|  134,839  |  135,261  |     422    |    148   |    197  |      49
 February...........|  135,171  |  135,541  |     370    |    332   |    280  |     -52
 March..............|  135,313  |  135,682  |     369    |    142   |    141  |      -1
 April..............|  135,512  |  135,885  |     373    |    199   |    203  |       4
 May................|  135,688  |  136,084  |     396    |    176   |    199  |      23
 June...............|  135,860  |  136,285  |     425    |    172   |    201  |      29
 July...............|  135,949  |  136,434  |     485    |     89   |    149  |      60
 August.............|  136,187  |  136,636  |     449    |    238   |    202  |     -36
 September..........|  136,362  |  136,800  |     438    |    175   |    164  |     -11
 October............|  136,562  |  137,037  |     475    |    200   |    237  |      37
 November...........|  136,803  |  137,311  |     508    |    241   |    274  |      33
 December (p).......|  136,877  |  137,386  |     509    |     74   |     75  |       1
------------------------------------------------------------------------------------------

   p = preliminary

                Adjustments to Population Estimates for the Household Survey

Effective with data for January 2014, updated population estimates have been used in the
household survey. Population estimates for the household survey are developed by the U.S.
Census Bureau. Each year, the Census Bureau updates the estimates to reflect new information
and assumptions about the growth of the population since the previous decennial census. The
change in population reflected in the new estimates results from adjustments for net
international migration, updated vital statistics and other information, and some
methodological changes in the estimation process.

In accordance with usual practice, BLS will not revise the official household survey estimates
for December 2013 and earlier months. To show the impact of the population adjustments, however,
differences in selected December 2013 labor force series based on the old and new population
estimates are shown in table B.

The adjustments increased the estimated size of the civilian noninstitutional population in
December by 2,000, the civilian labor force by 24,000, employment by 22,000, and unemployment
by 2,000. The number of persons not in the labor force was reduced by 22,000. The total
unemployment rate, employment-population ratio, and labor force participation rate were
unaffected.

Data users are cautioned that these annual population adjustments can affect the comparability
of household data series over time. Table C shows the effect of the introduction of new
population estimates on the comparison of selected labor force measures between December 2013
and January 2014. Additional information on the population adjustments and their effect on
national labor force estimates is available at www.bls.gov/cps/cps14adj.pdf.

Table B. Effect of the updated population controls on December 2013 estimates by sex, race, and
Hispanic or Latino ethnicity, not seasonally adjusted
(Numbers in thousands)

__________________________________________________________________________________________________
                                        |      |     |      |       |        |       |
                                        |      |     |      |       |  Black |       |
                                        |      |     |      |       |    or  |       |  Hispanic
                  Category              | Total| Men | Women| White | African| Asian | or Latino
                                        |      |     |      |       |American|       | ethnicity
                                        |      |     |      |       |        |       |
________________________________________|______|_____|______|_______|________|_______|____________
                                        |      |     |      |       |        |       |
  Civilian noninstitutional population..|    2 |  29 |  -27 |   -65 |     48 |    33 |     -57
    Civilian labor force................|   24 |  24 |    0 |   -17 |     34 |    15 |     -38
      Participation rate................|   .0 |  .0 |   .0 |    .0 |     .0 |    .0 |      .0
     Employed...........................|   22 |  22 |    0 |   -16 |     31 |    14 |     -34
      Employment-population ratio.......|   .0 |  .0 |   .0 |    .0 |     .0 |    .0 |      .0
     Unemployed.........................|    2 |   3 |   -1 |    -1 |      4 |     1 |      -4
      Unemployment rate.................|   .0 |  .0 |   .0 |    .0 |     .0 |    .0 |      .0
    Not in labor force..................|  -22 |   4 |  -27 |   -48 |     14 |    18 |     -18
________________________________________|______|_____|______|_______|________|_______|____________

   NOTE: Detail may not sum to totals because of rounding. Estimates for the above race groups
(white, black or African American, and Asian) do not sum to totals because data are not presented
for all races. Persons whose ethnicity is identified as Hispanic or Latino may be of any race.

Table C. December 2013-January 2014 changes in selected labor force measures,
with adjustments for population control effects
(Numbers in thousands)

______________________________________________________________________________
                                       |           |            |
                                       |           |            |  Dec.-Jan.
                                       | Dec.-Jan. |    2014    |   change,
                                       |  change,  | population |  after re-
                Category               |    as     |   control  |  moving the
                                       | published |   effect   |  population
                                       |           |            |   control
                                       |           |            |  effect (1)
_______________________________________|___________|____________|_____________
                                       |           |            |
  Civilian noninstitutional population.|    170    |       2    |     168
    Civilian labor force...............|    523    |      24    |     499
      Participation rate...............|     .2    |      .0    |      .2
     Employed..........................|    638    |      22    |     616
      Employment-population ratio......|     .2    |      .0    |      .2
     Unemployed........................|   -115    |       2    |    -117
      Unemployment rate................|    -.1    |      .0    |     -.1
    Not in labor force.................|   -353    |     -22    |    -331
_______________________________________|___________|____________|_____________

   (1) This Dec.-Jan. change is calculated by subtracting the population
control effect from the over-the-month change in the published seasonally
adjusted estimates.
   NOTE: Detail may not sum to totals because of rounding.

  ------------------------------------------------------------------------------------
 |                                                                                    |
 |                            Change to the Household Survey Tables                   |
 |                                                                                    |
 |Effective with this release, household survey table A-10 includes two new seasonally|
 |adjusted series for women age 55 and over--the number of unemployed persons and the |
 |unemployment rate. These replace the series that were previously displayed for this |
 |group, which were not seasonally adjusted.                                          |
 |                                                                                    |
  ------------------------------------------------------------------------------------

  ------------------------------------------------------------------------------------
 |                                                                                    |
 |               Updated Veteran Weighting Methodology for Household Survey           |
 |                                                                                    |
 |Beginning with data for January 2014, estimates for veterans in table A-5 of this   |
 |release incorporate updated weighting procedures. The new weighting methodology more|
 |accurately reflects the current demographic composition of the veteran population.  |
 |The primary impact of the change was an increase in the "Gulf War-era I" veteran    |
 |population and a decrease in the number of veterans in the "Other service periods"  |
 |category. The updated methodology had little effect on unemployment rates for       |
 |veterans, regardless of gender or period of service. Additional information on the  |
 |effect of the change on labor force estimates for veterans is available at          |
 |www.bls.gov/cps/vetsweights2014.pdf.                                                |
 |                                                                                    |
  ------------------------------------------------------------------------------------
Employment Situation Summary Table A. Household data, seasonally adjusted
HOUSEHOLD DATA
Summary table A. Household data, seasonally adjusted
[Numbers in thousands]
CategoryJan.
2013Nov.
2013Dec.
2013Jan.
2014Change from:
Dec.
2013-
Jan.
2014Employment status Civilian noninstitutional population244,663246,567246,745246,915-Civilian labor force155,699155,284154,937155,460-Participation rate63.663.062.863.0-Employed143,384144,443144,586145,224-Employment-population ratio58.658.658.658.8-Unemployed12,31510,84110,35110,236-Unemployment rate7.97.06.76.6-Not in labor force88,96391,28391,80891,455- Unemployment rates Total, 16 years and over7.97.06.76.6-Adult men (20 years and over)7.46.76.36.2-Adult women (20 years and over)7.26.26.05.9-Teenagers (16 to 19 years)23.520.820.220.7-White7.16.15.95.7-Black or African American13.812.411.912.1-Asian (not seasonally adjusted)6.55.34.14.8-Hispanic or Latino ethnicity9.78.78.38.4- Total, 25 years and over6.55.85.65.4-Less than a high school diploma12.010.69.89.6-High school graduates, no college8.17.37.16.5-Some college or associate degree7.06.46.16.0-Bachelor’s degree and higher3.83.43.33.2- Reason for unemployment Job losers and persons who completed temporary jobs6,6755,7315,3665,407-Job leavers984890862818-Reentrants3,5203,0653,0362,937-New entrants1,2741,1691,2011,184- Duration of unemployment Less than 5 weeks2,7532,4392,2552,434-5 to 14 weeks3,0772,5852,5062,429-15 to 26 weeks1,8671,7421,6511,689-27 weeks and over4,7074,0443,8783,646- Employed persons at work part time Part time for economic reasons7,9837,7237,7717,257-Slack work or business conditions5,1174,8694,8844,405-Could only find part-time work2,6132,4992,5922,571-Part time for noneconomic reasons18,55618,85818,73119,165- Persons not in the labor force (not seasonally adjusted) Marginally attached to the labor force2,4432,0962,4272,592-Discouraged workers804762917837– December – January changes in household data are not shown due to the introduction of updated population controls.
NOTE: Persons whose ethnicity is identified as Hispanic or Latino may be of any race. Detail for the seasonally adjusted data shown in this table will not necessarily add to totals because of the independent seasonal adjustment of the various series. Updated population controls are introduced annually with the release of January data.
Employment Situation Summary Table B. Establishment data, seasonally adjusted
ESTABLISHMENT DATA
Summary table B. Establishment data, seasonally adjusted
Footnotes (1) Includes other industries, not shown separately. (2) Data relate to production employees in mining and logging and manufacturing, construction employees in construction, and nonsupervisory employees in the service-providing industries. (3) The indexes of aggregate weekly hours are calculated by dividing the current month’s estimates of aggregate hours by the corresponding annual average aggregate hours. (4) The indexes of aggregate weekly payrolls are calculated by dividing the current month’s estimates of aggregate weekly payrolls by the corresponding annual average aggregate weekly payrolls. (5) Figures are the percent of industries with employment increasing plus one-half of the industries with unchanged employment, where 50 percent indicates an equal balance between industries with increasing and decreasing employment. (p) Preliminary
NOTE: Data have been revised to reflect March 2013 benchmark levels and updated seasonal adjustment factors.
Weakness Continues as 113,000 Jobs Are Added in January
Employers added jobs at a slower-than-expected pace in January, the second month in a row that hiring has been disappointing and a sign that the labor market remains anemic despite indications of growth elsewhere in the economy.
Payrolls increased by 113,000, the Labor Department reported Friday morning, well below the gain of 180,000 that economists expected. The unemployment rate, based on a separate survey of households that was more encouraging, actually fell by a tenth of a percentage point, to 6.6 percent.
The data for January come after an even more disappointing report on the labor market for December, which was revised upward only slightly Friday, to show a gain of just 75,000 jobs, from 74,000. The level of hiring in January was also substantially below the average monthly gain of 178,000 positions over the last six months, as well as the monthly addition of 187,000 over the last year.
The two weak months in a row will prompt questions about whether the Federal Reserve acted prematurely when policy makers in December voted to begin scaling back the central bank’s expansive stimulus efforts.
The new data is not expected to alter the Fed’s course, economists said, but another poor report on hiring next month might force policy makers to rethink their plan when they next meet in late March.
“In one line: grim,” said Ian Shepherdson, chief economist at Pantheon Macroeconomics, in a note to clients Friday morning.
While seasonal adjustments may have played a role and upward revisions for hiring in October and November were more encouraging, he said, “The payroll rebound clearly is disappointing; none of the ground lost in December was recovered.”
Other economists conceded the picture for January was hardly bright, but cautioned it was too soon to conclude there had been a fundamental loss of momentum in the economy, especially given seasonal fluctuations in the data and the possibility that weather inhibited some hiring.
“We’re not seeing the takeoff that people wanted to see, but it’s not a disaster,” said Julia Coronado, chief economist for North America at BNP Paribas. “The 113,000 figure is definitely way below trend, but we want another month or two of data before we can draw conclusions.”
One mystery economists will be focusing on is why employment gains have not kept up with economic growth as measured by gross domestic product, which picked up substantially in the second half of 2013. The annualized pace of expansion was 3.2 percent in the fourth quarter, and 4.1 percent in the third quarter.
One reason may be that new technologies are allowing employers to make do with fewer workers, for instance the use of automated customer service systems instead of call centers, or Internet retailers’ taking over from brick-and-mortar stores where sales associates prowl the floors.
Another shift is evident from the yawning gap in employment for college graduates versus workers who lack a high school diploma. For people with a college degree or higher, the jobless rate was 3.1 percent, compared with 9.6 percent for Americans who did not finish high school.
Wintry conditions that held back hiring were blamed for the weakness in December, a theory popular among more optimistic economists after those numbers came out in early January.
But despite what seems like an endless series of snowstorms on the East Coast and arctic conditions in the Midwest recently, the reference week for the latest survey was Jan. 12-18, when conditions were fairly normal as Januaries go, limiting some of the impact of the weather in this report.
In the report on January, one sector holding back payrolls was the government, which shrank by 29,000 jobs in January. Excluding that loss, private employers added 142,000 positions, a slightly better showing.
Several other sectors which had been strong in recent months – education and health care as well as retailing – also lost positions, contributing to the overall weakness.
The falloff in hiring in the health care sector was especially notable. In December and January together, just 2,600 health care positions were filled. By contrast, as recently as November, nearly 25,000 health care workers were added to payrolls.
Although this area of the economy is going through a transformation as President Obama’s new health care plan is slowly introduced, that is unlikely to have caused the abrupt slowdown in hiring, said Ethan Harris, a head of global economics at Bank of America Merrill Lynch. If anything, he said, the law should create new jobs in the sector as health care coverage is expanded, even if higher costs for some employers result in job cuts elsewhere in the economy.
As for retail, which lost nearly 13,000 jobs in January, some of that reduction could have essentially been because of excessive hiring in December, Mr. Harris said, when stores added nearly 63,000 positions as the holiday shopping season peaked. The cuts may also have been spurred by weak results at some retailers, with chains like J. C. Penney announcing major job cuts last month, and Loehmann’s, the venerable discounter, now in liquidation.
The employment-population ratio, which has been falling as more workers drop out of the job market, edged up 0.2 percentage points to 58.8 percent. In recent years, the exit of people from the work force has reduced the unemployment rate, but it is a sign that people are giving up hope of finding a job in the face of slack conditions, hardly the way policy makers would like to see joblessness come down.
EMBARGOED UNTIL RELEASE AT 8:30 A.M. EST, THURSDAY, JANUARY 30, 2014
BEA 14-03
* See the navigation bar at the right side of the news release text for links to data tables,
contact personnel and their telephone numbers, and supplementary materials.
National Income and Product Accounts
Gross Domestic Product, 4th quarter and annual 2013 (advance estimate)
      Real gross domestic product -- the output of goods and services produced by labor and property
located in the United States -- increased at an annual rate of 3.2 percent in the fourth quarter of 2013
(that is, from the third quarter to the fourth quarter), according to the "advance" estimate released by the
Bureau of Economic Analysis.  In the third quarter, real GDP increased 4.1 percent.
The Bureau emphasized that the fourth-quarter advance estimate released today is based on
source data that are incomplete or subject to further revision by the source agency (see the box on page 4
and “Comparisons of Revisions to GDP” on page 5). The “second” estimate for the fourth quarter, based
on more complete data, will be released on February 28, 2014.
The increase in real GDP in the fourth quarter primarily reflected positive contributions from
personal consumption expenditures (PCE), exports, nonresidential fixed investment, private inventory
investment, and state and local government spending that were partly offset by negative contributions
from federal government spending and residential fixed investment. Imports, which are a subtraction in
the calculation of GDP, increased.
The deceleration in real GDP in the fourth quarter reflected a deceleration in private inventory
investment, a larger decrease in federal government spending, a downturn in residential fixed
investment, and decelerations in state and local government spending and in nonresidential fixed
investment that were partly offset by accelerations in exports and in PCE and a deceleration in imports.
The price index for gross domestic purchases, which measures prices paid by U.S. residents,
increased 1.2 percent in the fourth quarter, compared with an increase of 1.8 percent in the third.
Excluding food and energy prices, the price index for gross domestic purchases increased 1.7 percent in
the fourth quarter, compared with an increase of 1.5 percent in the third.
_______
FOOTNOTE. Quarterly estimates are expressed at seasonally adjusted annual rates, unless otherwise
specified. Quarter-to-quarter dollar changes are differences between these published estimates. Percent
changes are calculated from unrounded data and are annualized. “Real” estimates are in chained (2009)
dollars. Price indexes are chain-type measures.
Real personal consumption expenditures increased 3.3 percent in the fourth quarter, compared
with an increase of 2.0 percent in the third. Durable goods increased 5.9 percent, compared with an
increase of 7.9 percent. Nondurable goods increased 4.4 percent, compared with an increase of 2.9
percent. Services increased 2.5 percent, compared with an increase of 0.7 percent.
Real nonresidential fixed investment increased 3.8 percent in the fourth quarter, compared with
an increase of 4.8 percent in the third. Nonresidential structures decreased 1.2 percent, in contrast to an
increase of 13.4 percent. Equipment increased 6.9 percent, compared with an increase of 0.2 percent.
Intellectual property products increased 3.2 percent, compared with an increase of 5.8 percent. Real
residential fixed investment decreased 9.8 percent, in contrast to an increase of 10.3 percent.
Real exports of goods and services increased 11.4 percent in the fourth quarter, compared with
an increase of 3.9 percent in the third. Real imports of goods and services increased 0.9 percent,
compared with an increase of 2.4 percent.
Real federal government consumption expenditures and gross investment decreased 12.6 percent
in the fourth quarter, compared with a decrease of 1.5 percent in the third. National defense decreased
14.0 percent, compared with a decrease of 0.5 percent. Nondefense decreased 10.3 percent, compared
with a decrease of 3.1 percent. Real state and local government consumption expenditures and gross
investment increased 0.5 percent, compared with an increase of 1.7 percent.
The change in real private inventories added 0.42 percentage point to the fourth-quarter change
in real GDP after adding 1.67 percentage points to the third-quarter change. Private businesses
increased inventories $127.2 billion in the fourth quarter, following increases of $115.7 billion in the
third quarter and $56.6 billion in the second.
Real final sales of domestic product — GDP less change in private inventories — increased 2.8
percent in the fourth quarter, compared with an increase of 2.5 percent in the third.
Gross domestic purchases
Real gross domestic purchases — purchases by U.S. residents of goods and services wherever
produced — increased 1.8 percent in the fourth quarter, compared with an increase of 3.9 percent in the
third.
Disposition of personal income
Current-dollar personal income increased $69.4 billion (2.0 percent) in the fourth quarter,
compared with an increase of $140.0 billion (4.0 percent) in the third. The deceleration in personal
income primarily reflected downturns in personal dividend income and in farm proprietors’ income and
a deceleration in personal current transfer receipts that were partly offset by an acceleration in wages
and salaries.
Personal current taxes increased $23.7 billion in the fourth quarter, in contrast to a decrease of
$11.0 billion in the third.
Disposable personal income increased $45.7 billion (1.5 percent) in the fourth quarter, compared
with an increase of $151.0 billion (5.0 percent) in the third. Real disposable personal income increased
0.8 percent in the fourth quarter, compared with an increase of 3.0 percent in the third.
Personal outlays increased $118.6 billion (4.0 percent) in the fourth quarter, compared with an
increase of $113.4 billion (3.9 percent) in the third. Personal saving — disposable personal income less
personal outlays — was $545.1 billion in the fourth quarter, compared with $618.0 billion in the third.
The personal saving rate — personal saving as a percentage of disposable personal income — was
4.3 percent in the fourth quarter, compared with 4.9 percent in the third. For a comparison of personal
saving in BEA’s national income and product accounts with personal saving in the Federal Reserve
Board’s financial accounts of the United States and data on changes in net worth, go to www.bea.gov/national/nipaweb/Nipa-Frb.asp.
Current-dollar GDP
Current-dollar GDP — the market value of the nation’s output of goods and services — increased
4.6 percent, or $189.6 billion, in the fourth quarter to a level of $17,102.5 billion. In the third quarter,
current-dollar GDP increased 6.2 percent, or $251.9 billion.
2013 GDP
Real GDP increased 1.9 percent in 2013 (that is, from the 2012 annual level to the 2013 annual
level), compared with an increase of 2.8 percent in 2012.
The increase in real GDP in 2013 primarily reflected positive contributions from personal
consumption expenditures (PCE), exports, residential fixed investment, nonresidential fixed investment,
and private inventory investment that were partly offset by a negative contribution from federal
government spending. Imports, which are a subtraction in the calculation of GDP, increased.
The deceleration in real GDP in 2013 primarily reflected a deceleration in nonresidential fixed
investment, a larger decrease in federal government spending, and decelerations in PCE and in exports
that were partly offset by a deceleration in imports and a smaller decrease in state and local government
spending.
The price index for gross domestic purchases increased 1.2 percent in 2013, compared with an
increase of 1.7 percent in 2012.
Current-dollar GDP increased 3.4 percent, or $558.4 billion, in 2013, compared with an increase
of 4.6 percent, or $710.8 billion, in 2012.
During 2013 (that is, measured from the fourth quarter of 2012 to the fourth quarter of 2013) real
GDP increased 2.7 percent. Real GDP increased 2.0 percent during 2012. The price index for gross
domestic purchases increased 1.1 percent during 2013, compared with an increase of 1.5 percent in
2012.
________
BOX. Information on the assumptions used for unavailable source data is provided in a technical note
that is posted with the news release on BEA’s Web site. Within a few days after the release, a detailed
“Key Source Data and Assumptions” file is posted on the Web site. In the middle of each month, an analysis
of the current quarterly estimate of GDP and related series is made available on the Web site; click on
Survey of Current Business, “GDP and the Economy.” For information on revisions, see “Revisions to GDP, GDI,
and Their Major Components.”
________
BEA’s national, international, regional, and industry estimates; the Survey of Current Business;
and BEA news releases are available without charge on BEA’s Web site at www.bea.gov. By visiting
the site, you can also subscribe to receive free e-mail summaries of BEA releases and announcements.
* * *
Next release — February 28, 2014 at 8:30 A.M. EST for:
Gross Domestic Product: Fourth Quarter and Annual 2013 (Second Estimate)
* * *
Release dates in 2014
Gross Domestic Product
2013: IV and 2013 annual 2014: I 2014: II 2014: III
Advance… January 30 April 30 July 30 October 30
Second…. February 28 May 29 August 28 November 25
Third….. March 27 June 25 September 26 December 23
Corporate Profits
Preliminary… …… May 29 August 28 November 25
Revised……. March 27 June 25 September 26 December 23
Comparisons of Revisions to GDP
Quarterly estimates of GDP are released on the following schedule: the “advance” estimate, based on
source data that are incomplete or subject to further revision by the source agency, is released near the end of the
first month after the end of the quarter; as more detailed and more comprehensive data become available,
the “second” and “third” estimates are released near the end of the second and third months, respectively.
The “latest”” estimate reflects the results of both annual and comprehensive revisions.
Annual revisions, which generally cover the quarters of the 3 most recent calendar years, are usually carried
out each summer and incorporate newly available major annual source data. Comprehensive (or benchmark)
revisions are carried out at about 5-year intervals and incorporate major periodic source data, as well as
improvements in concepts and methods that update the accounts to portray more accurately the evolving U.S.
economy.
The table below shows comparisons of the revisions between quarterly percent changes of current-dollar
and of real GDP for the different vintages of the estimates. From the advance estimate to the second estimate (one
month later), the average revision to real GDP without regard to sign is 0.5 percentage point, while from the
advance estimate to the third estimate (two months later), it is 0.6 percentage point. From the advance estimate to
the latest estimate, the average revision without regard to sign is 1.3 percentage points. The average revision
(with regard to sign) from the advance estimate to the latest estimate is 0.3 percentage point, which is larger
than the average revisions from the advance estimate to the second or to the third estimates. The larger average
revisions to the latest estimate reflect the fact that comprehensive revisions include major improvements, such as
the incorporation of BEA’s latest benchmark input-output accounts. The quarterly estimates correctly indicate the
direction of change of real GDP 97 percent of the time, correctly indicate whether GDP is accelerating or
decelerating 72 percent of the time, and correctly indicate whether real GDP growth is above, near, or below trend
growth more than four-fifths of the time.
Revisions Between Quarterly Percent Changes of GDP: Vintage Comparisons
[Annual rates]
Vintages Average Average without Standard deviation of
compared regard to sign revisions without
regard to sign
Fall of the dollar 2014 – America Economy Will Soon Collapse! – Peter Schiff
Peter Schiff – Whatever the Fed Does, Gold Will Rally! US Economy Already Ruined!
Peter Schiff was Right – The party is over, Ben Stein thinks the earnings are huge
Peter Schiff: US lost ability to produce, can’t live without debt
EMBARGOED UNTIL RELEASE AT 8:30 A.M. EST, THURSDAY, DECEMBER 5, 2013
BEA 13-57
* See the navigation bar at the right side of the news release text for links to data tables,
contact personnel and their telephone numbers, and supplementary materials.
National Income and Product Accounts
Gross Domestic Product, 3rd quarter 2013 (second estimate);
Corporate Profits, 3rd quarter 2013 (preliminary estimate)
      Real gross domestic product -- the output of goods and services produced by labor and property
located in the United States -- increased at an annual rate of 3.6 percent in the third quarter of 2013 (that
is, from the second quarter to the third quarter), according to the "second" estimate released by the
Bureau of Economic Analysis.  In the second quarter, real GDP increased 2.5 percent.

      The GDP estimate released today is based on more complete source data than were available for
the "advance" estimate issued last month.  In the advance estimate, the increase in real GDP was 2.8
percent (see "Revisions" on page 3). With this second estimate for the third quarter, the increase in
private inventory investment was larger than previously estimated.

      The increase in real GDP in the third quarter primarily reflected positive contributions from
private inventory investment, personal consumption expenditures (PCE), exports, nonresidential fixed
investment, residential fixed investment, and state and local government spending that were partly offset
by a negative contribution from federal government spending. Imports, which are a subtraction in the
calculation of GDP, increased.

      The acceleration in real GDP growth in the third quarter primarily reflected an acceleration in
private inventory investment, a deceleration in imports, and an acceleration in state and local
government spending that were partly offset by decelerations in exports, in PCE, and in nonresidential
fixed investment.

_________
FOOTNOTE.  Quarterly estimates are expressed at seasonally adjusted annual rates, unless otherwise
specified.  Quarter-to-quarter dollar changes are differences between these published estimates.  Percent
changes are calculated from unrounded data and are annualized.  "Real" estimates are in chained (2009)
dollars.  Price indexes are chain-type measures.

      This news release is available on BEA’s Web site along with the Technical Note and Highlights related
to this release.  For information on revisions, see "Revisions to GDP, GDI, and Their Major Components".
_________

     The price index for gross domestic purchases, which measures prices paid by U.S. residents,
increased 1.8 percent in the third quarter, the same increase as in the advance estimate; this index
increased 0.2 percent in the second quarter.  Excluding food and energy prices, the price index for gross
domestic purchases increased 1.5 percent in the third quarter, compared with an increase of 0.8 percent
in the second.

      Real personal consumption expenditures increased 1.4 percent in the third quarter, compared
with an increase of 1.8 percent in the second.  Durable goods increased 7.7 percent, compared with an
increase of 6.2 percent.  Nondurable goods increased 2.4 percent, compared with an increase of 1.6
percent.  Services was unchanged in the third quarter; in the second quarter, services increased 1.2
percent.

      Real nonresidential fixed investment increased 3.5 percent in the third quarter, compared with an
increase of 4.7 percent in the second.  Nonresidential structures increased 13.8 percent, compared with
an increase of 17.6 percent.  Equipment was unchanged in the third quarter; in the second quarter,
equipment increased 3.3 percent.  Intellectual property products increased 1.7 percent, in contrast to a
decrease of 1.5 percent.  Real residential fixed investment increased 13.0 percent, compared with an
increase of 14.2 percent.

      Real exports of goods and services increased 3.7 percent in the third quarter, compared with an
increase of 8.0 percent in the second.  Real imports of goods and services increased 2.7 percent,
compared with an increase of 6.9 percent.

      Real federal government consumption expenditures and gross investment decreased 1.4 percent
in the third quarter, compared with a decrease of 1.6 percent in the second.  National defense decreased
0.3 percent, compared with a decrease of 0.6 percent.  Nondefense decreased 3.1 percent, the same
decrease as in the second quarter.  Real state and local government consumption expenditures and gross
investment increased 1.7 percent, compared with an increase of 0.4 percent.

      The change in real private inventories added 1.68 percentage points to the third-quarter change in
real GDP, after adding 0.41 percentage point to the second-quarter change.  Private businesses increased
inventories $116.5 billion in the third quarter, following increases of $56.6 billion in the second quarter
and $42.2 billion in the first.

      Real final sales of domestic product -- GDP less change in private inventories -- increased 1.9
percent in the third quarter, compared with an increase of 2.1 percent in the second.

Gross domestic purchases

      Real gross domestic purchases -- purchases by U.S. residents of goods and services wherever
produced -- increased 3.4 percent in the third quarter, compared with an increase of 2.5 percent in the
second.

Gross national product

      Real gross national product -- the goods and services produced by the labor and property
supplied by U.S. residents -- increased 3.9 percent in the third quarter, compared with an increase of 2.7
percent in the second.  GNP includes, and GDP excludes, net receipts of income from the rest of the
world, which increased $13.7 billion in the third quarter after increasing $7.7 billion in the second; in the
third quarter, receipts increased $1.7 billion, and payments decreased $12.1billion.

Current-dollar GDP

      Current-dollar GDP -- the market value of the nation's output of goods and services -- increased
5.6 percent, or $229.8 billion, in the third quarter to a level of $16,890.8 billion.  In the second quarter,
current-dollar GDP increased 3.1 percent, or $125.7 billion.

Gross domestic income

      Real gross domestic income (GDI), which measures the output of the economy as the costs
incurred and the incomes earned in the production of GDP, increased 1.4 percent in the third quarter,
compared with an increase of 3.2 percent (revised) in the second.  For a given quarter, the estimates of
GDP and GDI may differ for a variety of reasons, including the incorporation of largely independent
source data.  However, over longer time spans, the estimates of GDP and GDI tend to follow similar
patterns of change.

Revisions

      The upward revision to the percent change in real GDP primarily reflected upward revisions to
private inventory investment and to nonresidential fixed investment that were partly offset by an upward
revision to imports and a downward revision to exports.

                                                                     Advance Estimate             Second Estimate
                                                                       (Percent change from preceding quarter)

Real GDP................................................                    2.8                        3.6
Current-dollar GDP......................................                    4.8                        5.6
Gross domestic purchases price index....................                    1.8                        1.8

                                            Corporate Profits

      Profits from current production (corporate profits with inventory valuation adjustment (IVA) and
capital consumption adjustment (CCAdj)) increased $38.3 billion in the third quarter, compared with an
increase of $66.8 billion in the second.  Taxes on corporate income decreased $4.8 billion, in contrast to
an increase of $10.0 billion.  Profits after tax with IVA and CCAdj increased $43.0 billion, compared
with an increase of $56.9 billion.

      Dividends decreased $179.7 billion in the third quarter, in contrast to an increase of $273.5
billion in the second.  The large third-quarter decrease primarily reflected dividends paid by Fannie Mae
to the federal government in the second quarter.  Undistributed profits increased $222.8 billion, in
contrast to a decrease of $216.6 billion.  Net cash flow with IVA -- the internal funds available to
corporations for investment -- increased $234.5 billion, in contrast to a decrease of $205.3 billion.

_________
BOX.  Profits from current production reflect the depreciation of
fixed assets valued at current cost using consistent depreciation profiles.
These profiles are based on used-asset prices and do not depend on the
depreciation-accounting practices used for federal income tax returns.  The IVA and CCAdj are
adjustments that convert inventory withdrawals and depreciation of fixed assets reported on a tax-return,
historical-cost basis to the current-cost economic measures used in the national income and product
accounts.
_________

Corporate profits by industry

      Domestic profits of financial corporations increased $8.6 billion in the third quarter, compared to
an increase of $24.5 billion in the second.  Domestic profits of nonfinancial corporations increased $13.0
billion, compared to an increase of $37.8 billion.

      The rest-of-the-world component of profits increased $16.7 billion in the third quarter, compared
with an increase of $4.6 billion in the second.  This measure is calculated as the difference between
receipts from rest of the world and payments to rest of the world.

Gross value added of nonfinancial domestic corporate business

      In the third quarter, real gross value added of nonfinancial corporations increased, and profits per
unit of real value added increased.  The increase in unit profits reflected an increase in unit prices that
was partly offset by increases in both unit labor costs and nonlabor costs incurred by corporations.

                                     *          *          *

BEA's national, international, regional, and industry estimates; the Survey of Current Business;
and BEA news releases are available without charge on BEA's Web site at www.bea.gov.  By visiting
the site, you can also subscribe to receive free e-mail summaries of BEA releases and announcements.

                                     *          *          *

                         Next release -- December 20, 2013, at 8:30 A.M. EST for:
                       Gross Domestic Product:  Third Quarter 2013 (Third Estimate)
                          Corporate Profits:  Third Quarter (Revised Estimate)

                                     *          *          *
Segment 0: U.S. Dirty Debt Bomb Exploding — The First Shock Wave Hits — National Debt Increases Record $328 Billion in One Day — National Debt Over $17 Trillion — By February Will Hit $17.5 Trillion — Videos
Not Raising Debt Ceiling Won’t Put U.S. In Default – Ron Paul
Tom Coburn Tears Credit Card Poster On Senate Floor
GOP Sen. Tom Coburn Rips Up US Government Credit Card on TV, Gretchen Carlson Thanks Him
Coburn on Greatest Threat Facing the Country: Our Debt
Dr. Coburn addressing his colleagues in the Senate today, warning Congress of the dire consequences that will ensue if politics in Washington continues as usual: “Our country has a history of doing hard things. What we lack is leadership to call us to do those hard things. We find ourselves at a point in time where the greatest threat to our nation is our debt and our economy. We’re risking our future, not only our future economically but our future of liberty.”
Dr. Coburn on Charlie Rose on US Debt Crisis, Leadership Deficit in Washington
Senator Tom Coburn: Two Years Till Severe Debt Crisis
Senator Tom Coburn on the “Debt Bomb”
The Debt Bomb book Glenn Beck w/ Senator Tom Coburn on GBTV Stop Washington from Bankrupting America
Debt Ceiling, Gold, and Janet Yellen – Hype vs. Reality
“US’ DEBT BOMB CLOCK” IS TICKING!
Peter Schiff – Debt Ceiling Not The Problem; It’s the Lending Ceiling
Peter Schiff The Reality Is We’re Living In A Bubble And ALL
Economics professor Antony Davies illustrates the size the U.S. federal government’s debt and unfunded obligations. He breaks down the total U.S. debt and obligations into parts and compares them with the size of the GDP of countries around the world, showing the magnitude of America’s fiscal situation.
U.S. debt jumped more than $300 billion on Thursday, the first day the federal government was able to borrow money under the deal President Obama and Congress sealed this week.
The debt now equals $17.075 trillion, according to figures the Treasury Department posted online on Friday.
The $328 billion increase is an all-time record, shattering the previous high of $238 billion set two years ago.
The giant jump comes because the government was replenishing its stock of “extraordinary measures” — the federal funds it borrowed from over the last five months as it tried to avoid bumping into the debt ceiling.
Under the law, that replenishing happens as soon as there is new debt space.
In this case, the Treasury Department borrowed $400 billion from other funds beginning in May, awaiting a final deal from Congress and Mr. Obama.
Usually Congress sets a borrowing limit, or debt ceiling, that caps the total amount the government can be in the red.
But under the terms of this week’s deal, Congress set a deadline instead of a dollar cap. That means debt can rise as much as Mr. Obama and Congress want it to, until the Feb. 7 deadline.
Judging by the rate of increase over the last five months, that could end up meaning Congress just granted Mr. Obama a debt increase of $700 billion or more.
Republicans initially sought to attach strings to the debt increase, but surrendered this week, instead settling on a bill that reopened the government and included some special earmark projects, but didn’t include any spending cuts.
Democrats insisted that the debt increase be “clean,” meaning without any strings attached. They say the debt increase only allows Mr. Obama to pay for the bills he and Congress already racked up, and that it doesn’t encourage new spending.
Analysis: Debt fight dings U.S. Treasury bills’ status
By Richard Leong
(Reuters) – The safe-haven reputation of U.S. Treasury bills took a beating during the latest debt ceiling fight in Washington, and it won’t be regained soon, even after the last-minute deal to avert a threatened default.
The temporary agreement to lift the government’s debt limit may only pave the way for another political struggle between President Barack Obama and Republican lawmakers in early 2014 over the federal budget and borrowing levels.
While others measure the toll on the economy from the 16-day federal government shutdown, Wall Street is fretting over the future appetite for U.S. debt and its effect on federal borrowing costs.
During the next three-and-a-half months before the next debt ceiling deadline, the U.S. government might pay higher interest rates on its short-term debt.
Before the shutdown, the Treasury was selling one-month debt at next to nothing. The rise in yields as a result of the crisis will cost the Treasury an estimated $56 million more in interest payments than it would have incurred had this month’s auctions been sold in September.
While some one-month T-bill rates saw their yields decline to 0.02 to 0.03 percent after jumping above 0.70 percent less than 24 hours earlier, bills maturing in February still showed modestly elevated yields. If Washington repeats the battle that ended on Wednesday, bill rates would likely jump again.
“There’s a fundamental change in their risk profile. There’s a growing lack of confidence. It’s going to be problematic,” said Tom Nelson, chief investment officer at Reich & Tang, a New York-based cash management firm that oversees more than $33 billion in assets.
Investors are frustrated that they are forced to shun certain T-bill issues because of the self-imposed fiscal deadlines of politicians. Some of them want additional compensation to buy T-bills given the possibility of default every few months, even though most think the risk is very low.
Chances of a default seemed almost unfathomable three weeks ago before the debt ceiling showdown that accompanied the first partial government shutdown in 17 years.
“The reason you’re holding short Treasuries is because of their unparalleled safety and liquidity. If you’re not getting safety and liquidity, there’s no point in having them,” said Gregory Whiteley, who manages a $53 billion government bond portfolio at DoubleLine Capital in Los Angeles.
Before the political impasse ended, interest rates on T-bill issues set to mature in the second half of October through the first half of November hit five-year highs.
“This is the kind of volatility we have never seen. I’m afraid this will get worse and worse,” Reich’s Nelson said.
DEFAULT SKITTISHNESS
The surge in T-bill rates stemmed partly from major money market fund operators, including Fidelity, JPMorgan, BlackRock and PIMCO, dumping their holdings of T-bill issues that mature in the next four weeks because they were seen most vulnerable if the government did not raise the debt ceiling in time.
Reich’s Nelson took more drastic action.
He said he cleared his funds of all T-bills that mature between now and the end of the year and did not jump back to buy them, even after President Obama signed the debt ceiling deal into law before midnight.
In the meantime, default anxiety caused retail investors to rush to redeem their money fund shares.
Money funds posted their biggest weekly outflows in nearly a year, as assets fell $44.77 billion to $2.606 trillion in the week ended October 15, according to iMoneynet’s Money Fund Report.
The asset drop, while large, was still much less than the $103.21 billion plunge in the week ended August 2, 2011 during the first debt ceiling showdown between the White House and top Republican lawmakers.
COST OF A SHORT-TERM DEAL
A pick-up in interest costs, if it persists, would be a setback for the government as its deficit has been shrinking.
“There are costs associated with going through this each time, costs embedded into Treasuries securities, costs the Treasury has to incur in higher risk premiums at auction,” said Rob Toomey, associate general counsel at the Securities Industry and Financial Markets Association (SIFMA), on a call with reporters on Wednesday.
Bidding at last week’s one-month T-bill sale was the weakest since March 2009. Demand at this week’s bill auctions improved on hopes of a debt agreement, but interest rates remained higher than where they were almost three weeks ago.
Fitch Ratings on Tuesday warned it might strip the United States of its top AAA-rating due to the debt ceiling fight.
“This highlights the risk in the United States. It’s not good for investors. If investors want to diversify from the U.S., this gives them a reason to,” said Brian Edmonds, head of rates trading at Cantor Fitzgerald in New York.
Skittishness in owning T-bills hurt Wall Street firms too. The 21 primary dealers, those top-tier investment banks that do business directly with the U.S. Federal Reserve, are required to buy the debt issued by the government at auctions.
“There are too much uncertainties. That’s dangerous especially if you are a primary dealer when you have to underwrite Treasury debt,” said Edmonds.
If you’ve kept up with U.S. news at all lately, you might’ve heard this: If Congress and the White House cannot reach a deal on the debt ceiling crisis by October 17, the U.S. government won’t have enough money to pay its bills. That sounds pretty scary — especially if you’re not quite sure what it all means.
So what exactly is the debt ceiling, anyway? And how can it affect you?
The debt ceiling crisis is not the same as the partial government shutdown
Yes, it’s confusing to other people as well. Two very complicated crises are happening in Washington simultaneously, and both are happening because lawmakers cannot come to an agreement.
The government shut down because lawmakers couldn’t agree on a deal to fund the government before the start of the new fiscal year. The debt ceiling refers to debt outstanding — bills for which the government has already approved the spending and has already committed to paying.
The shutdown only slightly changes the government’s payment schedule. When the government is closed, the number of daily payments the Department of the Treasury needs to make decreases, since many things are closed. But even during the shutdown, the U.S. government is still required to make a lot of other payments, including Social Security, Medicare and interest on the debt. And these are big payments that may impact the livelihood of millions of Americans.
The Treasury Department says if the limit (the debt ceiling) isn’t raised, the government could default on the bills it owes, which could then lead to a financial crisis similar to the events of 2008.
What is the debt ceiling?
The debt ceiling is the borrowing limit that Congress has set for itself as a way to control government spending. The difference between the amount of money the U.S. government takes in and the amount of money it spends each year is called the deficit. The ongoing deficit then adds up to the overall debt.
Congress usually approves more spending than it collects in tax revenue, so the Treasury has to borrow the rest of the money from other government accounts and by issuing IOUs, in order to pay those bills. Congress sets a cap on how much debt the government can have — called the debt ceiling. The debt ceiling is the maximum amount the Treasury can borrow, and right now that limit is set at about $16.699 trillion.
The U.S. government can borrow that amount, and no more, unless Congress votes to raise the debt ceiling.
In May, the government actually reached that limit, but over the past few months, the Treasury has been able to shuffle money around from various accounts to avoid taking on any more debt. That luxury is about to go away.
According to Treasury Secretary Jack Lew, the government will soon run out of money, except for about $30 billion, and the Treasury will either need to increase revenue or take on more debt — or it won’t be able to pay certain bills.
How the government funds its spending
The government funds its spending in two ways: taxes and borrowing. The government borrows money by issuing Treasury bonds, or IOUs. When someone buys a Treasury bond, they’re basically lending the government money and racking up interest on the loan, which the government pays each month. On October 17, the government owes an interest payment of about $13 billion — the first payment the government won’t be able to make without raising the debt ceiling.
The cap on borrowing applies to debt owed to the public, anyone who buys Treasury bonds and debt owed to federal government trust funds — such as those set up for Social Security and Medicare.
After October 17, the government will only be bringing in enough money to pay about 68% of its bills, according to a recent survey by the Bipartisan Policy Center. According to the center’s analysis, beginning on October 18, the Treasury will be about $106 billion short of making the $328 billion in payments that are already scheduled through November 15. Normally, when the debts are due, the government just issues new debts (by selling bonds), however if the government doesn’t have the full amounts it owes, certain payments will be delayed.
Who would be impacted if the government goes into default?
The government typically spends, or owes, about $10 billion per day for various things. And if the government can’t make those payments, the first people to be affected will be people who get pay or benefits from the government. That includes members of the military and people who receive benefits such as Social Security and Medicare. Here’s a breakdown of the dates when the government is supposed to pay some of its biggest bills:
Oct. 23: $12 billion in Social Security payments.
Oct. 31: $6 billion in interest on its debt.
Nov. 1: $58 billion in Social Security payments, disability benefits, Medicare payments, military pay and retiree pay.
So what happens if the government can’t pay those bills?
Ideally, the government would be able to prioritize which bills it pays first, but that’s not a realistic possibility because of how the Treasury payment system works. The Treasury issues about 100 million monthly payments through a computer system, which pays the bills automatically as they come due, according to the Bipartisan Policy Center. So, no one knows which checks will be issued at exactly what time. And if it begins making payments it doesn’t have the money for, checks will start bouncing. It’s just unclear at this point which ones would bounce.
So the government could pay some bills in full and delay others, or, it could delay all bills until it has enough money to pay each day’s bills in full. The problem with delaying them all is that, with each day that goes by, the total amount the government owes will continue to increase drastically.
Some federal contractors may accept an IOU, with higher interest, but people who depend on Social Security checks on a regular basis probably won’t want an IOU from the government that’s worth nothing right now. Plus, if the government misses a payment to bondholders, that could impact the stability of the U.S. bond market and confidence in the U.S. dollar.
If some payments are delayed, people could get payments, like Social Security checks, a few weeks late.
So what’s next?
Economists say missing the debt ceiling deadline won’t trigger an immediate recession. However, the longer Congress waits, the worse the problem could get.
According to Patrick O’Keefe, director of economic research at accounting firm Cohn Reznick, “Merely missing the debt ceiling deadline will not trigger a recession, but the risks will rise rapidly with each week after the deadline passes.”
Congress could agree on a short-term increase of the debt ceiling to allow the government to pay its bills, but a longer-term agreement must be reached eventually.
On September 10, the Bipartisan Policy Center (BPC) released its comprehensive debt limit analysis for fall 2013. On May 19 of this year, the debt limit was reinstated at a new, higher level, after having been suspended since February. Upon its reinstatement, the U.S. found itself up against the debt limit with the Treasury Department continuing to operate through the limited borrowing authority provided by extraordinary measures.
In July, BPC had projected that the X Date – the point at which extraordinary measures and cash on hand are exhausted and Treasury can no longer meet all federal financial obligations in full and on time – would be reached between mid-October and mid-November. With updated government financial data and a more extensive analysis of daily transactions that will occur in September, October, and November, BPC has narrowed that projected window to October 18 – November 5. This range will be regularly updated in the coming weeks, as warranted by the data.
We have already hit the debt limit. The U.S. officially reached its statutory borrowing limit of about $16.699 trillion on May 19, 2013. (Technically, Treasury has stayed $25 million below the actual limit of $16,699,421,000,000 since that time). To raise additional funds for paying the nation’s obligations beyond that date, the Treasury Secretary has been using some of the approximately $303 billion in available extraordinary measures. As of August 31, roughly $108 billion of these measures remained. Unless the debt limit is increased, eventually there will come a point when Treasury does not have enough cash to pay all bills in full and on time, and the government will be forced to default on some of its obligations. BPC refers to this date as the “X Date.”
BPC now projects that the “X Date” will occur between October 18 and November 5. This represents a range, which can be thought of as a confidence interval. A more precise estimate is not yet appropriate due to the volatility of revenue and the nature of the government’s financial obligations leading up to and during this period. Furthermore, even BPC’s estimated range for the X Date is a projection, which is subject to some uncertainty. The most significant sources of uncertainty are the quarterly tax payments due in mid-September, which tend to be volatile, along with general economic conditions. While federal government revenue has been strong compared to the previous fiscal year – coinciding with greater employment, increased corporate earnings, and slow-but-steady economic growth – there is no guarantee that these trends will continue.
How will Treasury make payments on or after the X Date? We don’t know. This would be an unprecedented situation. If the X Date arrived on October 18 (the start of BPC’s X-Date window), we project that Treasury would be $106 billion short of making $328 billion in scheduled payments through November 15, meaning that 32 percent of those obligations would go unpaid.
In one scenario, Treasury might prioritize some payments over others; our full report provides an illustrative example. Treasury, however, may not find that it has the legal authority or the technical capability to do this (because such prioritization could require extensive reprogramming of computer systems, which may not be possible in a short timeframe). An alternative approach would be for Treasury to wait until enough revenue is collected to make an entire day’s worth of payments at a time, meaning that all payments would be made in turn, but everyone anticipating funds from the government would see delays. While payment delays would be short in the beginning (one or two days), they would quickly cascade. If Treasury were to delay payments in this manner, and the X Date were reached on October 18, for example, Social Security payments due on November 1 would not be received by beneficiaries until November 13.
In any scenario, we assume that Treasury would do whatever it could to ensure that interest on the debt is paid in full and on time.
Substantial debt is scheduled to roll over after the X Date. From October 18 through November 15, over $370 billion in debt is expected to mature. Normally, this would be rolled over in a standard procedure by issuing new debt. Uncertainty surrounding the debt limit, however, could force Treasury to pay higher interest rates on this newly issued debt. Also, while very unlikely, there is a possibility that in a post-X Date environment, Treasury may not have sufficient buyers to complete its standard auction operation.
How much would the debt limit need to be increased in order to get through next year? BPC has projected the magnitude of the debt limit increase necessary to enable Treasury to meet all obligations through calendar year 2014. An increase of approximately $1.1 trillion would be required. There is a great amount of uncertainty in this estimate, however, given the amount of time that is covered.
Expect more updates. BPC will continue to update and refine our X-Date estimates as new information becomes available. To learn more, view our full report.
Treasury Yields Fall as Investors Focus on Effects of Government Shutdown
By
MICHELE MAATOUK
Expectations that the Federal Reserve will have to keep its easy-money policies in place for longer following the partial U.S. government shutdown pushed the dollar close to its lowest point of the year against the euro and U.S. Treasury debt prices to their highest point since July.
Yields on the 10-year Treasury note, which move inversely to prices, touched 2.538%, the lowest level since July 24, according to CQG. The dollar continued its slide against major rivals, including the euro, the yen and the pound. The euro recently bought $1.3686 from $1.3676 late Thursday, while the pound fetched $1.6186 from $1.6165. The greenback traded at ¥97.71 from ¥97.93.
The drop in the dollar and the rise in Treasury debt prices were set in train earlier this week after lawmakers reached a temporary solution to raise the so-called debt ceiling, showing that investors doubt the Fed can start to reel in its stimulus measures—a process dubbed tapering—for as long as economic performance and data is compromised by the now-ended shutdown, and as long as the risk of repeat shutdowns lingers.
“As policy remains uber accommodative, the dollar has adjusted downwards,” said Scott Jamieson, head of multi-asset investing at Kames Capital in London, with $24 billion under management.
“While we have been inclined to see tapering next year, the market is only now coming to appreciate this,” said analysts at Brown Brothers Harriman. “After the September disappointment, surveys suggest that a majority shifted their expectations to December. Now in light of the fiscal drag and new uncertainty, the mid-January and mid-February limits on spending and debt issuance will loom large at the December Federal Open Market Committee meeting, and likely reduces the possibility of tapering then. The focus is likely to shift to the March 2014 FOMC meeting for the first tapering,” they said.
U.S. stocks traded mostly higher. The S&P 500 added 0.4% to 1740, pushing further into record territory. The Nasdaq Composite Index rose 0.8% to 3893. The Dow Jones Industrial Average lagged behind, dropping 0.2% to 15370.
Now that Congress has temporarily approved a bill to raise the debt ceiling, attention is likely to shift back to earnings and fundamentals. And as investors reassess their expectations for any withdrawal of stimulus from the Fed, all eyes will be on the economic data that was delayed by the partial government shutdown. The next focus will beSeptember’s nonfarm payrolls report, which is due on Oct. 22.
Political Junkies With SAD (Spending Addiction Disorder) Overdose
By Raymond Thomas Pronk
Staff writer
The ruling elite in Washington, both Democrats and Republicans, are addicts with a bad habit.
The ruling elite share many of the common addictions of the American people to alcohol, cigarettes, drugs, food, gambling, games, pornography, television, sex and surfing the Web.
Yet the ruling elite have a unique habit that the American people can no longer pay for or support. The name of this habit is SAD — Spending Addiction Disorder.
The primary symptoms of SAD are massive annual federal government budget deficits, raising the national debt ceiling and blaming others for their addiction problem.
Like most habits that turn into addictions, the ruling elite can no longer control themselves. They are hooked on spending other people’s money.
How bad is the SAD habit? For the past five fiscal years the federal government forced the American people to support their habit by collecting more than $12 trillion in taxes. However, the ruling elite’s habit is much worse. Besides the $12 trillion in taxes, the federal government spent in excess of $6 trillion by running annual budget deficits averaging more than $1.2 trillion per year.
This required the ruling elite to order the Department of the Treasury to issue more new Treasury debt securities in the form of Treasury bills, notes and bonds to finance these deficits that exceeded $6 trillion. As a result the total gross national debt now exceeds $17 trillion.
To put these amounts in perspective, the total U.S. real Gross Domestic Product (GDP) for 2013 is estimated to be about $16 trillion.
President Barack Obama and Congress fear the American people will finally wake up and demand they kick their SAD habit and live within the means of the American people. This would require real cuts in the fiscal year 2014 federal budget spending with the aim of balancing the budget within three or four years.
The ruling elite SAD junkies are lashing out and demonizing American taxpayers who support their habit by calling them anarchists, arsonists, extremists, hostage-takers, kidnappers, terrorists or worse, Tea Party Republicans.
Obama held a press conference on Oct. 8 and warned that if the national debt ceiling is not raised by Oct. 17, the U.S. could default on its national debt and put the U.S. into another recession. Political junkies with the SAD habit have been known to lie in order to get another fix for their habit. On average the American people are currently paying the ruling elite about $225 billion each month in taxes which would more than cover the $35 billion monthly interest paid on Treasury debt, according to the Monthly Treasury Statement (MTS) report. The last thing the U.S. government will do is default on the national debt by not paying the interest when due.
Mandatory spending makes up about 66 percent of all government spending and is required to be paid under existing authorization laws. Currently the federal government collects enough taxes to pay for mandatory spending including interest on the national debt, entitlements (Social Security, Medicare and Medicaid), and income support programs (unemployment compensation, Supplemental Nutrition Assistance Program [SNAP], Supplemental Income for the blind and disabled, earned income and child tax credits).
Discretionary spending makes up about 33 percent of government spending and includes spending for all federal departments, agencies and programs. Discretionary spending must be authorized each fiscal year and funded through appropriation bills.
The reason the political junkies with the SAD habit are panicking is they need to raise the national debt ceiling imposed by Congress by an additional $1 trillion above the existing national debt of $17 trillion to pay for discretionary spending for fiscal year 2014. In order to get another debt raising fix, Congress must raise the debt ceiling once again.
Cutting federal government spending to balance the budget over a period of three or four years is never an option for the ruling elite junkies hooked with SAD. More and more government spending and taxes is the default solution for SAD political junkies.
The time has come for the American people to put the political junkies hooked on SAD in a rehab job in the private sector. The American people need to elect representatives, senators and a president that are fiscally responsible stewards of the general welfare and insist that all federal government budgets be balanced.
Hatch Statement at Finance Committee Hearing with Treasury Secretary Jack Lew
Hatch Questions Treasury Secretary Jack Lew at Finance Committee Hearing on the Debt Ceiling
Lew: US Economy Facing ‘Irrevocable Damage’
John Boehner Says GOP Will Require Obama to Cut Up the Credit Cards
Boehner offers Obama short-term debt extension, White House says “encouraging”
Obama, Boehner spar over shutdown
US shutdown: Boehner, Republicans offer debt ceiling increase (recorded live feed)
John Boehner Announces Short Term Debt Deal, Claims GOP Is Meeting Obama ‘Halfway’
John Boehner ‘I’m Not Drawing Any Lines in the Sand’ 10 8 13
GOP offers short-term debt-limit increase, but wants negotiations before ending shutdown
House Republican leaders said Thursday they will offer a temporary increase in the federal debt ceiling in exchange for negotiations with President Obama on longer-term “pressing problems,” but they stopped short of agreeing to end a government shutdown now in its 10th day.
In a news briefing following a closed-door meeting of House Republicans to present a plan to raise the debt limit for six weeks, House Speaker John A. Boehner (R-Ohio) said, “What we want to do is offer the president today the ability to move a temporary increase in the debt ceiling.” He described the offer, to be presented to Obama in a White House meeting with House Republicans on Thursday afternoon, as a “good-faith effort on our part to move halfway to what he’s demanded in order to have these conversations begin.”
Obama is “happy” that House Republicans agree a federal debt default is not an option, but he would prefer a longer extension of the debt limit, White House spokesman Jay Carney said.
Boehner did not immediately provide specifics of the plan. But the speaker made clear that House Republicans are not agreeing to Obama’s demand that they pass legislation to fund the government with no partisan strings attached, thereby ending the first government shutdown in 17 years.
Asked about the shutdown, Boehner said, “That’s a conversation we’re going to have with the president today.”
Senate Majority Leader Harry M. Reid (D-Nev.), speaking to reporters after a White House meeting between Obama and Senate Democrats, said the shutdown must end and the debt ceiling must be raised ahead of negotiations with the Republicans, who he complained keep changing their demands.
“This is a situation where they do not know what they want,” Reid said. His message to the GOP: “Open the government. Pay our bills. We’ll negotiate with you about anything.” Reid also said that Senate Democrats would “look at anything [House Republicans] send us,” but when asked about negotiating with them before reopening the government, he replied: “Not going to happen.”
The GOP plan would suspend the debt limit until Nov. 22, the Friday before Thanksgiving, while also forbidding Treasury Secretary Jack Lew from using “extraordinary measures” that his department has used in recent years to extend his borrowing authority for weeks after the ceiling is reached, according to a senior GOP aide who was in the room. This creates a hard “X date,” as financial analysts call the issue, leaving no wiggle room beyond that day.
The House Republicans essentially are offering a “clean” debt-limit increase in exchange for negotiations over reopening the government, aides said. The government shutdown would not end until Obama agreed to “structural reforms” to the tax code and federal health programs.
The House GOP leadership would like to hold a vote Thursday night on the plan, provided that Obama accepts it in the meeting scheduled for 4:30 p.m. But such a vote is more likely Friday, aides said.
The Senate is currently on track to vote Saturday on a Democratic proposal for a clean debt-limit hike, but that might be moved up to Friday.
The Republican plan for a six-week increase in the debt limit, without conservative strings attached, was aimed chiefly at calming jittery financial markets, according to senior GOP advisers.
Financial markets soared earlier Thursday on the first sign of optimistic news out of Washington in almost a month, with the Dow Jones industrial average up 169 points in the first 15 minutes of trading. The rally continued when Boehner confirmed the plan at an 11 a.m. press briefing, and by 1:30 p.m. the Dow was up more than 225 points.
The plan was presented to the House GOP caucus Thursday morning after Lew warned lawmakers that he would be unable to guarantee payments to any group — whether Social Security recipients or U.S. bondholders — unless Congress raises the federal debt ceiling.
If the GOP plan goes over well with rank-and-file Republicans, Boehner could put the legislation on the floor for a vote late Thursday, aides said.
House Majority Leader Eric Cantor (R-Va.) described the plan at the news briefing as “a temporary extension of the debt ceiling in exchange for a real commitment by the president and the Senate majority leader to sit down and talk about the pressing problems” facing the country. Rep. Kevin McCarty (R-Calif.), the House majority whip, characterized these problems as “drivers” of increasing federal debt.
Obama has indicated he could support a short-term debt-limit hike, but he has also demanded that Republicans allow the government to reopen before he would negotiate with the GOP.
If the Republicans want to negotiate, they should “reopen the government, extend the debt ceiling,” Obama said last week. “If they can’t do it for a long time, do it for the period of time in which these negotiations are taking place.”
Carney, the White House spokesman, told reporters Thursday afternoon: “The president is happy that cooler heads at least seem to be prevailing in the House, that there at least seems to be a recognition that default is not an option.” However, Obama “believes it would be far better . . . to raise the debt ceiling for an extended period of time,” as Senate Democrats are proposing.
“It would be far better for the economy if we stopped this episodic brinksmanship and . . . mothballed the nuclear weapon here, which is the threat of default, for a longer duration,” Carney said. “But it is certainly at least an encouraging sign that . . . they are not listening to the debt-limit and default deniers.” If Republicans now recognize that default cannot be permitted, he added, “why keep the nuclear weapon in your back pocket?”
The first reactions from Republican House members appeared generally positive. But several insisted they would back the measure only with a commitment from the president to open negotiations over the next debt-ceiling hike.
“All we’re doing is saying, if the president hasn’t come towards us, we’ll just move the deadline out and offer it again,” said Rep. John Fleming (R-La.). “We haven’t changed our position. We’ve just changed the timeline.”
Fleming rejected the idea that the proposal represents a concession from Republicans. “Not really, if we get a concession from the president, to sit down and negotiate. If he doesn’t agree to that, I won’t agree to the debt ceiling.”
Meanwhile, several of the House’s most conservative members withheld comment about the proposal. “I’m not very enthusiastic,” Rep. Steve King (R-Iowa) said without elaborating.
Rep. Steve Scalise (R-La.), chairman of the Republican Study Committee, was noncommittal when asked about the plan and said his support depends on what happens in the meeting with the president Thursday.
“Some of this involves a conversation with the president,” Scalise said. “There’s nothing unilateral that can be done. It’s going to involve having the president finally put some things on the table of his own.”
Heritage Action for America, a conservative advocacy group influential with tea party Republicans, said Thursday that while it remains committed to fighting Obama’s health-care law and opposes “clean debt ceiling increases,” it wants to give House GOP leaders “the flexibility they need to refocus the debate on Obamacare.” Therefore, the group said, it will not include votes in favor of the proposal in its rankings of lawmakers’ conservatism.
The plan would meet Obama’s demand for an increase in Treasury’s borrowing authority without any legislative riders. But it would set the stage for tough negotiations, possibly lasting until Thanksgiving, over bigger fiscal matters, since the tentative plan calls for only a six-week increase of the debt limit.
Advisers cautioned that Boehner’s often unruly caucus, which has repeatedly rejected leadership initiatives in the past, needs to sign off on the plan before it can advance.
Reacting to the GOP proposal, a White House official said: “It is better for economic certainty for Congress to take the threat of default off the table for as long as possible, which is why we support the Senate Democrats’ efforts to raise the debt limit for a year with no extraneous political strings attached.”
Obama also wants House Republicans to allow a vote on the “clean” government funding bill that has been passed by the Senate, the official said. “Once Republicans in Congress act to remove the threat of default and end this harmful government shutdown, the president will be willing to negotiate on a broader budget agreement,” the official added. “While we are willing to look at any proposal Congress puts forward to end these manufactured crises, we will not allow a faction of the Republicans in the House to hold the economy hostage to its extraneous and extreme political demands. Congress needs to pass a clean debt-limit increase and a funding bill to reopen the government.”
Financial experts much prefer a longer-term extension of the debt ceiling, but even a brief extension would ease some of the turmoil that has been brewing on Wall Street. By the time markets closed Monday afternoon, the Dow had dropped 900 points in 14 trading days, losing almost 6 percent of its value.
Just three weeks ago, Boehner’s leadership team presented a plan to lift the debt ceiling accompanied by a one-year delay of Obama’s health-care law and a litany of other conservative domestic policy demands.
With Washington in gridlock and a key deadline in the debt-limit debate just one week away, Lew told the Senate Finance Committee Thursday morning that he would do all he can to minimize the pain of breaching the $16.7 trillion debt limit. But Lew also told the senators that in an unprecedented situation in which he would be relying entirely on the erratic flow of incoming revenue, the economy would suffer and there would not even be certainty that the government could make all interest and principal payments.
“No credible economist or business leader thinks that defaulting is good for job creation or economic growth,” Lew said. “If Congress fails to meet its responsibility, it could be deeply damaging to the financial markets, the ongoing economic recovery, and the jobs and savings of millions of Americans.”
Rep. Jim Jordan (R-Ohio), a key conservative with ties to leadership and more junior tea party-backed colleagues, said Thursday morning that he and his colleagues “potentially” could support the new GOP debt-ceiling plan.
“We think there needs to be some movement in dealing with the overall problem,” he said. “It’d be nice to get some dollar-to-dollar cuts there.”
Asked whether he could support a short-term increase without related cuts, Jordan said he expected that question would be the primary topic of conversation among House Republicans on Thursday.
Amid growing anxiety about a debt default, Republicans in the House and the Senate floated ideas Wednesday for raising the debt limit — if only for a short time — in hopes of forcing Obama to the negotiating table.
One of the most significant ideas was brewing in the House, where Budget Committee Chairman Paul Ryan (R-Wis.) briefed conservatives on a plan to raise the debt limit for six weeks, which would give party leaders time to negotiate a broad agreement to overhaul the tax code and trim federal health-care and retirement spending.
The plan, which Ryan sketched in a Wall Street Journal opinion piece Wednesday, was short on details. And it called for spending cuts of roughly $200 billion to cover the cost of raising the debt limit even in the near term — although senior GOP advisers said late Wednesday that they were also considering an increase with no strings attached.
Lew’s appearance is the first public confrontation between a senior administration official and Republicans since the fiscal showdown began last month. The meeting comes as some lawmakers on Capitol Hill are questioning whether the administration has been too alarmist about the threat of going past an Oct. 17 deadline to raise the debt ceiling. Republicans have cited reports by credit-rating firms saying that the United States would not technically default unless it fails to make interest payments on its debt — which they regard as unlikely.
Echoing points made by Republican presidents and officials in prior administrations, Lew is tried to counter that argument by highlighting the broad risks of leaving the government with no borrowing authority.
“Certain members of the House and Senate believe that it is possible to protect our economy by simply paying only the interest on our debts, while stopping or delaying payments on a number of our other legal commitments,” Lew said. “The United States should not be put in a position of making such perilous choices for our economy and our citizens. There is no way of knowing the irrevocable damage such an approach would have on our economy and financial markets.”
For example, officials say, Lew pointed out that the Treasury routinely refinances about $100 billion in debt every week, paying back principal and taking on new debt. He noted that should investors back away from Treasury debt, it could make refinancing difficult and throw the country’s financial markets into even greater chaos.
Lew said the administration will face a series of difficult decisions even if Treasury can avoid what the credit-rating firms consider a default. In a scenario where federal spending will far exceed revenue, he said, the administration would have only imperfect options in deciding whom to pay. Officials say Lew will try to push Republicans to decide whom they wouldn’t pay — Social Security recipients or veterans.
“We are relying on investors from all over the world to continue to hold U.S. bonds . . .,” Lew said. “If U.S. bondholders decided that they wanted to be repaid rather than continuing to roll-over their Treasury investments, we could unexpectedly dissipate our entire cash balance.”
Lew confronted a Senate Finance Committee stocked with Republicans who have been skeptical about the administration’s claims that breaching the debt limit would be catastrophic.
Among the committee’s members is Sen. Patrick J. Toomey (R-Pa.), who has championed the notion that the Treasury Department could avoid chaos in financial markets by continuing to make interest payments to investors.
The senior Republican on the panel, Sen. Orrin G. Hatch (Utah), has also expressed doubts about the risk of a debt-ceiling breach. But on Wednesday, Hatch acknowledged that blowing the Oct. 17 deadline would “scare the hell out of people.” And while Treasury might be able to pay interest on the debt, Hatch said, “the real question is whether it’s going to tank the stock market.”
Obama, when he meets Thursday with House GOP leaders, is planning to emphasize his refusal to “pay ransom” to avoid default and reopen the government. Ryan, nonetheless, held out hope that the “meeting at the White House will allow us to work together and find common ground.”
Thursday’s meeting is the second in a series the White House announced Wednesday aimed at breaking the impasse, reopening the government and raising the $16.7 trillion debt limit. Obama met first with House Democrats late Wednesday and plans to meet with each party in the Senate in the coming days, starting with a meeting with the Senate Democratic caucus Thursday.
Obama invited the entire 233-member GOP House conference to join him at the White House, but Republicans decided to send only an 18-member group comprising top leaders and key committee chairmen, including Ryan, Appropriations Chairman Harold Rogers (Ky.) and Ways and Means Chairman Dave Camp (Mich.).
“Nine days into a government shutdown and a week away from breaching the debt ceiling, a meeting is only worthwhile if it is focused on finding a solution,” Brendan Buck, a spokesman for Boehner, said in a statement. “That’s why the House Republican Conference will instead be represented by a smaller group of negotiators.”
The White House said Obama is “disappointed” by Boehner’s decision to limit Republican attendance and emphasized that Obama will not be negotiating.
“The president thought it was important to talk directly with the members who forced this economic crisis on the country about how the shutdown and a failure to pay the country’s bills could devastate the economy,” White House press secretary Jay Carney said in a statement.
Obama “will talk to anyone anytime . . . but will not pay the Republicans ransom for doing their job,” Carney said. “If the Republicans want to have a real discussion, they should open the government and take the threat of default off the table.”
Republicans on Capitol Hill, meanwhile, circulated a memo from one of the nation’s leading credit-rating agencies that seemed to play down the threat of default. In the memo, Moody’s Investors Service said the Treasury Department is likely to continue paying interest on the government’s debt even if Congress refuses to lift the limit on borrowing, preserving the nation’s sterling AAA credit rating.
“We believe the government would continue to pay interest and principal on its debt even in the event that the debt limit is not raised, leaving its creditworthiness intact,” said the Oct. 7 memo. “The debt limit restricts government expenditures to the amount of its incoming revenues; it does not prohibit the government from servicing its debt. There is no direct connection between the debt limit (actually the exhaustion of the Treasury’s extraordinary measures to raise funds) and a default.”
The memo offered a starkly different view of the consequences of breaching the debt limit than is held by the White House, many policymakers and other financial analysts. Over the weekend, economists at Goldman Sachs said the economy would take a devastating hit even if Treasury kept making payments on the debt, because the pullback in federal spending would amount to roughly $175 billion, or 4.2 percentage points of gross domestic product.
Mohamed El-Erian, the chief executive of PIMCO, the world’s largest bond company, agreed that the administration could take steps to contain the worst damage. But, he said, there would still be severe consequences.
“It would avoid a series of major and cascading disruptions to the functioning of a financial market that is at the heart of the core of the global financial system,” he said. “Having said that, equities and other risk assets would still likely sell off hard.”
Rep. Chris Van Hollen (D-Md.) noted that Moody’s analysis is geared toward the well-being of its own investors, not average Americans. “When they say their clients will be okay, they’re not talking about people on Society Security, Medicare or our troops in the field. Moody’s doesn’t give a damn about any of those people.”
William Branigin, Rosalind S. Helderman and Scott Wilson contributed to this report.
US GOVERNMENT COLLAPSE was all THEATRE says TRENDS journalist ‘GERALD CELENTE’ (ECONOMIC CS)
Obama Lies About the Implications of Raising the Debt Ceiling
JIM ROGERS on U.S. GOVERNMENT SHUTDOWN – U.S. NOT on Brink of DEFAULT & will PRINT more MONEY
Jack Lew attacks Ted Cruz and Tea Party – says they are dangerous exttremists
Dan Mitchell Debunking Myths about the Partial Government Shutdown
Does Government Have a Revenue or Spending Problem?
Funding Government by the Minute
What Can We Cut to Balance the Budget
Will Higher Tax Rates Balance the Budget?
Will Taxing the Rich Fix the Deficit?
What Are the Dangers of Too Much Debt?
How Big Is the U.S. Debt?
[youtube=
BUREAU OF THE FISCAL SERVICE
                                                  STAR - TREASURY FINANCIAL DATABASE
             TABLE 1.  SUMMARY OF RECEIPTS, OUTLAYS AND THE DEFICIT/SURPLUS BY MONTH OF THE U.S. GOVERNMENT (IN MILLIONS)

                                                        ACCOUNTING DATE:  08/13

   PERIOD                                                                     RECEIPTS                OUTLAYS    DEFICIT/SURPLUS (-)
+  ____________________________________________________________  _____________________  _____________________  _____________________
   PRIOR YEAR

     OCTOBER                                                                   163,072                261,539                 98,466
     NOVEMBER                                                                  152,402                289,704                137,302
     DECEMBER                                                                  239,963                325,930                 85,967
     JANUARY                                                                   234,319                261,726                 27,407
     FEBRUARY                                                                  103,413                335,090                231,677
     MARCH                                                                     171,215                369,372                198,157
     APRIL                                                                     318,807                259,690                -59,117
     MAY                                                                       180,713                305,348                124,636
     JUNE                                                                      260,177                319,919                 59,741
     JULY                                                                      184,585                254,190                 69,604
     AUGUST                                                                    178,860                369,393                190,533
     SEPTEMBER                                                                 261,566                186,386                -75,180

       YEAR-TO-DATE                                                          2,449,093              3,538,286              1,089,193

   CURRENT YEAR

     OCTOBER                                                                   184,316                304,311                119,995
     NOVEMBER                                                                  161,730                333,841                172,112
     DECEMBER                                                                  269,508                270,699                  1,191
     JANUARY                                                                   272,225                269,342                 -2,883
     FEBRUARY                                                                  122,815                326,354                203,539
     MARCH                                                                     186,018                292,548                106,530
     APRIL                                                                     406,723                293,834               -112,889
     MAY                                                                       197,182                335,914                138,732
     JUNE                                                                      286,627                170,126               -116,501
     JULY                                                                      200,030                297,627                 97,597
     AUGUST                                                                    185,370                333,293                147,923

       YEAR-TO-DATE                                                          2,472,542              3,227,888                755,345
REPORT ID: STM0P082
 USER ID  :
 DATE: 2013-09-10 TIME: 22.20.06                                                                                         PAGE   1(2)
1                                                    BUREAU OF THE FISCAL SERVICE
                                                  STAR - TREASURY FINANCIAL DATABASE
                            TABLE 3.  SUMMARY OF RECEIPTS AND OUTLAYS OF THE U.S. GOVERNMENT (IN MILLIONS)

                                                        ACCOUNTING DATE:  08/13

                                                                         ACTUAL          ACTUAL       ACTUAL COMP.     BUDGET EST.
   CLASSIFICATION                                                      THIS MONTH    THIS FY TO DATE  PRIOR PERIOD       FULL FY
+  _________________________________________________________________ _______________ _______________ _______________ _______________
   BUDGET RECEIPTS

   INDIVIDUAL INCOME TAXES                                                    85,286       1,175,536       1,015,419       1,309,683
   CORPORATION INCOME TAXES                                                    3,595         216,360         186,272         278,684

   SOCIAL INSURANCE AND RETIREMENT RECEIPTS:

     EMPLOYMENT AND GENERAL RETIREMENT (OFF-BUDGET)                           54,771         614,010         521,335         674,143
     EMPLOYMENT AND GENERAL RETIREMENT (ON-BUDGET)                            16,703         194,450         186,822         214,817
     UNEMPLOYMENT INSURANCE                                                    5,969          56,524          66,145          58,593
     OTHER RETIREMENT                                                            313           3,256           3,449           3,746
   EXCISE TAXES                                                                6,315          72,894          69,420          85,334
   ESTATE AND GIFT TAXES                                                       1,253          17,783          13,026          17,690
   CUSTOMS DUTIES                                                              2,843          28,859          27,570          32,154
   MISCELLANEOUS RECEIPTS                                                      8,322          92,871          98,069         101,719
   ALLOWANCES                                                                 ......          ......          ......          ......

       ;BTOTAL RECEIPTS                                                      185,370       2,472,542       2,187,527       2,776,563

         ;C(ON-BUDGET)                                                       130,599       1,858,532       1,666,192       2,102,420
         ;C(OFF-BUDGET)                                                       54,771         614,010         521,335         674,143

   ;CBUDGET OUTLAYS

   LEGISLATIVE BRANCH                                                            345           3,955           4,097           4,792
   JUDICIAL BRANCH                                                               669           6,508           6,650           7,283
   DEPARTMENT OF AGRICULTURE                                                  10,859         146,486         129,810         159,620
   DEPARTMENT OF COMMERCE                                                        682           8,322           9,513           9,391
   DEPARTMENT OF DEFENSE-MILITARY PROGRAMS                                    53,367         559,942         601,176         610,266
   DEPARTMENT OF EDUCATION                                                     7,028          38,725          53,177          44,431
   DEPARTMENT OF ENERGY                                                        1,650          22,576          29,635          25,977
   DEPARTMENT OF HEALTH AND HUMAN SERVICES                                    94,535         832,894         793,470         903,970
   DEPARTMENT OF HOMELAND SECURITY                                             3,633          52,272          43,932          58,377
   DEPARTMENT OF HOUSING AND URBAN DEVELOPMENT                                 2,289          32,545          46,807          56,518
   DEPARTMENT OF THE INTERIOR                                                  1,153           8,455          11,393           9,964
   DEPARTMENT OF JUSTICE                                                       2,428          27,125          28,226          29,897
   DEPARTMENT OF LABOR                                                         5,972          75,930          98,314          86,163
   DEPARTMENT OF STATE                                                         1,714          21,774          23,222          29,536
   DEPARTMENT OF TRANSPORTATION                                                7,730          67,605          66,944          78,505

   DEPARTMENT OF THE TREASURY:

     INTEREST ON TREASURY DEBT SECURITIES (GROSS)                             25,488         395,826         342,541         414,655
     OTHER                                                                     2,619          23,821         135,586         -10,700
   DEPARTMENT OF VETERANS AFFAIRS                                             17,996         131,489         118,198         138,901
It is the economic calamity that no one expects and everyone fears.
Experts agree that failing to raise the nation’s debt ceiling by Oct. 17, when U.S. officials say the government will run out of money to pay its bills, would gravely wound the economy, and perhaps even throw it back into recession. Because Treasury bonds and the dollar are cornerstones of the global financial system, meanwhile, the shock wave would be felt around the world.
“The potential is disastrous,” said Gus Faucher, senior economist with PNC Financial Services Group. “We would see interest rates spike across the board. We’d see a huge crash in the dollar. People count on lending their money to the federal government and getting it back, and if that trust is taken away — it’s never happened that we haven’t met our obligations as a nation — then that has very, very negative consequences for the U.S. economy.”
The consequences are so severe that, even as the government shutdown enters its second week, most seasoned political observers still expect Congress to ultimately reach an eleventh-hour deal to lift the government’s borrowing limit.
But what exactly is the debt ceiling, and exactly how worried should Americans be that it could come crashing down?
What is the debt ceiling?
The debt ceiling is the total amount of money the U.S. government can borrow (by selling Treasury bonds) to pay its obligations, including interest on the national debt, Social Security and Medicare benefits, and many other payments. That limit is currently $16.7 trillion, although technically the government already exceeded it in May. The Treasury Department has since used various measures to continue borrowing.
During World War I, amid uncertainty regarding the total costs of funding U.S. involvement in the conflict, Congress created the cap in 1917 to put an upper limit on federal borrowing. Since 1960, Congress has raised the debt ceiling 78 times.
How is the debt ceiling changed?
Lawmakers can adjust it by passing a standalone bill or by including it in another piece of legislation as an amendment.
Does raising the debt ceiling increase the federal debt?
No. Lifting the borrowing limit simply allows the government to pay its existing bills. That debt exists whether or not Congress authorizes additional borrowing, and to avoid default it must be paid.
Why can’t Congress and the White House avoid lifting the cap by cutting federal spending?
Because preventing the government from borrowing to meet its obligations would require all discretionary spending, such as for defense, education, housing and other annual appropriations, to stop, according to the Congressional Research Service. Most of the outlays for mandatory programs, such as Social Security, also would have to be halted, while taxes would need to rise to ensure the government had money to spend. Deep spending cuts and tax hikes would throw the economy into recession.
Why is Oct. 17 a critical date?
Treasury Secretary Jacob Lew recently forecastthat on Oct. 17 the government would have about $30 billion on hand. That isn’t enough because the government spends as much as $60 billion per day. “If we have insufficient cash on hand, it would be impossible for the United States of America to meet all of its obligations for the first time in our history,” he said last week in a letter to congressional leaders.
What happens if Congress doesn’t raise the debt ceiling?
If the government runs low on cash, it will have to withhold a range of payments. Retirees might not get their Social Security checks, especially worrisome for the millions of Americans who depend almost entirely on the social insurance program for income. The same goes for Medicare and Medicaid recipients. Holders of Treasury notes, from Wall Street and other global banks to foreign governments, also could get stiffed, jeopardizing the solvency of many financial institutions and choking off global credit flows.
The U.S. also would struggle to pay the interest on its debt, including a $6 billion payout due at the end of the month. At that point, the U.S. would be in default of its obligations. The value of Treasury bonds and the dollar would nosedive. The nation’s borrowing costs would soar as anxious investors demanded a higher return to buy suddenly shaky U.S. debt. And because the interest rate on Treasuries provides a benchmark for rates on other loans, from mortgages and credit cards to car and student loans, borrowing would become far more costly for consumers and businesses. Stock markets in the U.S. and elsewhere around the world would almost certainly plunge.
“When stock prices fall, investment or other spending to expand a business is more costly,” the Treasury Department said in a report last week outlining the potential impact of the debt-ceiling fight. “The effects on households and businesses, moreover, are reinforcing. Less capacity and willingness of households to spend, when businesses have less incentive to invest, hire and expand production, all lead to weaker economic activity.”
In short, the already fragile economic recovery could stall.
Haven’t we been here before?
There is recent precedent for such turmoil. Consumer confidence plummeted after lawmakers squared off over the debt ceiling in the summer of 2011, while the Standard & Poor’s 500 stock index dropped nearly 20 percent. Hiring among small businesses slowed. Ever after a deal was struck to raise the cap in August of that year, credit rating agency Standard & Poor’s downgraded U.S. debt for the first time ever.
Beyond the immediate economic fallout of defaulting on its debt, for the U.S. the symbolic blow might be even greater. In the post-World War II era, Treasuries and the greenback have — for better and for worse — served as the foundation of the global financial system. A default would shatter the faith on which that system relies.
How much danger are we in?
Although financial markets are not yet in panic mode, the standoff in Washington has them worried. Unlike during the 2011 dispute, when Republicans and most Democrats favored cutting federal spending, the stark division over Obamacare suggests there may be less room for compromise this time around. One clear sign of distress: Interest rates on short-term Treasury bonds rose last week, as investors seek greater yields to offset what they perceive as the greater risk of holding the debt.
Still, most economists, stock analysts and, for all the pointed rhetoric on Capitol Hill, even congressional leaders themselves downplay the chances of a default. The belief is that common sense, or at least a sense of political self-preservation, will prevail.
BUREAU OF THE FISCAL SERVICE
                                                  STAR - TREASURY FINANCIAL DATABASE
             TABLE 1.  SUMMARY OF RECEIPTS, OUTLAYS AND THE DEFICIT/SURPLUS BY MONTH OF THE U.S. GOVERNMENT (IN MILLIONS)

                                                        ACCOUNTING DATE:  08/13

   PERIOD                                                                     RECEIPTS                OUTLAYS    DEFICIT/SURPLUS (-)
+  ____________________________________________________________  _____________________  _____________________  _____________________
   PRIOR YEAR

     OCTOBER                                                                   163,072                261,539                 98,466
     NOVEMBER                                                                  152,402                289,704                137,302
     DECEMBER                                                                  239,963                325,930                 85,967
     JANUARY                                                                   234,319                261,726                 27,407
     FEBRUARY                                                                  103,413                335,090                231,677
     MARCH                                                                     171,215                369,372                198,157
     APRIL                                                                     318,807                259,690                -59,117
     MAY                                                                       180,713                305,348                124,636
     JUNE                                                                      260,177                319,919                 59,741
     JULY                                                                      184,585                254,190                 69,604
     AUGUST                                                                    178,860                369,393                190,533
     SEPTEMBER                                                                 261,566                186,386                -75,180

       YEAR-TO-DATE                                                          2,449,093              3,538,286              1,089,193

   CURRENT YEAR

     OCTOBER                                                                   184,316                304,311                119,995
     NOVEMBER                                                                  161,730                333,841                172,112
     DECEMBER                                                                  269,508                270,699                  1,191
     JANUARY                                                                   272,225                269,342                 -2,883
     FEBRUARY                                                                  122,815                326,354                203,539
     MARCH                                                                     186,018                292,548                106,530
     APRIL                                                                     406,723                293,834               -112,889
     MAY                                                                       197,182                335,914                138,732
     JUNE                                                                      286,627                170,126               -116,501
     JULY                                                                      200,030                297,627                 97,597
     AUGUST                                                                    185,370                333,293                147,923

       YEAR-TO-DATE                                                          2,472,542              3,227,888                755,345

http://www.fms.treas.gov/mts/mts0813.txt
No Fed Taper: What Does It Mean for Your Money? (9/18/13)
Federal Reserve: No Taper (9/18/13)
Ron Paul: Fed Decision To Not Taper Is A Really Bad Sign
Ron Paul: Taper Fakeout Means Fed Is Worried
Breaking News: Federal Reserve Will Not Taper
Rick Santelli Reacts to Federal Reserve No Taper
Why The Fed. Will INCREASE, NOT DECREASE, It’s QE/Money Printing. By Gregory Mannarino
In Business – Fed Taper Pause Fuels Commodities Rally
To Taper, or Not to Taper
FED Says No Taper — We Need A War, Gun Confiscation And Control Of Internet First — Episode 166
JIM RICKARDS: Fed Will TAPER in September or Never, and the Looming MONETARY System COLLAPSE [50]
James Rickards on “Why The Fed Will NOT Taper Quantitative Easing”
Peter Schiff: “The party is coming to an end”.
JIM ROGERS – When the FED stops PRINTING FIAT CURRENCY the COLLAPSE will be here. PREPARE NOW
Fed decision Just idea of tapering caused huge ruckus
Background Articles and Videos
Milton Friedman – Abolish The Fed
Milton Friedman On John Maynard Keynes
Free to Choose Part 3: Anatomy of a Crisis (Featuring Milton Friedman)
Murray Rothbard – To Expand And Inflate
The Founding of the Federal Reserve | Murray N. Rothbard
The Origin of the Fed – Murray N. Rothbard
Murray Rothbard on Hyperinflation and Ending the Fed
Murray N. Rothbard on Milton Friedman (audio – removed noise) part 1/5
Keynes the Man: Hero or Villain? | Murray N. Rothbard
WASHINGTON (AP) — The Federal Reserve has decided against reducing its stimulus for the U.S. economy, saying it will continue to buy $85 billion a month in bonds because it thinks the economy still needs the support.
The Fed said in a statement Wednesday that it held off on tapering because it wants to see more conclusive evidence that the recovery will be sustained.
Stocks spiked after the Fed released the statement at the end of its two-day policy meeting.
In the statement, the Fed says that the economy is growing moderately and that some indicators of labor market conditions have shown improvement. But it noted that rising mortgage rates and government spending cuts are restraining growth.
The bond purchases are intended to keep long-term loan rates low to spur borrowing and spending.
The Fed also repeated that it plans to keep its key short-term interest rate near zero at least until unemployment falls to 6.5 percent, down from 7.3 percent last month. In the Fed’s most recent forecast, unemployment could reach that level as soon as late 2014.
Many thought the Fed would scale back its purchases. But interest rates have jumped since May, when Fed Chairman Ben Bernanke first said the Fed might slow its bond buys later this year. But Bernanke cautioned that the reduction would hinge on the economy showing continued improvement.
In its statement, the Fed says that the rise in interest rates “could slow the pace of improvement in the economy and labor market” if they are sustained.
The Fed also lowered its economic growth forecasts for this year and next year slightly, likely reflecting its concerns about interest rates.
The statement was approved on a 9-1 vote. Esther George, president of the Federal Reserve Bank of Kansas City, dissented for the sixth time this year. She repeated her concerns that the bond purchases could fuel the risk of inflation and financial instability.
The decision to maintain its stimulus follows reports of sluggish economic growth. Employers slowed hiring this summer, and consumers spent more cautiously.
Super-low rates are credited with helping fuel a housing comeback, support economic growth, drive stocks to record highs and restore the wealth of many Americans. But the average rate on the 30-year mortgage has jumped more than a full percentage point since May and was 4.57 percent last week — just below the two-year high.
The unemployment rate is now 7.3 percent, the lowest since 2008. Yet the rate has dropped in large part because many people have stopped looking for work and are no longer counted as unemployed — not because hiring has accelerated. Inflation is running below the Fed’s 2 percent target.
The Fed meeting took place at a time of uncertainty about who will succeed Bernanke when his term ends in January. On Sunday, Lawrence Summers, who was considered the leading candidate, withdrew from consideration.
Summers’ withdrawal followed growing resistance from critics. His exit has opened the door for his chief rival, Janet Yellen, the Fed’s vice chair. If chosen by President Barack Obama and confirmed by the Senate, Yellen would become the first woman to lead the Fed.
Bernanke tells Congress Fed flexible on bond buying
Ben Shalom Bernanke NOT Ready To Declare “Too Big To Fail” A Thing Of The Past
Peter Schiff Speaks At 2013 Las Vegas MoneyShow
Peter Schiff – US Hasn’t Had A Real Recovery Or Even A Real Recession Yet
Peter Schiff – Economic Predictions
Peter Schiff – Fed Will NEVER Stop Q E! They Can t The US Economy Will Collapse!
Next Fed Chair Bets Make ‘Hot Parlor Game’: Green
U.S. Fed balance sheet grows 7 straight weeks
The U.S. Federal Reserve’s balance sheet grew for a seventh week in the latest week as the U.S. central bank increased its holdings of Treasuries and mortgage-backed securities, Fed data released on Thursday showed.
The Fed’s balance sheet liabilities, which are a broad gauge of its lending to the financial system, stood at $3.495 trillion on July 17, compared with $3.462 trillion on July 10.
The Fed’s holdings of Treasuries rose to $1.962 trillion as of Wednesday, from $1.953 trillion the previous week.
The Fed’s ownership of mortgage bonds guaranteed by Fannie Mae, Freddie Mac and the Government National Mortgage Association (Ginnie Mae) increased to $1.235 trillion from $1.208 trillion from the previous week.
The Fed’s holdings of debt issued by Fannie Mae, Freddie Mac and the Federal Home Loan Bank system totaled $66.52 billion, down from $69.18 billion from the previous week.
The Fed’s overnight direct loans to credit-worthy banks via its discount window averaged $13 million a day during the week, compared with $14 million a day the previous week.
Is The Fed Really Tightening? Fed Policy in Two Charts.
Donald Marron,
The Fed believes the stimulus from quantitative easing depends on the stock of Treasuries and mortgage-backed securities that it owns, not on the flow of its purchases. If that view is correct, the future tapering of Fed purchases won’t be monetary tightening, it will a slowing pace of monetary easing (click for larger chart):
The chart shows a hypothetical trajectory for the Fed’s bond and MBS holdings. Under the stock view, that trajectory will go through three stages, paralleling those of traditional interest rate policy:
Quantitative easing: The Fed expands its balance sheet by buying Treasuries and MBS. Current pace: $85 billion each month.
Quantitative accommodation: The Fed maintains its balance sheet; it buys new assets to replace older ones as they mature.
Quantitative tightening: The Fed contracts its balance sheet by allowing assets to mature without replacement or, more aggressively, by selling them.
In this view, tapering is the final stage of quantitative easing. The Fed buys assets during tapering, but at a slower tempo. Tapering is not tightening.
That view is clear, logical, and elegant. But it utterly fails to explain why financial markets went haywire last week when Ben Bernanke and company talked about tapering.
One reason is investor expectations. The Fed has been trying to stimulate the economy not only through QE, but also by telling investors to expect easing in the future. Such forward guidance can be a powerful lever for monetary policy.
Last week, investors learned that QE might end sooner than they expected. In the stock view with expectations, that is monetary tightening. As illustrated in the second chart, future Fed policy would be tighter than financial markets had previously thought.*
This view likely explains some of the market reaction to recent Fed statements. But it’s hard to reconcile the magnitude of the movements. Suppose markets expected tapering to begin in January and now think September more likely. All else equal, that four-month difference implies a $340 billion reduction in the Fed’s ultimate portfolio. That’s something, but could that alone explain the sharp market response?
My sense it that something else must be going on as well. Some candidates include:
Perhaps the flow of Fed purchases matters, not just the stock. This view appears much more common among traders than Fed economists. If anyone has a reference for a good articulation of this view, I’d love to see it. The flow shouldn’t matter in normal times—was the Fed tightening when the flow of purchases was essentially zero for decades before the recent crisis?—but these are hardly normal times. Perhaps the flow matters when you are at the zero lower bound?
Perhaps world financial markets expected a much longer period of QE and are highly geared to Fed policy. If I am reading it correctly, that’s the view of Vince Foster who discusses the unwinding of the carry trade (ht Tyler Cowen)
Perhaps something else also happened. Scott Sumner discusses one possibility: turmoil in China’s financial sector spilling over into U.S. markets.
* This definition of tightening compares the new expected trajectory of Fed holdings to prior expectations. Such comparisons are relative; in principle, one could equally say that the Fed announcement indicated that future policy would be less loose, not that it would be tighter. But for most purposes, it seems simpler just to say that future policy has gotten tighter. The same semantic issue exists in fiscal policy. If Medicare spending is scheduled to grow $35 billion next year, what do we call a proposal under which spending increases $30 billion? We usually call that a $5 billion spending cut since it’s a decline relative to an accepted baseline. But we should remember that Medicare spending is growing. The same seems true with early tapering. Tightening seems the cleanest description for most purposes, even though in absolute terms it is slower easing.
We speak with Guardian columnist Glenn Greenwald, who broke the story Thursday that the National Security Agency has obtained access the central servers of nine major internet companies — including Google, Microsoft, Apple, Yahoo and Facebook. The Guardian and the Washington Post revealed the top secret program, code-named PRISM, after they obtained several slides from a 41-page training presentation for senior intelligence analysts. It explains how PRISM allows them to access emails, documents, audio and video chats, photographs, documents and connection logs that allow them to track a person or trace their connections to others. One slide lists the companies by name and the date when each provider began participating over the past six years. “Hundreds of millions of Americans, and hundreds of millions — in fact billions of people around the world — essentially rely on the internet exclusively to communicate with one another,” Greenwald says. “Very few people use landline phones for much of anything. So when you talk about things like online chat, and social media messages, and emails, what you’re really talking about is the full extent of human communication.” This comes after Greenwald revealed Wednesday in another story that the NSA has been collecting the phone records of millions of Verizon customers. “They want to make sure that every single time human beings interact with one another … that they can watch it, and they can store it, and they can access it at any time.”
Health Insurance Options Delayed For Small Businesses
Key Piece Of ObamaCare Set To Miss Major Deadline
ObamaCare’s Tax Surprise
Morning Joe Panel Rips GOP Strategist Over Obamacare Delay You Just Want ‘Election Year Issue’
The Political Insiders on NSA, Immigration, and More!
Mark Levin on Hannity talking IRS, Benghazi and AP scandals
The Obama IRS Targeting Scandal in Five Minutes – Unbelievable Abuse of Power
An IRS Cover-up? – New Evidence Emerges In IRS Scandal – On The Record
Dr Ben Carson Talks Obamacare Future Disaster Waiting to Hap
Megyn Kelly Explodes At Liberal Guest Over Benghazi Come On! Can We Have Some Honesty!
2013-05-28, Tues_Glenn Beck, The Blaze TV
Background Articles and Videos
Know The TRUTH ~ Step By Step ~ Bret Baier’s ~ ‘Death and Deceit in Benghazi’
House hearing on IRS scandal
Eric Holder testifies before House Judiciary committee
Democrats Split On How To Deal With Nation’s Debt, Key Leaders Come Out Against Spending Cuts
Chairman Hensarling Opening Statement at Hearing with Federal Reserve Chairman Bernanke
Chairman Hensarling’s Opening Statement at Hearing with FHFA Director Edward J. DeMarco
US Debt A Threat To National Security
U.S. National Debt Documentary Part 1
U.S. National Debt Documentary Part 2
U.S. National Debt Documentary Part 3
U.S. National Debt Documentary Part 4
U.S. National Debt Documentary Part 5
U.S. National Debt Documentary Part 6
‘US hides real debt, in worse shape than Greece’
Does Government Have a Revenue or Spending Problem?
What If the National Debt Were Your Debt?
How Big Is the U.S. Debt?
Funding Government by the Minute
Why Not Print More Money?
Yaron Answers: Can The U.S. Go Bankrupt?
US Debt Crisis – Perfectly Explained
Deficits, Debts and Unfunded Liabilities: The Consequences of Excessive Government Spending
Capitalism Without Guilt – Yaron Brook on morals of capitalism.
The Budget and Economic Outlook: Fiscal Years 2013 to 2023
Economic growth will remain slow this year, CBO anticipates, as gradual improvement in many of the forces that drive the economy is offset by the effects of budgetary changes that are scheduled to occur under current law. After this year, economic growth will speed up, CBO projects, causing the unemployment rate to decline and inflation and interest rates to eventually rise from their current low levels. Nevertheless, the unemployment rate is expected to remain above 7½ percent through next year; if that happens, 2014 will be the sixth consecutive year with unemployment exceeding 7½ percent of the labor force—the longest such period in the past 70 years.
If the current laws that govern federal taxes and spending do not change, the budget deficit will shrink this year to $845 billion, or 5.3 percent of gross domestic product (GDP), its smallest size since 2008. In CBO’s baseline projections, deficits continue to shrink over the next few years, falling to 2.4 percent of GDP by 2015. Deficits are projected to increase later in the coming decade, however, because of the pressures of an aging population, rising health care costs, an expansion of federal subsidies for health insurance, and growing interest payments on federal debt. As a result, federal debt held by the public is projected to remain historically high relative to the size of the economy for the next decade. By 2023, if current laws remain in place, debt will equal 77 percent of GDP and be on an upward path, CBO projects (see figure below).
Such high and rising debt would have serious negative consequences: When interest rates rose to more normal levels, federal spending on interest payments would increase substantially. Moreover, because federal borrowing reduces national saving, the capital stock would be smaller and total wages would be lower than they would be if the debt was reduced. In addition, lawmakers would have less flexibility than they might ordinarily to use tax and spending policies to respond to unexpected challenges. Finally, such a large debt would increase the risk of a fiscal crisis, during which investors would lose so much confidence in the government’s ability to manage its budget that the government would be unable to borrow at affordable rates.
Under Current Law, Federal Debt Will Stay at Historically High Levels Relative to GDP
The federal budget deficit, which shrank as a percentage of GDP for the third year in a row in 2012, will fall again in 2013, if current laws remain the same. At an estimated $845 billion, the 2013 imbalance would be the first deficit in five years below $1 trillion; and at 5.3 percent of GDP, it would be only about half as large, relative to the size of the economy, as the deficit was in 2009. Nevertheless, if the laws that govern taxes and spending do not change, federal debt held by the public will reach 76 percent of GDP by the end of this fiscal year, the largest percentage since 1950.
With revenues expected to rise more rapidly than spending in the next few years under current law, the deficit is projected to dip as low as 2.4 percent of GDP by 2015. In later years, however, projected deficits rise steadily, reaching almost 4 percent of GDP in 2023. For the 2014–2023 period, deficits in CBO’s baseline projections total $7.0 trillion. With such deficits, federal debt would remain above 73 percent of GDP—far higher than the 39 percent average seen over the past four decades. (As recently as the end of 2007, federal debt equaled just 36 percent of GDP.) Moreover, debt would be increasing relative to the size of the economy in the second half of the decade.
Those projections are not CBO’s predictions of future outcomes. As specified in law, CBO’s baseline projections are constructed under the assumption that current laws generally remain unchanged, so that they can serve as a benchmark against which potential changes in law can be measured.
Revenues
Federal revenues will increase by roughly 25 percent between 2013 and 2015 under current law, CBO projects. That increase is expected to result from a rise in income because of the growing economy, from policy changes that are scheduled to take effect during that period, and from policy changes that have already taken effect but whose full impact on revenues will not be felt until after this year (such as the recent increase in tax rates on income above certain thresholds).
As a result of those factors, revenues are projected to grow from 15.8 percent of GDP in 2012 to 19.1 percent of GDP in 2015—compared with an average of 17.9 percent of GDP over the past 40 years. Under current law, revenues will remain at roughly 19 percent of GDP from 2015 through 2023, CBO estimates.
Outlays
In CBO’s baseline projections, federal spending rises over the next few years in dollar terms but falls relative to the size of the economy. During those years, the growth of spending will be restrained both by the strengthening economy (as spending for programs such as unemployment compensation drops) and by provisions of the Budget Control Act of 2011 (Public Law 112-25). Although outlays are projected to decline from 22.8 percent of GDP in 2012 to 21.5 percent by 2017, they will still exceed their 40-year average of 21.0 percent. (Outlays peaked at 25.2 percent of GDP in 2009 but have fallen relative to GDP in the past few years.)
After 2017, if current laws remain in place, outlays will start growing again as a percentage of GDP. The aging of the population, increasing health care costs, and a significant expansion of eligibility for federal subsidies for health insurance will substantially boost spending for Social Security and for major health care programs relative to the size of the economy. At the same time, rising interest rates will significantly increase the government’s debt-service costs. In CBO’s baseline, outlays reach about 23 percent of GDP in 2023 and are on an upward trajectory.
Changes from CBO’s Previous Projections
The deficits projected in CBO’s current baseline are significantly larger than the ones in CBO’s baseline of August 2012. At that time, CBO projected deficits totaling $2.3 trillion for the 2013–2022 period; in the current baseline, the total deficit for that period has risen by $4.6 trillion. That increase stems chiefly from the enactment of the American Taxpayer Relief Act of 2012 (P.L. 112-240), which made changes to tax and spending laws that will boost deficits by a total of $4.0 trillion (excluding debt-service costs) between 2013 and 2022, according to estimates by CBO and the staff of the Joint Committee on Taxation. CBO’s updated baseline also takes into account other legislative actions since August, as well as a new economic forecast and some technical revisions to its projections.
Looming Policy Decisions May Have a Substantial Effect on the Budget Outlook
Current law leaves many key budget issues unresolved, and this year, lawmakers will face three significant budgetary deadlines:
Automatic reductions in spending are scheduled to be implemented at the beginning of March; when that happens, funding for many government activities will be reduced by 5 percent or more.
The continuing resolution that currently provides operational funding for much of the government will expire in late March. If no additional appropriations are provided by then, nonessential functions of the government will have to cease operations.
A statutory limit on federal debt, which was temporarily removed, will take effect again in mid-May. The Treasury will be able to continue borrowing for a short time after that by using what are known as extraordinary measures. But to avoid a default on the government’s obligations, the debt limit will need to be adjusted before those measures are exhausted later in the year.
Budgetary outcomes will also be affected by decisions about whether to continue certain policies that have been in effect in recent years. Such policies could be continued, for example, by extending some tax provisions that are scheduled to expire (and that have routinely been extended in the past) or by preventing the 25 percent cut in Medicare’s payment rates for physicians that is due to occur in 2014. If, for instance, lawmakers eliminated the automatic spending cuts scheduled to take effect in March (but left in place the original caps on discretionary funding set by the Budget Control Act), prevented the sharp reduction in Medicare’s payment rates for physicians, and extended the tax provisions that are scheduled to expire at the end of calendar year 2013 (or, in some cases, in later years), budget deficits would be substantially larger over the coming decade than in CBO’s baseline projections. With those changes, and no offsetting reductions in deficits, debt held by the public would rise to 87 percent of GDP by the end of 2023 rather than to 77 percent.
In addition to those decisions, lawmakers will continue to face the longer-term budgetary issues posed by the substantial federal debt and by the implications of rising health care costs and the aging of the population.
Economic Growth Is Likely to Be Slow in 2013 and Pick Up in Later Years
The U.S. economy expanded modestly in calendar year 2012, continuing the slow recovery seen since the recession ended in mid-2009. Although economic growth is expected to remain slow again this year, CBO anticipates that underlying factors in the economy will spur a more rapid expansion beginning next year.
Even so, under the fiscal policies embodied in current law, output is expected to remain below its potential (or maximum sustainable) level until 2017 (see figure below). By CBO’s estimates, in the fourth quarter of 2012, real (inflation-adjusted) GDP was about 5½ percent below its potential level. That gap was only modestly smaller than the gap between actual and potential GDP that existed at the end of the recession because the growth of output since then has been only slightly greater than the growth of potential output. With such a large gap between actual and potential GDP persisting for so long, CBO projects that the total loss of output, relative to the economy’s potential, between 2007 and 2017 will be equivalent to nearly half of the output that the United States produced last year.
The Economic Outlook for 2013
CBO expects that economic activity will expand slowly this year, with real GDP growing by just 1.4 percent. That slow growth reflects a combination of ongoing improvement in underlying economic factors and fiscal tightening that has already begun or is scheduled to occur—including the expiration of a 2 percentage-point cut in the Social Security payroll tax, an increase in tax rates on income above certain thresholds, and scheduled automatic reductions in federal spending. That subdued economic growth will limit businesses’ need to hire additional workers, thereby causing the unemployment rate to stay near 8 percent this year, CBO projects. The rate of inflation and interest rates are projected to remain low.
The Economic Outlook for 2014 to 2018
After the economy adjusts this year to the fiscal tightening inherent in current law, underlying economic factors will lead to more rapid growth, CBO projects—3.4 percent in 2014 and an average of 3.6 percent a year from 2015 through 2018. In particular, CBO expects that the effects of the housing and financial crisis will continue to fade and that an upswing in housing construction (though from a very low level), rising real estate and stock prices, and increasing availability of credit will help to spur a virtuous cycle of faster growth in employment, income, consumer spending, and business investment over the next few years.
Nevertheless, under current law, CBO expects the unemployment rate to remain high—above 7½ percent through 2014—before falling to 5½ percent at the end of 2017. The rate of inflation is projected to rise slowly after this year: CBO estimates that the annual increase in the price index for personal consumption expenditures will reach about 2 percent in 2015. The interest rate on 3 month Treasury bills—which has hovered near zero for the past several years—is expected to climb to 4 percent by the end of 2017, and the rate on 10-year Treasury notes is projected to rise from 2.1 percent in 2013 to 5.2 percent in 2017.
The Economic Outlook for 2019 to 2023
For the second half of the coming decade, CBO does not attempt to predict the cyclical ups and downs of the economy; rather, CBO assumes that GDP will stay at its maximum sustainable level. On that basis, CBO projects that both actual and potential real GDP will grow at an average rate of 2¼ percent a year between 2019 and 2023. That pace is much slower than the average growth rate of potential GDP since 1950. The main reason is that the growth of the labor force will slow down because of the retirement of the baby boomers and an end to the long-standing increase in women’s participation in the labor force. CBO also projects that the unemployment rate will fall to 5.2 percent by 2023 and that inflation and interest rates will stay at about their 2018 levels throughout the 2019–2023 period.
Updated February 5, 2013, to correct an error in note “a” to Table 1-7.
Ben Bernanke Is The Most Dangerous Man In US History
US BOND BUBBLE’S READY TO BURST!
Max Keiser: Propped Up Bond Market Set To Burst In April
U.S. Government Bond Bubble to Burst, Faber Says
James Grant and James Turk discuss gold, the Fed and the fiscal situation of the USA
USA Will Die – Economic Collapse 2013 – Jim Rogers
JIM ROGERS – 2013 to Be Bad, ‘God Knows What Will Happen in 2014’
Jim Rogers Predicts Global Depression In 2013-2014
Peter Schiff on Max Keiser – Stopping the Global Financial Crisis
Keiser Report: Psyops & Debt Diets
Max Keiser: Will the next crash be on Bonds?
MAX KEISER: Colossal Collapse Coming! Keiser Report
MAX KEISER: Colossal Collapse Coming! Keiser Report
ALEX JONES & Max Keiser 2013, Year of The GREAT CRASH!
Peter Schiff – Dollar Could Collapse This Fall 2013
Peter Schiff – Economic Collapse 2013
Fed Will Keep Printing Until The Dollar Collapses~ Jim Rickards
Jim Rickards Gold is Money ($7,000 Gold Price)
James Rickards Predicts US Inflation in 2013 due to the Devaluation of the US dollar
Currency Wars: Jim Rickards
Financial Pearl Harbor’ is a Real Threat Warns a Pentagon Adviser
CNBC Global Recession Is Coming – Marc Faber
Dr. Marc Faber – US is in 50-100 trillion worth of debt!
Marc Faber ‘We Are in the End Game’ Part 1
Marc Faber ‘We Are in the End Game Part 2
Marc Faber – We Could See a 1987-Like Market Crash – Be Prepared and Get OUT!
Marc Faber-No Government Complies With Anything
Total Economic Collapse, Death of the Dollar, Impovershment, WWIII, Marc Faber Interview
Gerald Celente Deal Or No Debt Deal, The Debt Still Exists
Bill Gross: Economy Faces Structural Headwinds, “I Think We Are Facing Bubbles Almost Everywhere”
ECONOMIC CRASH WORLDWIDE STARTING
Harry Dent predicts global economic crash in 2013
Planned Economic Collapse 2013-2014
Background Articles and Videos
Meltdown (pt 1-4) The Secret History of the Global Financial Collapse 2010
Meltdown (pt 2-4) The Secret History of the Global Financial Collapse 2010
Meltdown (pt 3-4) The Secret History of the Global Financial Collapse.2010
Meltdown – pt 4-4 The Secret History of the Global Financial Collapse (2010)
The Fall of Lehman Brothers
Goldman Sachs: Power and Peril – Documentary
The Ascent of Money: A Financial History of The World by Niall Ferguson Epsd. 1-5 (Full Documentary)
The Fall of the Dollar – The Death of a Fiat Currency part 1
The Fall of the Dollar – The Death of a Fiat Currency part 2
The First 12 Hours of a US Dollar Collapse
LIFE HIDDEN TRUTH 2013 GLOBAL FINANCIAL CRISIS
Billionaires Dumping Stocks, Economist Knows Why
Despite the 6.5% stock market rally over the last three months, a handful of billionaires are quietly dumping their American stocks . . . and fast.
Warren Buffett, who has been a cheerleader for U.S. stocks for quite some time, is dumping shares at an alarming rate. He recently complained of “disappointing performance” in dyed-in-the-wool American companies like Johnson & Johnson, Procter & Gamble, and Kraft Foods.
In the latest filing for Buffett’s holding company Berkshire Hathaway, Buffett has been drastically reducing his exposure to stocks that depend on consumer purchasing habits. Berkshire sold roughly 19 million shares of Johnson & Johnson, and reduced his overall stake in “consumer product stocks” by 21%. Berkshire Hathaway also sold its entire stake in California-based computer parts supplier Intel.
With 70% of the U.S. economy dependent on consumer spending, Buffett’s apparent lack of faith in these companies’ future prospects is worrisome.
Unfortunately Buffett isn’t alone.
Fellow billionaire John Paulson, who made a fortune betting on the subprime mortgage meltdown, is clearing out of U.S. stocks too. During the second quarter of the year, Paulson’s hedge fund, Paulson & Co., dumped 14 million shares of JPMorgan Chase. The fund also dumped its entire position in discount retailer Family Dollar and consumer-goods maker Sara Lee.
Finally, billionaire George Soros recently sold nearly all of his bank stocks, including shares of JPMorgan Chase, Citigroup, and Goldman Sachs. Between the three banks, Soros sold more than a million shares.
So why are these billionaires dumping their shares of U.S. companies?
After all, the stock market is still in the midst of its historic rally. Real estate prices have finally leveled off, and for the first time in five years are actually rising in many locations. And the unemployment rate seems to have stabilized.
It’s very likely that these professional investors are aware of specific research that points toward a massive market correction, as much as 90%.
One such person publishing this research is Robert Wiedemer, an esteemed economist and author of the New York Times best-selling book Aftershock.
Before you dismiss the possibility of a 90% drop in the stock market as unrealistic, consider Wiedemer’s credentials.
In 2006, Wiedemer and a team of economists accurately predicted the collapse of the U.S. housing market, equity markets, and consumer spending that almost sank the United States. They published their research in the book America’s Bubble Economy.
The book quickly grabbed headlines for its accuracy in predicting what many thought would never happen, and quickly established Wiedemer as a trusted voice.
A columnist at Dow Jones said the book was “one of those rare finds that not only predicted the subprime credit meltdown well in advance, it offered Main Street investors a winning strategy that helped avoid the forty percent losses that followed . . .”
The chief investment strategist at Standard & Poor’s said that Wiedemer’s track record “demands our attention.”
And finally, the former CFO of Goldman Sachs said Wiedemer’s “prescience in (his) first book lends credence to the new warnings. This book deserves our attention.”
In the interview for his latest blockbuster Aftershock, Wiedemer says the 90% drop in the stock market is “a worst-case scenario,” and the host quickly challenged this claim.
Wiedemer calmly laid out a clear explanation of why a large drop of some sort is a virtual certainty.
It starts with the reckless strategy of the Federal Reserve to print a massive amount of money out of thin air in an attempt to stimulate the economy.
“These funds haven’t made it into the markets and the economy yet. But it is a mathematical certainty that once the dam breaks, and this money passes through the reserves and hits the markets, inflation will surge,” said Wiedemer.
“Once you hit 10% inflation, 10-year Treasury bonds lose about half their value. And by 20%, any value is all but gone. Interest rates will increase dramatically at this point, and that will cause real estate values to collapse. And the stock market will collapse as a consequence of these other problems.”
FLASHBACK: Obama Campaigning In ’04: Deficit Is “An Enormous Problem”
Lou Dobbs on irony of Obama’s new debt ceiling stance
Deficits, Debts and Unfunded Liabilities: The Consequences of Excessive Government
National Debt: 16 trillion visualized (with short lecture to the irresponsible)
EXPERT Peter Schiff Says Economic Collapse Is Comming And Is HERE NOW
Obama: I’ll Take Responsibility To Raise The Debt Ceiling! – Cavuto
Debt Limit Showdown Just Around The Corner | Ed Butowsky
Judge Napolitano: President Obama Absolutely Cannot Use the 14th Amendment to R
Reuters Today: Bernanke pleads for higher debt ceiling
 FINANCIAL MANAGEMENT SERVICE
                                                  STAR - TREASURY FINANCIAL DATABASE
             TABLE 1.  SUMMARY OF RECEIPTS, OUTLAYS AND THE DEFICIT/SURPLUS BY MONTH OF THE U.S. GOVERNMENT (IN MILLIONS)

                                                        ACCOUNTING DATE:  12/12

   PERIOD                                                                     RECEIPTS                OUTLAYS    DEFICIT/SURPLUS (-)
+  ____________________________________________________________  _____________________  _____________________  _____________________
   PRIOR YEAR

     OCTOBER                                                                   163,072                261,539                 98,466
     NOVEMBER                                                                  152,402                289,704                137,302
     DECEMBER                                                                  239,963                325,930                 85,967
     JANUARY                                                                   234,319                261,726                 27,407
     FEBRUARY                                                                  103,413                335,090                231,677
     MARCH                                                                     171,215                369,372                198,157
     APRIL                                                                     318,807                259,690                -59,117
     MAY                                                                       180,713                305,348                124,636
     JUNE                                                                      260,177                319,919                 59,741
     JULY                                                                      184,585                254,190                 69,604
     AUGUST                                                                    178,860                369,393                190,533
     SEPTEMBER                                                                 261,566                186,386                -75,180

       YEAR-TO-DATE                                                          2,449,093              3,538,286              1,089,193

   CURRENT YEAR

     OCTOBER                                                                   184,316                304,311                119,995
     NOVEMBER                                                                  161,730                333,841                172,112
     DECEMBER                                                                  269,501                269,760                    260

       YEAR-TO-DATE                                                            615,546                907,913                292,367


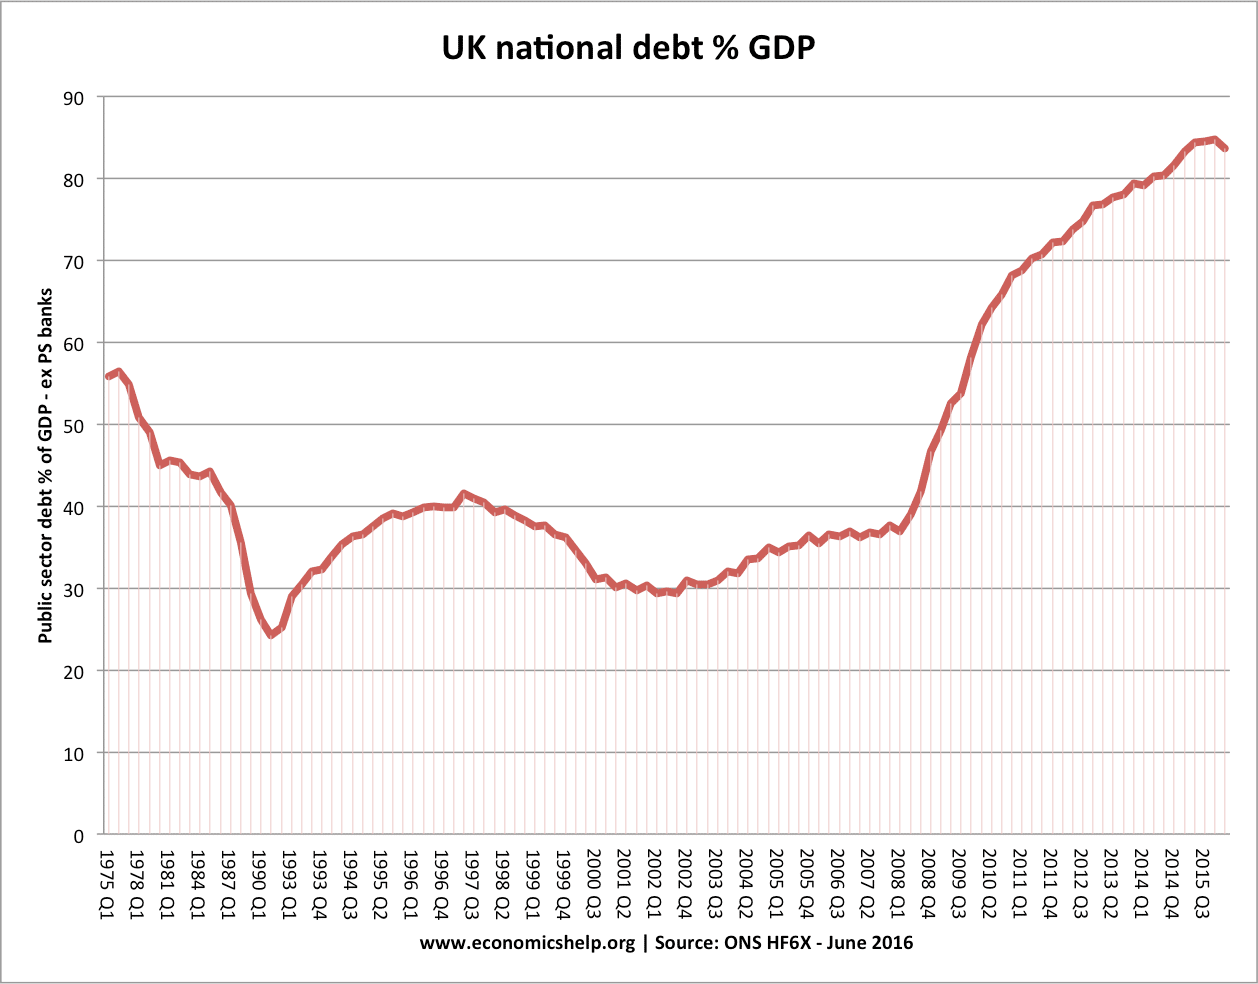


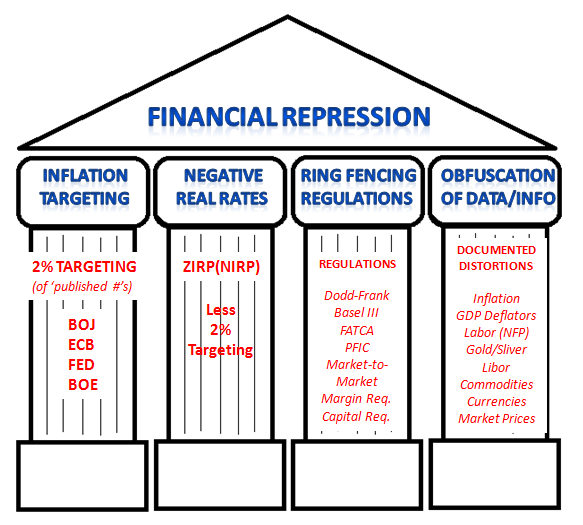


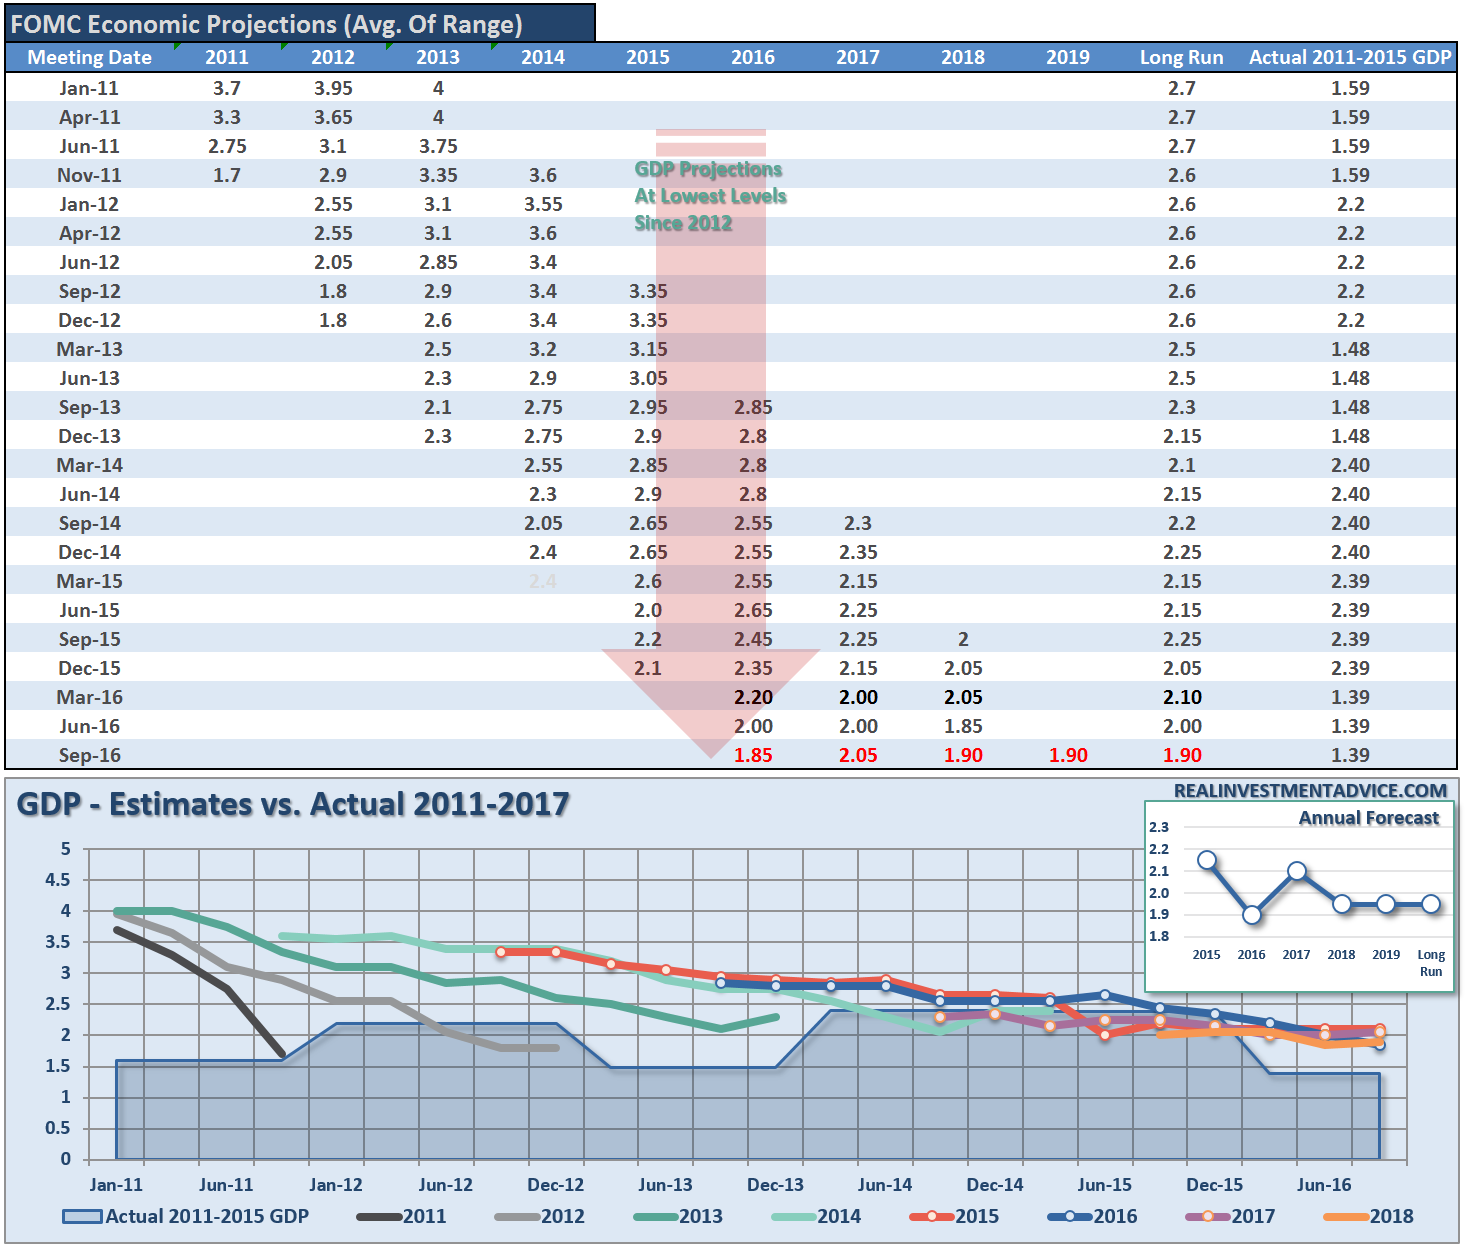


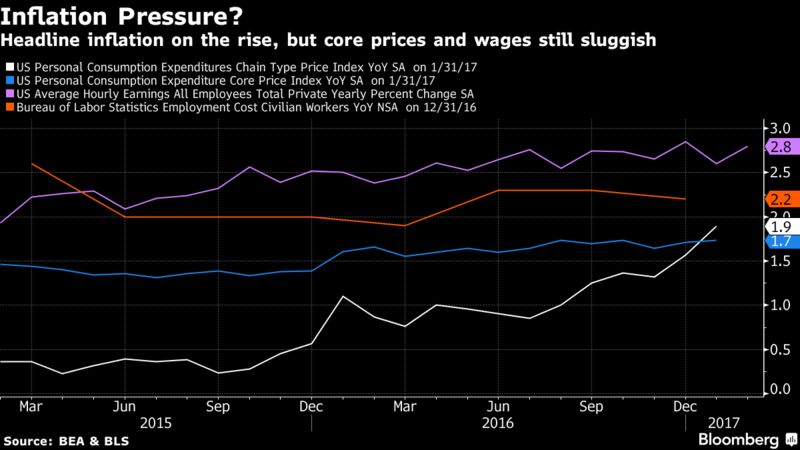
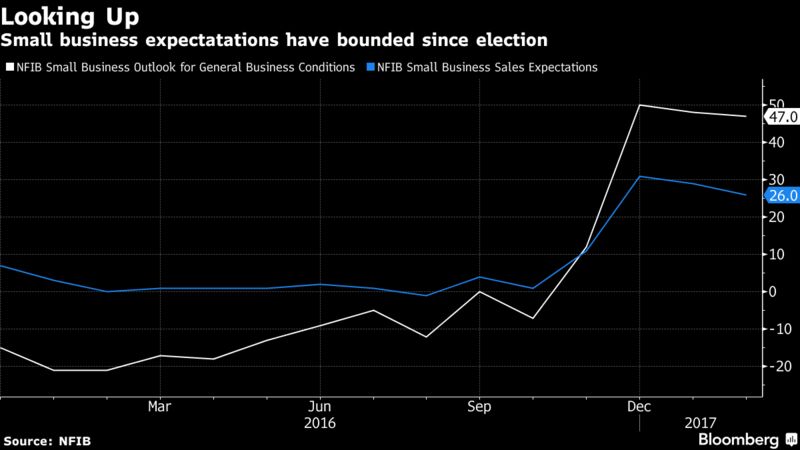
 SHARE
SHARE


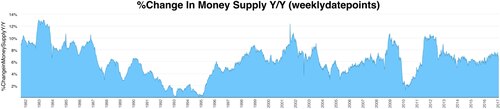
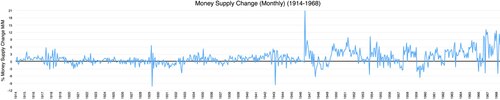


 Under a proposed deal, Russia will convert uranium into specialized fuel rods for Iran’s Bushehr nuclear power plant.Majid Asgaripour/Agence France-Presse — Getty Images
 Iran’s foreign minister, Mohammad Javad Zarif, accuses the West of trying to sabotage a reactor being built near Arak.Atta Kenare/Agence France-Presse — Getty Images
 From left, Foreign Ministers Laurent Fabius of France and William Hague of Britain, and Secretary of State John Kerry with Foreign Minister Nasser Judeh of Jordan, in Paris. Thierry Chesnot/Getty Images
 Hassan Rouhani, Iran’s new leader, received a private letter from President Obama about easing tensions between the countries.Vahid Salemi/Associated Press
 Chuck Hagel at the Pentagon. Next week he will travel to the Middle East to finalize the arms sale.Brendan Smialowski/Agence France-Presse — Getty Images
 Family members of slain nuclear scientists stood with Fereydoun Abbasi-Davani, far right, a nuclear official. Arash Khamoushi/Iranian Students News Agency, ISNA, via Associated Press
 Speaking to air force commanders in Tehran on Feb. 6, Ayatollah Khamenei said Iran “will not negotiate under pressure.” Khamenei Official Web site, via European Pressphoto Agency
 Prime Minister Benjamin Netanyahu at the United Nations, displaying his red line for Iran’s nuclear program. Chang W. Lee/The New York Times
 The Neptune, an oil tanker in the Persian Gulf, is part of a fleet of about 65 Iranian tankers serving as floating storage facilities for Iranian oil, each one given a nautical makeover to conceal its origin and make a buyer easier to find. Thomas Erdbrink
 Iran’s nuclear negotiator, Saeed Jalili, in Baghdad. Thaier Al-Sudani/Reuters
 President Mahmoud Ahmadinejad surveying the centrifuges at Iran’s underground complex at Natanz in March 2007.Office of the Iranian President
 Iran displayed the drone for propaganda purposes, with photographs of ayatollahs who led Iran’s revolution behind it and a desecrated version of the American flag. Revolutionary Guards, via Agence France-Presse — Getty Images
 Iran’s nuclear enrichment plant at Natanz.Hasan Sarbakhshian/Associated Press
 A poster of an Iranian gas field is a backdrop to passers-by in Asaluyeh. Newsha Tavakolian for The New York Times
 One of the two cars bombed in Tehran. Reuters
 The Iranian scientist Shahram Amiri, with his 7-year-old son, greeting family members in Tehran.Newsha Tavakolian/Polaris, for The New York Times
 Ambassadors to the United Nations, from right: Susan E. Rice of the United States, Mark Lyall Grant of Britain and Ruhakana Rugunda of Uganda voted to affirm a Security Council resolution on Iran while Turkey’s ambassador, Ertugrul Apakan, voted against it. Mario Tama/Getty Images
 Yukiya Amano, the head of the International Atomic Energy Agency.Herwig Prammer/Reuters
 Defense Secretary Robert M. Gates in 2011. Francois Lenoir/Reuters
 Prime Minister Gordon Brown of Britain, President Nicolas Sarkozy of France and President Obama, in Pittsburgh, accused Iran of building a secret nuclear fuel plant.Doug Mills/The New York Times
 The negotiators Saeed Jalili of Iran, left, and William J. Burns, third from right, in Geneva. Pool photo by Denis Balibouse
 President Ahmadinejad offended Israel in his speech on the rule of law at a United Nations conference in 2012. Eduardo Munoz/Reuters
 Foreign Minister Kamal Kharrazi talking to reporters in Tehran ahead of nuclear talks in Paris. Abedin Taherkenareh/European Pressphoto Agency
 An Iranian missile displayed by the Revolutionary Guards under a portrait of the supreme leader, Ayatollah Khamenei, in September 2003. Henghameh Fahimi/Agence France-Presse
 Mohammad Khatami in 2009. Hasan Sarbakhshian/Associated Press
 President Bill Clinton addressing reporters in July 1996. Joe Marquette/Associated Press
 A Russian engineer checking equipment at the Bushehr nuclear plant in April 2007.Behrouz Mehri/Agence France-Presse — Getty Images
 The body of Ayatollah Ruhollah Khomeini was displayed to hundreds of thousands of Iranians at his funeral.Agence France-Presse
 The Pakistani scientist Abdul Qadeer Khan in Islamabad in 1988.B.K.Bangash/Associated Press
 Iraqi gunners used a Soviet 130-milllimeter field gun to shell the Iranian cities of Abadan and Khurramshahr.United Press International
 Ayatollah Ruhollah Khomeini descending from the Air France plane that returned him to Tehran after 15 years in exile.United Press International
 The deposed shah, with Empress Farah and two of their children, in the Bahamas in 1979, where they dodged questions from photographers. Associated Press
 The Bushehr nuclear plant on Aug. 21, 2010, as its first fuel rod was loaded. Getty Images


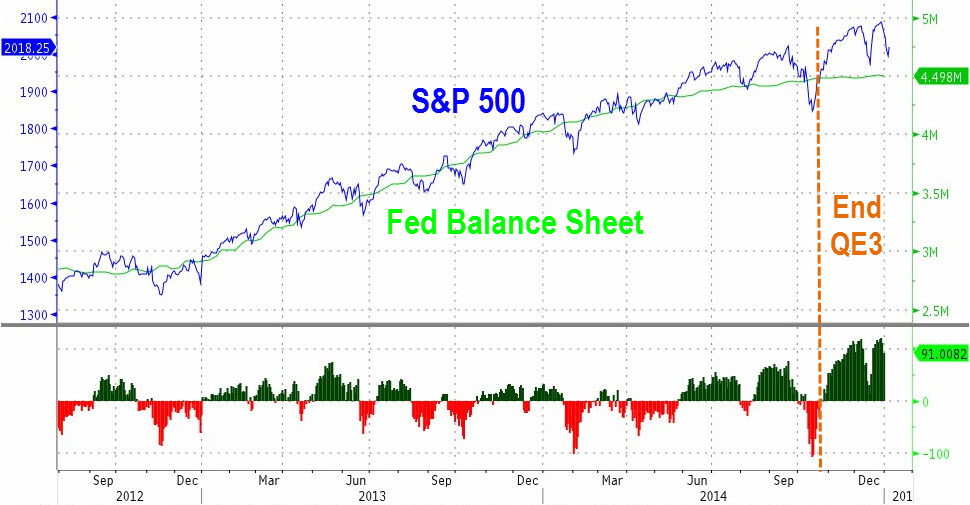


Congress Passes $1.1 Trillion Spending Package– Bipartisan Budget Busting Big Government: House 316 – 113, Senate 65 — 33 — Santa Claus Socialism By Potomac Pirates Picking People’s Pockets — Every Republican Who Voted For The Omnibus Appropriation Bill Should Be Crucified By Voters — Shutdown 10 Federal Departments and Agencies Permanently — Deport The 30-50 Million Illegal Alien Invaders In The United States — Videos
Posted on December 24, 2015. Filed under: American History, Articles, Blogroll, Business, College, Communications, Congress, Constitution, Crime, Culture, Economics, Education, Elections, Employment, Entertainment, Federal Government, Federal Government Budget, Fiscal Policy, Foreign Policy, Fraud, Freedom, government, government spending, history, Illegal, Immigration, Language, Law, Legal, liberty, Life, Links, media, Money, People, Philosophy, Photos, Political Correctness, Politics, Press, Radio, Radio, Strategy, Talk Radio, Tax Policy, Taxation, Taxes, Television, Television, Terrorism, Video, War, Wealth, Welfare, Wisdom, Work, Writing | Tags: 18 December 2015, America, American people, Appropriation bill, articles, Audio, Betrayal of American People, Bipartisan Budget Busting Big Government, Breaking News, Broadcasting, capitalism, Cartoons, Charity, Citizenship, Clarity, Classical Liberalism, Collectivism, Commentary, Commitment, Communicate, Communication, Concise, Congress Passes $1.1 Trillion Spending Package, Convincing, Courage, Culture, Current Affairs, Current Events, Death of American Dream, Democratic Party, Deport The 30-50 Million Illegal Alien Invaders In The United States, economic growth, economic policy, Economics, Education, Evil, Experience, Faith, Family, First, fiscal policy, free enterprise, freedom, freedom of speech, Friends, Give It A Listen, God, Good, Goodwill, Growth, Hope, House Speaker Paul Ryan, Independents, Individualism, Knowledge, liberty, Life, Love, Lovers of Liberty, Massive Budget Deficits, monetary policy, MPEG3, national debt, News, Opinions, Peace, Photographs, Photos, Podcasts, Political Philosophy, Politics, Polls, President Barack Obama, prosperity, Public Opinion, Radio, Raymond Thomas Pronk, RED ALERT PAUL RYAN BETRAYS AMERICA, Representative Republic, Republic, Republican Party, Republican Rebellion, Resources, Respect, Ronald Reagan .. "Government is the problem", rule of law, Rule of Men, Senate Majority Leader Mitch McConnel, Show Notes, Spending Addiction Disorder (SAD, Talk Radio, The Pronk Pops Show, The Pronk Pops Show 596, Truth, Two Party Tyranny, Tyranny, U.S. Constitution, United States of America, Videos, Virtue, War, Wisdom |
The Pronk Pops Show Podcasts
Pronk Pops Show 596: December 18, 2015
Pronk Pops Show 595: December 17, 2015
Pronk Pops Show 594: December 16, 2015
Pronk Pops Show 593: December 15, 2015
Pronk Pops Show 592: December 14, 2015
Pronk Pops Show 591: December 11, 2015
Pronk Pops Show 590: December 10, 2015
Pronk Pops Show 589: December 9, 2015
Pronk Pops Show 588: December 7, 2015
Pronk Pops Show 587: December 4, 2015
Pronk Pops Show 586: December 3, 2015
Pronk Pops Show 585: December 2, 2015
Pronk Pops Show 584: December 1, 2015
Pronk Pops Show 583: November 30, 2015
Pronk Pops Show 582: November 25, 2015
Pronk Pops Show 581: November 24, 2015
Pronk Pops Show 580: November 23, 2015
Pronk Pops Show 579: November 20, 2015
Pronk Pops Show 578: November 19, 2015
Pronk Pops Show 577: November 18, 2015
Pronk Pops Show 576: November 17, 2015
Pronk Pops Show 575: November 16, 2015 (more…)
Read Full Post | Make a Comment ( None so far )