Story 1: Remember The 20-30 Million American Citizens Searching For A Full Time Permanent Job and The Professional Soldiers Who Made The Ultimate Sacrifice — D-Day June 6, 1944 — Videos
D-Day Remembered
Operation Overlord & Neptune (D-Day documentary)
Normandy-Surviving D-Day(full )HD Documentary
D-Day in Colour (FULL)
Saving Private Ryan opening cemetery scene
Normandy Speech: Ceremony Commemorating the 40th Anniversary of the Normandy Invasion, D-Day 6/6/84
Is Jobs Data Truly Good News About U.S. Economy?
El-Erian: Jobs Report Points to a Healing Labor Market
Rep. Cole on BLS Jobs Report: “Still have underutilization of the labor force”
Rep. Cole: “We have unique fiscal challenges that transcend our predecessors”
Weekly Market Wrap Up – June 5th, 21015
Nonfarm payrolls total 280,000; unemployment rate at 5.5%
Jeff Cox | @JeffCoxCNBCcom
The U.S. economy created 280,000 jobs in May, better than expected and likely confirming hopes that growth is back on track after a slow start to the year.
The headline unemployment rate increased slightly to 5.5 percent as the labor force participation rate ticked higher to 62.9 percent. (Tweet This) A separate measure that counts those working part time for economic reasons and the unemployed who have not looked for work in the past month held steady at 10.8 percent.
Wages also showed growth, rising 8 cents an hour, equating to an annualized increase of 2.3 percent.
Economists had been expecting a gain of 225,000 positions and the unemployment rate holding steady at 5.4 percent.
“Today’s report showed the U.S. labor market has tremendous momentum. All those factors that parked a weak jobs number in March were short-term,” said Andrew Chamberlain, chief economist at job search site Glassdoor. “All those factors are looking more like a late-winter sniffle than a lingering illness.”
The jobs numbers are critical in that they will go a long way toward determining policy from the Federal Reserve. The hot jobs report sent U.S. government bond yields surging as the wage increase indicates inflation is pushing toward the Fed’s target. Stock futures also indicated a lower open for Wall Street, though the move in the equity market was far less pronounced than in bonds.
After keeping short-term interest rates near zero for 6½ years, the U.S. central bank is looking for a liftoff point that would be confirmed not only by job creation but also by wage growth, which would indicate inflation is on a positive trajectory.
“I think (the jobs number) puts September more firmly on track” for a rate hike, said Jim Caron, portfolio manager of global fixed income at Morgan Stanley Investment Management. “As of yesterday it was probably closer to a 50-50 bet. Today, I think it’s more in lines of a 75 percent probability. It moves the needle in terms of expectations and gives air cover to the Fed.”
Trader bets on the date for a rate hike pushed it forward this week, with the latest trends showing a 33 percent chance of a September hike (up from 26 percent earlier in the week), a 52 percent chance in October (from 44 percent) and a 70 percent likelihood for December (from 61 percent).
While many market participants expect a rate increase this year, the Fed got a stunning jolt Thursday from the International Monetary Fund chief Christine Lagarde, who took the unprecedented step of advising the Fed to wait until 2016 until the inflation picture is clearer.
“This number effectively flies in the face of what the IMF recommended yesterday that the Fed take a pause,” Caron said.
Service industries led the way for May, adding 63,000 positions, while leisure and hospitality grew by 57,000. Health care increased by 47,000, retail added 31,000 and construction moved higher by 17,000. Mining was a dark spot on the report, contracting by 17,000, bringing the decline to 68,000 in 2015.
The average work week was unchanged at 34.5 hours.
The number of full-time workers grew by 630,000, while the part-time rolls fell by 232,000.
Previous months showed minor changes, with March’s disappointing count getting pushed higher to 119,000 from 85,000 and April edging lower from 223,000 to 221,000.
“Overall, at this stage this evident strength in the labor market probably isn’t enough to persuade the Fed to hike rates by July, but it definitely makes a rate cut by September probable,” said Paul Ashworth, chief U.S. economist at Capital Economics. “Only 24 hours later, the IMF’s suggestion that the Fed should wait until 2016 looks very dated.”
Transmission of material in this release is embargoed until			USDL-15-1057
8:30 a.m. (EDT) Friday, June 5, 2015

Technical information:
 Household data:	(202) 691-6378  •  cpsinfo@bls.gov  •  www.bls.gov/cps
 Establishment data:	(202) 691-6555  •  cesinfo@bls.gov  •  www.bls.gov/ces

Media contact:	        (202) 691-5902  •  PressOffice@bls.gov


			THE EMPLOYMENT SITUATION -- MAY 2015


Total nonfarm payroll employment increased by 280,000 in May, and the
unemployment rate was essentially unchanged at 5.5 percent, the U.S.
Bureau of Labor Statistics reported today. Job gains occurred in
professional and business services, leisure and hospitality, and health
care. Mining employment continued to decline.

Household Survey Data

In May, both the unemployment rate (5.5 percent) and the number of
unemployed persons (8.7 million) were essentially unchanged. Both
measures have shown little movement since February. (See table A-1.)

Among the major worker groups, the unemployment rates for adult men
(5.0 percent), adult women (5.0 percent), teenagers (17.9 percent),
whites (4.7 percent), blacks (10.2 percent), Asians (4.1 percent),
and Hispanics (6.7 percent) showed little or no change in May. (See
tables A-1, A-2, and A-3.)

The number of unemployed new entrants edged up by 103,000 in May but
is about unchanged over the year. Unemployed new entrants are those
who never previously worked. (See table A-11.)

The number of persons unemployed for less than 5 weeks decreased by
311,000 to 2.4 million in May, following an increase in April. The
number of long-term unemployed (those jobless for 27 weeks or more)
held at 2.5 million in May and accounted for 28.6 percent of the
unemployed. Over the past 12 months, the number of long-term
unemployed is down by 849,000. (See table A-12.)

In May, the civilian labor force rose by 397,000, and the labor force
participation rate was little changed at 62.9 percent. Since April
2014, the participation rate has remained within a narrow range of
62.7 percent to 62.9 percent. The employment-population ratio, at
59.4 percent, was essentially unchanged in May. (See table A-1.)

The number of persons employed part time for economic reasons (sometimes
referred to as involuntary part-time workers) was about unchanged at
6.7 million in May and has shown little movement in recent months.
These individuals, who would have preferred full-time employment, were
working part time because their hours had been cut back or because
they were unable to find a full-time job. (See table A-8.)

In May, 1.9 million persons were marginally attached to the labor force,
down by 268,000 from a year earlier. (The data are not seasonally
adjusted.) These individuals were not in the labor force, wanted and
were available for work, and had looked for a job sometime in the
prior 12 months. They were not counted as unemployed because they
had not searched for work in the 4 weeks preceding the survey. (See
table A-16.)

Among the marginally attached, there were 563,000 discouraged workers
in May, down by 134,000 from a year earlier. (The data are not seasonally
adjusted.) Discouraged workers are persons not currently looking for work
because they believe no jobs are available for them. The remaining 1.3
million persons marginally attached to the labor force in May had not
searched for work for reasons such as school attendance or family
responsibilities. (See table A-16.)

Establishment Survey Data

Total nonfarm payroll employment rose by 280,000 in May, compared with
an average monthly gain of 251,000 over the prior 12 months. In May,
job gains occurred in professional and business services, leisure
and hospitality, and health care. Employment in mining continued to
decline. (See table B-1.)

Professional and business services added 63,000 jobs in May and
671,000 jobs over the year. In May, employment increased in computer
systems design and related services (+10,000). Employment continued
to trend up in temporary help services (+20,000), in management and
technical consulting services (+7,000), and in architectural and
engineering services (+5,000).

Employment in leisure and hospitality increased by 57,000 in May,
following little change in the prior 2 months. In May, employment
edged up in arts, entertainment, and recreation (+29,000). Employment
in food services and drinking places has shown little net change over
the past 3 months.

Health care added 47,000 jobs in May. Within the industry, employment
in ambulatory care services (which includes home health care services
and outpatient care centers) rose by 28,000. Hospitals added 16,000
jobs over the month. Over the past year, health care has added 408,000
jobs.

Employment in retail trade edged up in May (+31,000). Over the prior
12 months, the industry had added an average of 24,000 jobs per month.
Within retail trade, automobile dealers added 8,000 jobs in May.

Construction employment continued to trend up over the month (+17,000)
and has increased by 273,000 over the past year.

In May, employment continued on an upward trend in transportation and
warehousing (+13,000). Truck transportation added 9,000 jobs over the
month.

In May, employment continued to trend up in financial activities (+13,000).
Over the past 12 months, the industry has added 160,000 jobs, with
about half of the gain in insurance carriers and related activities.

Employment in mining fell for the fifth month in a row, with a decline
of 17,000 in May. The loss was in support activities for mining.
Employment in mining has decreased by 68,000 thus far this year, after
increasing by 41,000 in 2014.

Employment in other major industries, including manufacturing, wholesale
trade, information, and government, showed little change over the month.

The average workweek for all employees on private nonfarm payrolls
remained at 34.5 hours in May. The manufacturing workweek was unchanged
at 40.7 hours, and factory overtime remained at 3.3 hours. The average
workweek for production and nonsupervisory employees on private nonfarm
payrolls edged up by 0.1 hour to 33.7 hours. (See tables B-2 and B-7.)

In May, average hourly earnings for all employees on private nonfarm
payrolls rose by 8 cents to $24.96. Over the year, average hourly
earnings have risen by 2.3 percent. Average hourly earnings of private-
sector production and nonsupervisory employees rose by 6 cents to $20.97
in May. (See tables B-3 and B-8.)

The change in total nonfarm payroll employment for March was revised
from +85,000 to +119,000, and the change for April was revised from
+223,000 to +221,000. With these revisions, employment gains in March
and April combined were 32,000 more than previously reported. Over the
past 3 months, job gains have averaged 207,000 per month.

_____________
The Employment Situation for June is scheduled to be released on
Thursday, July 2, 2015, at 8:30 a.m. (EDT).
Employment Situation Summary Table A. Household data, seasonally adjusted
HOUSEHOLD DATA
Summary table A. Household data, seasonally adjusted
[Numbers in thousands]
Category
May
2014
Mar.
2015
Apr.
2015
May
2015
Change from:
Apr.
2015-
May
2015
Employment status
Civilian noninstitutional population
247,622
250,080
250,266
250,455
189
Civilian labor force
155,629
156,906
157,072
157,469
397
Participation rate
62.8
62.7
62.8
62.9
0.1
Employed
145,868
148,331
148,523
148,795
272
Employment-population ratio
58.9
59.3
59.3
59.4
0.1
Unemployed
9,761
8,575
8,549
8,674
125
Unemployment rate
6.3
5.5
5.4
5.5
0.1
Not in labor force
91,993
93,175
93,194
92,986
-208
Unemployment rates
Total, 16 years and over
6.3
5.5
5.4
5.5
0.1
Adult men (20 years and over)
5.9
5.1
5.0
5.0
0.0
Adult women (20 years and over)
5.7
4.9
4.9
5.0
0.1
Teenagers (16 to 19 years)
19.2
17.5
17.1
17.9
0.8
White
5.4
4.7
4.7
4.7
0.0
Black or African American
11.4
10.1
9.6
10.2
0.6
Asian
5.6
3.2
4.4
4.1
-0.3
Hispanic or Latino ethnicity
7.7
6.8
6.9
6.7
-0.2
Total, 25 years and over
5.2
4.4
4.5
4.5
0.0
Less than a high school diploma
9.2
8.6
8.6
8.6
0.0
High school graduates, no college
6.5
5.3
5.4
5.8
0.4
Some college or associate degree
5.5
4.8
4.7
4.4
-0.3
Bachelor’s degree and higher
3.2
2.5
2.7
2.7
0.0
Reason for unemployment
Job losers and persons who completed temporary jobs
4,959
4,189
4,136
4,267
131
Job leavers
872
875
828
829
1
Reentrants
2,869
2,689
2,685
2,615
-70
New entrants
1,063
815
868
971
103
Duration of unemployment
Less than 5 weeks
2,553
2,488
2,729
2,418
-311
5 to 14 weeks
2,401
2,312
2,307
2,532
225
15 to 26 weeks
1,451
1,253
1,139
1,293
154
27 weeks and over
3,351
2,563
2,525
2,502
-23
Employed persons at work part time
Part time for economic reasons
7,268
6,705
6,580
6,652
72
Slack work or business conditions
4,404
4,069
3,885
3,891
6
Could only find part-time work
2,558
2,337
2,374
2,390
16
Part time for noneconomic reasons
19,149
19,733
20,056
19,961
-95
Persons not in the labor force (not seasonally adjusted)
Marginally attached to the labor force
2,130
2,055
2,115
1,862
–
Discouraged workers
697
738
756
563
–
– Over-the-month changes are not displayed for not seasonally adjusted data.
NOTE: Persons whose ethnicity is identified as Hispanic or Latino may be of any race. Detail for the seasonally adjusted data shown in this table will not necessarily add to totals because of the independent seasonal adjustment of the various series. Updated population controls are introduced annually with the release of January data.
Employment Situation Summary Table B. Establishment data, seasonally adjusted
ESTABLISHMENT DATA
Summary table B. Establishment data, seasonally adjusted
Footnotes (1) Includes other industries, not shown separately. (2) Data relate to production employees in mining and logging and manufacturing, construction employees in construction, and nonsupervisory employees in the service-providing industries. (3) The indexes of aggregate weekly hours are calculated by dividing the current month’s estimates of aggregate hours by the corresponding annual average aggregate hours. (4) The indexes of aggregate weekly payrolls are calculated by dividing the current month’s estimates of aggregate weekly payrolls by the corresponding annual average aggregate weekly payrolls. (5) Figures are the percent of industries with employment increasing plus one-half of the industries with unchanged employment, where 50 percent indicates an equal balance between industries with increasing and decreasing employment. (p) Preliminary
NOTE: Data have been revised to reflect March 2014 benchmark levels and updated seasonal adjustment factors.
Story 1: Department of Labor Revised Job Numbers in November of 414,000 and December of 329,000 Plus 257,000 in January — Wages Increase 12 Cents Per Hour — Solid Jobs Report — U-3 Unemployment Rate Increased From 5.6% to 5.7% and 9 Million Unemployed — 1 Million Additional Americans Looking For Jobs — Spread The Message of Liberty — Videos
Gallup CEO: Labor Department Numbers Are Misleading
Are monthly jobs numbers misleading
Gallup CEO Jim Clifton The “Real” Unemployment Rate In America @ 11.2% Double What Obama Says
Gallup discovers Obama may not be truthful on unemployment (Limbaugh)
Latest Jobs Report Sparking Questions About The Quality Of Jobs Being Created – Cavuto
Ep 51: Despite Slowing Economy, Job Growth Speeds Up
Investor Jim Rogers Gives Warning to Investor
US Job Market Improves
US jobs market booms as recovery accelerates
Nightly Business Report — February 6, 2015
February 6, 2015 Financial News – Business News – Stock Exchange – NYSE – Market News
The H1-B visa scam
Bill Gates Asks Senate For Infinite Number Of H 1B Visas
Peter Schiff Inflation Deterring Economic Growth
Taylor at CFR: Rethinking the Fed’s Dual Mandate
Uncommon Knowledge with John B. Taylor
A Discussion of the Fed’s Dual Mandate Responsibilities
The Federal Reserve’s Stanley Fischer on Inflation and Financial Stability
Sessions Calls On All Colleagues To Block President’s Planned Amnesty & Work Permits
Please Spread The Message of Liberty
“Proclaim liberty throughout the land to all its inhabitants.”
Years of unending news stories on U.S. government programs ofsurveillance,rendition and torture have apparently chilled the speech of even top business executives in the United States.
Yesterday, Jim Clifton, the Chairman and CEO of Gallup, an iconic U.S. company dating back to 1935, told CNBC that he was worried he might “suddenly disappear” and not make it home that evening if he disputed the accuracy of what the U.S. government is reporting as unemployed Americans.
The CNBC interview came one day after Clifton had penned a gutsy opinion piece on Gallup’s web site, defiantly calling the government’s 5.6 percent unemployment figure “The Big Lie” in the article’s headline. His appearance on CNBC was apparently to walk back the “lie” part of the title and reframe the jobs data as just hopelessly deceptive.
Clifton stated the following on CNBC:
“I think that the number that comes out of BLS [Bureau of Labor Statistics] and the Department of Labor is very, very accurate. I need to make that very, very clear so that I don’t suddenly disappear. I need to make it home tonight.”
After getting that out of the way, Clifton went on to eviscerate the legitimacy of the cheerful spin given to the unemployment data, telling CNBC viewers that the percent of full time jobs in this country as a percent of the adult population “is the worst it’s been in 30 years.”
Series Id:           LNS11000000
Seasonally Adjusted
Series title:        (Seas) Civilian Labor Force Level
Labor force status:  Civilian labor force
Type of data:        Number in thousands
Age:                 16 years and over
Year
Jan
Feb
Mar
Apr
May
Jun
Jul
Aug
Sep
Oct
Nov
Dec
Annual
2000
142267(1)
142456
142434
142751
142388
142591
142278
142514
142518
142622
142962
143248
2001
143800
143701
143924
143569
143318
143357
143654
143284
143989
144086
144240
144305
2002
143883
144653
144481
144725
144938
144808
144803
145009
145552
145314
145041
145066
2003
145937(1)
146100
146022
146474
146500
147056
146485
146445
146530
146716
147000
146729
2004
146842(1)
146709
146944
146850
147065
147460
147692
147564
147415
147793
148162
148059
2005
148029(1)
148364
148391
148926
149261
149238
149432
149779
149954
150001
150065
150030
2006
150214(1)
150641
150813
150881
151069
151354
151377
151716
151662
152041
152406
152732
2007
153144(1)
152983
153051
152435
152670
153041
153054
152749
153414
153183
153835
153918
2008
154063(1)
153653
153908
153769
154303
154313
154469
154641
154570
154876
154639
154655
2009
154210(1)
154538
154133
154509
154747
154716
154502
154307
153827
153784
153878
153111
2010
153484(1)
153694
153954
154622
154091
153616
153691
154086
153975
153635
154125
153650
2011
153314(1)
153227
153377
153566
153492
153350
153276
153746
154085
153935
154089
153961
2012
154445(1)
154739
154765
154589
154899
155088
154927
154726
155060
155491
155305
155553
2013
155825(1)
155396
155026
155401
155562
155761
155632
155529
155548
154615
155304
155047
2014
155486(1)
155688
156180
155420
155629
155700
156048
156018
155845
156243
156402
156129
2015
157180(1)
Civilian Labor Participation Rate
62.9%
Series Id:           LNS11300000
Seasonally Adjusted
Series title:        (Seas) Labor Force Participation Rate
Labor force status:  Civilian labor force participation rate
Type of data:        Percent or rate
Age:                 16 years and over
Year
Jan
Feb
Mar
Apr
May
Jun
Jul
Aug
Sep
Oct
Nov
Dec
Annual
2000
67.3
67.3
67.3
67.3
67.1
67.1
66.9
66.9
66.9
66.8
66.9
67.0
2001
67.2
67.1
67.2
66.9
66.7
66.7
66.8
66.5
66.8
66.7
66.7
66.7
2002
66.5
66.8
66.6
66.7
66.7
66.6
66.5
66.6
66.7
66.6
66.4
66.3
2003
66.4
66.4
66.3
66.4
66.4
66.5
66.2
66.1
66.1
66.1
66.1
65.9
2004
66.1
66.0
66.0
65.9
66.0
66.1
66.1
66.0
65.8
65.9
66.0
65.9
2005
65.8
65.9
65.9
66.1
66.1
66.1
66.1
66.2
66.1
66.1
66.0
66.0
2006
66.0
66.1
66.2
66.1
66.1
66.2
66.1
66.2
66.1
66.2
66.3
66.4
2007
66.4
66.3
66.2
65.9
66.0
66.0
66.0
65.8
66.0
65.8
66.0
66.0
2008
66.2
66.0
66.1
65.9
66.1
66.1
66.1
66.1
66.0
66.0
65.9
65.8
2009
65.7
65.8
65.6
65.7
65.7
65.7
65.5
65.4
65.1
65.0
65.0
64.6
2010
64.8
64.9
64.9
65.2
64.9
64.6
64.6
64.7
64.6
64.4
64.6
64.3
2011
64.2
64.2
64.2
64.2
64.1
64.0
64.0
64.1
64.2
64.1
64.1
64.0
2012
63.7
63.8
63.8
63.7
63.8
63.8
63.7
63.5
63.6
63.7
63.6
63.7
2013
63.7
63.5
63.3
63.4
63.4
63.4
63.3
63.2
63.2
62.8
63.0
62.8
2014
63.0
63.0
63.2
62.8
62.8
62.8
62.9
62.9
62.7
62.8
62.9
62.7
2015
62.9
Employment Level
148,201,000
Series Id:           LNS12000000
Seasonally Adjusted
Series title:        (Seas) Employment Level
Labor force status:  Employed
Type of data:        Number in thousands
Age:                 16 years and over
Year
Jan
Feb
Mar
Apr
May
Jun
Jul
Aug
Sep
Oct
Nov
Dec
Annual
2000
136559(1)
136598
136701
137270
136630
136940
136531
136662
136893
137088
137322
137614
2001
137778
137612
137783
137299
137092
136873
137071
136241
136846
136392
136238
136047
2002
135701
136438
136177
136126
136539
136415
136413
136705
137302
137008
136521
136426
2003
137417(1)
137482
137434
137633
137544
137790
137474
137549
137609
137984
138424
138411
2004
138472(1)
138542
138453
138680
138852
139174
139556
139573
139487
139732
140231
140125
2005
140245(1)
140385
140654
141254
141609
141714
142026
142434
142401
142548
142499
142752
2006
143150(1)
143457
143741
143761
144089
144353
144202
144625
144815
145314
145534
145970
2007
146028(1)
146057
146320
145586
145903
146063
145905
145682
146244
145946
146595
146273
2008
146378(1)
146156
146086
146132
145908
145737
145532
145203
145076
144802
144100
143369
2009
142152(1)
141640
140707
140656
140248
140009
139901
139492
138818
138432
138659
138013
2010
138438(1)
138581
138751
139297
139241
139141
139179
139438
139396
139119
139044
139301
2011
139267(1)
139400
139649
139610
139639
139392
139520
139940
140156
140336
140780
140890
2012
141633(1)
141911
142069
141953
142231
142400
142270
142277
142953
143350
143279
143280
2013
143328(1)
143429
143374
143665
143890
144025
144275
144288
144297
143453
144490
144671
2014
145206(1)
145301
145796
145724
145868
146247
146401
146451
146607
147260
147331
147442
2015
148201(1)
1 : Data affected by changes in population controls.
Employment Population Ratio
59.3 %
Series Id:           LNS12300000
Seasonally Adjusted
Series title:        (Seas) Employment-Population Ratio
Labor force status:  Employment-population ratio
Type of data:        Percent or rate
Age:                 16 years and over
Year
Jan
Feb
Mar
Apr
May
Jun
Jul
Aug
Sep
Oct
Nov
Dec
Annual
2000
64.6
64.6
64.6
64.7
64.4
64.5
64.2
64.2
64.2
64.2
64.3
64.4
2001
64.4
64.3
64.3
64.0
63.8
63.7
63.7
63.2
63.5
63.2
63.0
62.9
2002
62.7
63.0
62.8
62.7
62.9
62.7
62.7
62.7
63.0
62.7
62.5
62.4
2003
62.5
62.5
62.4
62.4
62.3
62.3
62.1
62.1
62.0
62.1
62.3
62.2
2004
62.3
62.3
62.2
62.3
62.3
62.4
62.5
62.4
62.3
62.3
62.5
62.4
2005
62.4
62.4
62.4
62.7
62.8
62.7
62.8
62.9
62.8
62.8
62.7
62.8
2006
62.9
63.0
63.1
63.0
63.1
63.1
63.0
63.1
63.1
63.3
63.3
63.4
2007
63.3
63.3
63.3
63.0
63.0
63.0
62.9
62.7
62.9
62.7
62.9
62.7
2008
62.9
62.8
62.7
62.7
62.5
62.4
62.2
62.0
61.9
61.7
61.4
61.0
2009
60.6
60.3
59.9
59.8
59.6
59.4
59.3
59.1
58.7
58.5
58.6
58.3
2010
58.5
58.5
58.5
58.7
58.6
58.5
58.5
58.6
58.5
58.3
58.2
58.3
2011
58.3
58.4
58.4
58.4
58.4
58.2
58.2
58.3
58.4
58.4
58.6
58.6
2012
58.5
58.5
58.6
58.5
58.5
58.6
58.5
58.4
58.6
58.8
58.7
58.6
2013
58.6
58.6
58.5
58.6
58.6
58.7
58.7
58.7
58.6
58.2
58.6
58.6
2014
58.8
58.8
59.0
58.9
58.9
59.0
59.0
59.0
59.0
59.2
59.2
59.2
2015
59.3
Unemployment Level
8,979,000
Series Id:           LNS13000000
Seasonally Adjusted
Series title:        (Seas) Unemployment Level
Labor force status:  Unemployed
Type of data:        Number in thousands
Age:                 16 years and over
Year
Jan
Feb
Mar
Apr
May
Jun
Jul
Aug
Sep
Oct
Nov
Dec
Annual
2000
5708
5858
5733
5481
5758
5651
5747
5853
5625
5534
5639
5634
2001
6023
6089
6141
6271
6226
6484
6583
7042
7142
7694
8003
8258
2002
8182
8215
8304
8599
8399
8393
8390
8304
8251
8307
8520
8640
2003
8520
8618
8588
8842
8957
9266
9011
8896
8921
8732
8576
8317
2004
8370
8167
8491
8170
8212
8286
8136
7990
7927
8061
7932
7934
2005
7784
7980
7737
7672
7651
7524
7406
7345
7553
7453
7566
7279
2006
7064
7184
7072
7120
6980
7001
7175
7091
6847
6727
6872
6762
2007
7116
6927
6731
6850
6766
6979
7149
7067
7170
7237
7240
7645
2008
7685
7497
7822
7637
8395
8575
8937
9438
9494
10074
10538
11286
2009
12058
12898
13426
13853
14499
14707
14601
14814
15009
15352
15219
15098
2010
15046
15113
15202
15325
14849
14474
14512
14648
14579
14516
15081
14348
2011
14046
13828
13728
13956
13853
13958
13756
13806
13929
13599
13309
13071
2012
12812
12828
12696
12636
12668
12688
12657
12449
12106
12141
12026
12272
2013
12497
11967
11653
11735
11671
11736
11357
11241
11251
11161
10814
10376
2014
10280
10387
10384
9696
9761
9453
9648
9568
9237
8983
9071
8688
2015
8979
Unemployment Rate
5.7%
Year
Jan
Feb
Mar
Apr
May
Jun
Jul
Aug
Sep
Oct
Nov
Dec
Annual
2000
4.0
4.1
4.0
3.8
4.0
4.0
4.0
4.1
3.9
3.9
3.9
3.9
2001
4.2
4.2
4.3
4.4
4.3
4.5
4.6
4.9
5.0
5.3
5.5
5.7
2002
5.7
5.7
5.7
5.9
5.8
5.8
5.8
5.7
5.7
5.7
5.9
6.0
2003
5.8
5.9
5.9
6.0
6.1
6.3
6.2
6.1
6.1
6.0
5.8
5.7
2004
5.7
5.6
5.8
5.6
5.6
5.6
5.5
5.4
5.4
5.5
5.4
5.4
2005
5.3
5.4
5.2
5.2
5.1
5.0
5.0
4.9
5.0
5.0
5.0
4.9
2006
4.7
4.8
4.7
4.7
4.6
4.6
4.7
4.7
4.5
4.4
4.5
4.4
2007
4.6
4.5
4.4
4.5
4.4
4.6
4.7
4.6
4.7
4.7
4.7
5.0
2008
5.0
4.9
5.1
5.0
5.4
5.6
5.8
6.1
6.1
6.5
6.8
7.3
2009
7.8
8.3
8.7
9.0
9.4
9.5
9.5
9.6
9.8
10.0
9.9
9.9
2010
9.8
9.8
9.9
9.9
9.6
9.4
9.4
9.5
9.5
9.4
9.8
9.3
2011
9.2
9.0
9.0
9.1
9.0
9.1
9.0
9.0
9.0
8.8
8.6
8.5
2012
8.3
8.3
8.2
8.2
8.2
8.2
8.2
8.0
7.8
7.8
7.7
7.9
2013
8.0
7.7
7.5
7.6
7.5
7.5
7.3
7.2
7.2
7.2
7.0
6.7
2014
6.6
6.7
6.6
6.2
6.3
6.1
6.2
6.1
5.9
5.7
5.8
5.6
2015
5.7
Teenage 16-19 Years Unemployment Rate
18.8%
Series Id:           LNS14000012
Seasonally Adjusted
Series title:        (Seas) Unemployment Rate - 16-19 yrs.
Labor force status:  Unemployment rate
Type of data:        Percent or rate
Age:                 16 to 19 years
Year
Jan
Feb
Mar
Apr
May
Jun
Jul
Aug
Sep
Oct
Nov
Dec
Annual
2000
12.7
13.8
13.3
12.6
12.8
12.3
13.4
14.0
13.0
12.8
13.0
13.2
2001
13.8
13.7
13.8
13.9
13.4
14.2
14.4
15.6
15.2
16.0
15.9
17.0
2002
16.5
16.0
16.6
16.7
16.6
16.7
16.8
17.0
16.3
15.1
17.1
16.9
2003
17.2
17.2
17.8
17.7
17.9
19.0
18.2
16.6
17.6
17.2
15.7
16.2
2004
17.0
16.5
16.8
16.6
17.1
17.0
17.8
16.7
16.6
17.4
16.4
17.6
2005
16.2
17.5
17.1
17.8
17.8
16.3
16.1
16.1
15.5
16.1
17.0
14.9
2006
15.1
15.3
16.1
14.6
14.0
15.8
15.9
16.0
16.3
15.2
14.8
14.6
2007
14.8
14.9
14.9
15.9
15.9
16.3
15.3
15.9
15.9
15.4
16.2
16.8
2008
17.8
16.6
16.1
15.9
19.0
19.2
20.7
18.6
19.1
20.0
20.3
20.5
2009
20.7
22.3
22.2
22.2
23.4
24.7
24.3
25.0
25.9
27.2
26.9
26.7
2010
26.1
25.6
26.2
25.4
26.5
25.9
25.9
25.5
25.8
27.2
24.8
25.3
2011
25.7
24.1
24.4
24.6
23.9
24.6
24.7
25.0
24.4
24.2
24.2
23.3
2012
23.7
23.8
25.0
24.8
24.3
23.4
23.6
24.3
23.7
23.9
24.0
24.1
2013
23.9
25.2
24.1
24.1
24.2
23.3
23.2
22.5
21.1
22.2
20.9
20.4
2014
20.8
21.3
20.9
19.1
19.2
20.7
20.0
19.4
19.8
18.7
17.5
16.8
2015
18.8
U-6 Unemployment Rate
11.3%
Series Id:           LNS13327709
Seasonally Adjusted
Series title:        (seas) Total unemployed, plus all marginally attached workers plus total employed part time for economic reasons, as a percent of all civilian labor force plus all marginally attached workers
Labor force status:  Aggregated totals unemployed
Type of data:        Percent or rate
Age:                 16 years and over
Percent/rates:       Unemployed and mrg attached and pt for econ reas as percent of labor force plus marg attached
Employment Situation Summary
Transmission of material in this release is embargoed until USDL-15-0158
8:30 a.m. (EST) Friday, February 6, 2015
Technical information:
Household data: (202) 691-6378 • cpsinfo@bls.gov • www.bls.gov/cps
Establishment data: (202) 691-6555 • cesinfo@bls.gov • www.bls.gov/ces
Media contact: (202) 691-5902 • PressOffice@bls.gov
THE EMPLOYMENT SITUATION -- JANUARY 2015
NOTE: This news release was reissued on February 6, 2015, to correct data
in table C for the employed (Dec.-Jan. change, after removing the population
control effect). No other data were affected.
Total nonfarm payroll employment rose by 257,000 in January, and the unemployment rate
was little changed at 5.7 percent, the U.S. Bureau of Labor Statistics reported today.
Job gains occurred in retail trade, construction, health care, financial activities,
and manufacturing.
____________________________________________________________________________
| |
| Changes to The Employment Situation Data |
| |
|Establishment survey data have been revised as a result of the annual |
|benchmarking process and the updating of seasonal adjustment factors. Also, |
|household survey data for January 2015 reflect updated population estimates.|
|See the notes at the end of this news release for more information about |
|these changes. |
|____________________________________________________________________________|
Household Survey Data
The unemployment rate, at 5.7 percent, changed little in January and has shown no net
change since October. The number of unemployed persons, at 9.0 million, was little
changed in January. (See table A-1. See the note at the end of this news release and
tables B and C for information about annual population adjustments to the household
survey estimates.)
Among the major worker groups, the unemployment rate for teenagers (18.8 percent)
increased in January. The jobless rates for adult men (5.3 percent), adult women
(5.1 percent), whites (4.9 percent), blacks (10.3 percent), Asians (4.0 percent),
and Hispanics (6.7 percent) showed little or no change. (See tables A-1, A-2,
and A-3.)
In January, the number of long-term unemployed (those jobless for 27 weeks or more)
was essentially unchanged at 2.8 million. These individuals accounted for 31.5 percent
of the unemployed. Over the past 12 months, the number of long-term unemployed is down
by 828,000. (See table A-12.)
After accounting for the annual adjustments to the population controls, the civilian
labor force rose by 703,000 in January. The labor force participation rate rose by
0.2 percentage point to 62.9 percent, following a decline of equal magnitude in the
prior month. Total employment, as measured by the household survey, increased by
435,000 in January, and the employment-population ratio was little changed at
59.3 percent. (See table A-1. For additional information about the effects of the
population adjustments, see table C.)
The number of persons employed part time for economic reasons(sometimes referred to
as involuntary part-time workers) was essentially unchanged in January at 6.8 million.
These individuals, who would have preferred full-time employment, were working part
time because their hours had been cut back or because they were unable to find a
full-time job. (See table A-8.)
In January, 2.2 million persons were marginally attached to the labor force, down by
358,000 from a year earlier. (The data are not seasonally adjusted.) These individuals
were not in the labor force, wanted and were available for work, and had looked for a
job sometime in the prior 12 months. They were not counted as unemployed because they
had not searched for work in the 4 weeks preceding the survey. (See table A-16.)
Among the marginally attached, there were 682,000 discouraged workers in January, down
by 155,000 from a year earlier. (The data are not seasonally adjusted.) Discouraged
workers are persons not currently looking for work because they believe no jobs are
available for them. The remaining 1.6 million persons marginally attached to the labor
force in January had not searched for work for reasons such as school attendance or
family responsibilities. (See table A-16.)
Establishment Survey Data
Total nonfarm payroll employment rose by 257,000 in January. Job gains occurred in
retail trade, construction, health care, financial activities, and manufacturing.
After incorporating revisions for November and December (which include the impact of
the annual benchmark process), monthly job gains averaged 336,000 over the past
3 months. (See table B-1 and summary table B. See the note at the end of this news
release and table A for information about the annual benchmark process.)
Employment in retail trade rose by 46,000 in January. Three industries accounted
for half of the jobs added--sporting goods, hobby, book, and music stores (+9,000);
motor vehicle and parts dealers (+8,000); and nonstore retailers (+6,000).
Construction continued to add jobs in January (+39,000). Employment increased in
both residential and nonresidential building (+13,000 and +7,000, respectively).
Employment continued to trend up in specialty trade contactors (+13,000). Over the
prior 12 months, construction had added an average of 28,000 jobs per month.
In January, health care employment increased by 38,000. Job gains occurred in
offices of physicians (+13,000), hospitals (+10,000), and nursing and residential
care facilities (+7,000). Health care added an average of 26,000 jobs per month
in 2014.
Employment in financial activities rose by 26,000 in January, with insurance
carriers and related activities (+14,000) and securities, commodity contracts,
and investments (+5,000) contributing to the gain. Financial activities has added
159,000 jobs over the past 12 months.
Manufacturing employment increased by 22,000 over the month, including job gains
in motor vehicles and parts (+7,000) and wood products (+4,000). Over the past
12 months, manufacturing has added 228,000 jobs.
Professional and technical services added 33,000 jobs in January, including
increases in computer systems design (+8,000) and architectural and engineering
services (+8,000).
In January, employment in food services and drinking places continued to trend
up (+35,000). In 2014, the industry added an average of 33,000 jobs per month.
Employment in other major industries, including mining and logging, wholesale
trade, transportation and warehousing, information, and government, showed little
change over the month.
The average workweek for all employees on private nonfarm payrolls was unchanged
at 34.6 hours in January. The manufacturing workweek edged up by 0.1 hour to 41.0
hours, and factory overtime edged down by 0.1 hour to 3.5 hours. The average
workweek for production and nonsupervisory employees on private nonfarm payrolls
edged down by 0.1 hour to 33.8 hours. (See tables B-2 and B-7.)
In January, average hourly earnings for all employees on private nonfarm payrolls
increased by 12 cents to $24.75, following a decrease of 5 cents in December. Over
the year, average hourly earnings have risen by 2.2 percent. In January, average
hourly earnings of private-sector production and nonsupervisory employees increased
by 7 cents to $20.80. (See tables B-3 and B-8.)
The change in total nonfarm payroll employment for November was revised from +353,000
to +423,000, and the change for December was revised from +252,000 to +329,000. With
these revisions, employment gains in November and December were 147,000 higher than
previously reported. Monthly revisions result from additional reports received from
businesses since the last published estimates and the monthly recalculation of
seasonal factors. The annual benchmark process also contributed to these revisions.
_____________
The Employment Situation for February is scheduled to be released on Friday,
March 6, 2015, at 8:30 a.m. (EST).
Revisions to Establishment Survey Data
In accordance with annual practice, the establishment survey data released today have
been benchmarked to reflect comprehensive counts of payroll jobs for March 2014. These
counts are derived principally from the Quarterly Census of Employment and Wages (QCEW),
which enumerates jobs covered by the unemployment insurance tax system. The benchmark
process results in revisions to not seasonally adjusted data from April 2013 forward.
Seasonally adjusted data from January 2010 forward are subject to revision. In addition,
data for some series prior to 2010, both seasonally adjusted and unadjusted, incorporate
revisions.
The total nonfarm employment level for March 2014 was revised upward by 91,000 (+67,000
on a not seasonally adjusted basis, or less than 0.05 percent). The average benchmark
revision over the past 10 years was plus or minus 0.3 percent. Table A presents revised
total nonfarm employment data on a seasonally adjusted basis for January through
December 2014.
An article that discusses the benchmark and post-benchmark revisions and other technical
issues can be accessed through the BLS website at www.bls.gov/web/empsit/cesbmart.pdf.
Information on the data released today also may be obtained by calling (202) 691-6555.
Table A. Revisions in total nonfarm employment, January-December 2014, seasonally adjusted
(Numbers in thousands)
__________________________________________________________________________________________
| |
| Level | Over-the-month change
|____________________________________|________________________________
Year and month | As | | | As | |
|previously | As | Difference |previously| As | Difference
|published | revised | |published | revised |
____________________|___________|___________|____________|__________|_________|___________
| | | | | |
2014 | | | | | |
| | | | | |
January............| 137,539 | 137,642 | 103 | 144 | 166 | 22
February...........| 137,761 | 137,830 | 69 | 222 | 188 | -34
March..............| 137,964 | 138,055 | 91 | 203 | 225 | 22
April..............| 138,268 | 138,385 | 117 | 304 | 330 | 26
May................| 138,497 | 138,621 | 124 | 229 | 236 | 7
June...............| 138,764 | 138,907 | 143 | 267 | 286 | 19
July...............| 139,007 | 139,156 | 149 | 243 | 249 | 6
August.............| 139,210 | 139,369 | 159 | 203 | 213 | 10
September..........| 139,481 | 139,619 | 138 | 271 | 250 | -21
October............| 139,742 | 139,840 | 98 | 261 | 221 | -40
November...........| 140,095 | 140,263 | 168 | 353 | 423 | 70
December (p).......| 140,347 | 140,592 | 245 | 252 | 329 | 77
____________________|___________|___________|____________|__________|_________|___________
p = preliminary
Adjustments to Population Estimates for the Household Survey
Effective with data for January 2015, updated population estimates have been used in the
household survey. Population estimates for the household survey are developed by the
U.S. Census Bureau. Each year, the Census Bureau updates the estimates to reflect new
information and assumptions about the growth of the population since the previous
decennial census. The change in population reflected in the new estimates results
from adjustments for net international migration, updated vital statistics and other
information, and some methodological changes in the estimation process.
In accordance with usual practice, BLS will not revise the official household survey
estimates for December 2014 and earlier months. To show the impact of the population
adjustments, however, differences in selected December 2014 labor force series based on
the old and new population estimates are shown in table B.
The adjustments increased the estimated size of the civilian noninstitutional population
in December by 528,000, the civilian labor force by 348,000, employment by 324,000, and
unemployment by 24,000. The number of persons not in the labor force was increased by
179,000. The total unemployment rate, employment-population ratio, and labor force
participation rate were unaffected.
Data users are cautioned that these annual population adjustments can affect the
comparability of household data series over time. Table C shows the effect of the
introduction of new population estimates on the comparison of selected labor force
measures between December 2014 and January 2015. Additional information on the
population adjustments and their effect on national labor force estimates is
available at www.bls.gov/cps/cps15adj.pdf.
Table B. Effect of the updated population controls on December 2014 estimates by sex,
race, and Hispanic or Latino ethnicity, not seasonally adjusted
(Numbers in thousands)
_______________________________________________________________________________________
| | | | | | |
| | | | | Black | |
| | | | | or | | Hispanic
Category |Total | Men | Women| White | African| Asian | or Latino
| | | | |American| | ethnicity
| | | | | | |
______________________________|______|_____|______|_______|________|_______|___________
| | | | | | |
Civilian noninstitutional | | | | | | |
population.................| 528 | 173 | 354 | 139 | 114 | 243 | 243
Civilian labor force......| 348 | 131 | 218 | 101 | 81 | 144 | 141
Participation rate......| .0 | .0 | .0 | .0 | .0 | -.1 | .0
Employed.................| 324 | 120 | 204 | 94 | 72 | 138 | 133
Employment-population | | | | |
ratio..................| .0 | .0 | .0 | .0 | .0 | -.1 | .0
Unemployed...............| 24 | 10 | 14 | 7 | 9 | 7 | 7
Unemployment rate.......| .0 | .0 | .0 | .0 | .0 | .0 | .0
Not in labor force........| 179 | 42 | 137 | 38 | 33 | 99 | 102
______________________________|______|_____|______|_______|________|_______|___________
NOTE: Detail may not sum to totals because of rounding. Estimates for the above race
groups (white, black or African American, and Asian) do not sum to totals because data
are not presented for all races. Persons whose ethnicity is identified as Hispanic or
Latino may be of any race.
Table C. December 2014-January 2015 changes in selected labor force measures,
with adjustments for population control effects
(Numbers in thousands)
______________________________________________________________________________
| | |
| | | Dec.-Jan.
| Dec.-Jan. | 2015 | change,
| change, | population | after re-
Category | as | control | moving the
| published | effect | population
| | | control
| | | effect (1)
_______________________________________|___________|____________|_____________
| | |
Civilian noninstitutional population.| 696 | 528 | 168
Civilian labor force...............| 1,051 | 348 | 703
Participation rate...............| .2 | .0 | .2
Employed..........................| 759 | 324 | 435(c)
Employment-population ratio......| .1 | .0 | .1
Unemployed........................| 291 | 24 | 267
Unemployment rate................| .1 | .0 | .1
Not in labor force.................| -354 | 179 | -533
_______________________________________|___________|____________|_____________
c = corrected.
1 This Dec.-Jan. change is calculated by subtracting the population
control effect from the over-the-month change in the published seasonally
adjusted estimates.
NOTE: Detail may not sum to totals because of rounding.
___________________________________________________________________________
| |
| Changes to The Employment Situation News Release |
| |
|Effective with this release, the U.S. Bureau of Labor Statistics introduced|
|several changes to The Employment Situation news release tables. |
| |
|Household survey table A-2 introduced seasonally adjusted series on the |
|labor force characteristics of Asians. These series appear in addition to |
|the not seasonally adjusted data for Asians displayed in the table. Also, |
|in summary table A, the seasonally adjusted unemployment rate for Asians |
|replaced the not seasonally adjusted series that was previously displayed |
|for the group. |
| |
|Household survey table A-3 introduced seasonally adjusted series on the |
|labor force characteristics of Hispanic men age 20 and over, Hispanic women|
|age 20 and over, and Hispanic teenagers age 16 to 19. The not seasonally |
|adjusted series for these groups continue to be displayed in the table. |
| |
|The establishment survey introduced two data series: (1) total nonfarm |
|employment, 3-month average change and (2) total private employment, |
|3-month average change. These new series have been added to establishment |
|survey summary table B. Additionally, in the employment section of summary |
|table B, the list of industries has been expanded to include utilities |
|(also published in table B-1). Also, hours and earnings of production and |
|nonsupervisory employees were removed from summary table B, although these |
|series continue to be published in establishment survey tables B-7 and B-8.|
|___________________________________________________________________________|
Job losers and persons who completed temporary jobs
5,3544,4804,3254,242–
Job leavers
815835798851–
Reentrants
2,9112,7612,7012,829–
New entrants
1,1811,0459711,033–
Duration of unemployment
Less than 5 weeks
2,4492,5052,3752,383–
5 to 14 weeks
2,4282,3782,2932,318–
15 to 26 weeks
1,6991,4031,2741,380–
27 weeks and over
3,6282,8222,7852,800–
Employed persons at work part time
Part time for economic reasons
7,2746,8516,7906,810–
Slack work or business conditions
4,4194,0684,0614,012–
Could only find part-time work
2,5922,4472,4322,460–
Part time for noneconomic reasons
19,31719,97119,73019,822–
Persons not in the labor force (not seasonally adjusted)
Marginally attached to the labor force
2,5922,1092,2602,234–
Discouraged workers
837698740682–
– December – January changes in household data are not shown due to the introduction of updated population controls.
NOTE: Persons whose ethnicity is identified as Hispanic or Latino may be of any race. Detail for the seasonally adjusted data shown in this table will not necessarily add to totals because of the independent seasonal adjustment of the various series. Updated population controls are introduced annually with the release of January data.
Employment Situation Summary Table B. Establishment data, seasonally adjusted
ESTABLISHMENT DATA
Summary table B. Establishment data, seasonally adjusted
Footnotes (1) Includes other industries, not shown separately. (2) Data relate to production employees in mining and logging and manufacturing, construction employees in construction, and nonsupervisory employees in the service-providing industries. (3) The indexes of aggregate weekly hours are calculated by dividing the current month’s estimates of aggregate hours by the corresponding annual average aggregate hours. (4) The indexes of aggregate weekly payrolls are calculated by dividing the current month’s estimates of aggregate weekly payrolls by the corresponding annual average aggregate weekly payrolls. (5) Figures are the percent of industries with employment increasing plus one-half of the industries with unchanged employment, where 50 percent indicates an equal balance between industries with increasing and decreasing employment. (p) Preliminary
NOTE: Data have been revised to reflect March 2014 benchmark levels and updated seasonal adjustment factors.
U.S. employers added a vigorous 257,000 jobs in January, and wages jumped by the most in six years — evidence that the job market is accelerating closer to full health.
The surprisingly robust report the government issued Friday also showed that hiring was far stronger in November and December than it had previously estimated. Employers added 414,000 jobs in November — the most in 17 years. Job growth in December was revised sharply up to 329,000 from 252,000.
Average hourly wages soared 12 cents in January to $24.75, the sharpest gain since 2008. Over the past 12 months, hourly pay, which has long been stagnant, has now risen 2.2 percent. That is ahead of inflation, which rose just 0.7 percent in 2014.
The unemployment rate last month rose to 5.7 percent from 5.6 percent. But that occurred for a good reason: More than 1 million Americans — the most since January 2000 — began looking for jobs, though not all of them found work, and their numbers swelled the number of people counted as unemployed. An influx of job hunters suggests that Americans have grown more confident about their prospects.
“For the average American, it’s certainly good news — 2015 is going to be the year of the American consumer,” said Russell Price, senior economist at the financial services firm Ameriprise. “With job growth being strong, we’re going to see a pickup in wages and salaries.”
Investors immediately responded to the better-than-expected jobs figures by selling ultra-safe U.S. Treasurys, sending yields up. The yield on the benchmark 10-year Treasury note rose to 1.88 percent from 1.81 percent shortly before the jobs report was released.
Stock market index futures also edged higher in pre-market trading. Futures that track the Standard & Poor’s 500 index and the Dow Jones industrial average each rose about 0.4 percent.
A sharp drop in gas prices has held down inflation and boosted Americans’ spending power. Strong hiring also tends to lift pay as employers compete for fewer workers. A big question is whether last month’s jump in wages can be sustained.
Job gains have now averaged 336,000 for the past three months, the best three-month pace in 17 years. Just a year ago, the three-month average was only 197,000.
“The labor market was about the last thing to recover from the Great Recession, and in the last six months it has picked up steam,” said Bill Hampel, chief economist at the Credit Union National Association. “The benefits for the middle class are now solidifying.”
The stepped-up hiring in January occurred across nearly all industries. Construction firms added 39,000 jobs and manufacturers 22,000. Retail jobs jumped by nearly 46,000. Hotels and restaurants added 37,100, health care 38,000.
The Federal Reserve is closely monitoring wages and other job market data as it considers when to begin raising the short-term interest rate it controls from a record low near zero. The Fed has kept rates at record lows for more than six years to help stimulate growth. Most economists think the central bank will start boosting rates as early as June.
Steady economic growth has encouraged companies to keep hiring. The economy expanded at a 4.8 percent annual rate during spring and summer, the fastest six-month pace in a decade, before slowing to a still-decent 2.6 percent pace in the final three months of 2014.
There are now 3.2 million more Americans earning paychecks than there were 12 months ago. That tends to boost consumer spending, which drives about 70 percent of economic growth.
More hiring, along with sharply lower gasoline prices, has boosted Americans’ confidence and spending power. Consumer confidence jumped in January to its highest level in a decade, according to a survey by the University of Michigan. And Americans increased their spending during the final three months of last year at the fastest pace in nearly nine years.
A more confident, free-spending consumer could lend a spark that’s been missing for most of the 5½bd}-year-old economic recovery. Americans have been largely holding the line on spending and trying to shrink their debt loads. Signs that they are poised to spend more have boosted optimism that the economy will expand more than 3 percent this year for the first time in a decade.
One sector that has benefited from consumers’ increased willingness to spend has been the auto industry. Auto sales jumped 14 percent in January from the previous year, according to Autodata Corp. Last month was the best January for sales in nine years.
NET U.S. JOB GAINS SINCE THE RECESSION HAVE GONE TO FOREIGN-BORN WORKERS
In the months and years since the recession began in December 2007, foreign-born workers have experienced a net increase in employment, while native-born Americans have experienced a net loss.
The Bureau of Labor Statistics released updated employment data Friday.
The new BLS figures reveal that since the start of the recession in 2007 — which is said to have ended in June 2009 — the number of foreign workers employed in the United States rose by 1.7 million.
In December 2007 the number of foreign-born workers was 22,810,000 by January 2009 the number has increased to 24,553,000.
Meanwhile the number of American-born workers employed decreased by 1.5 million, from 123,524,000 to 121,999,000.
While the foreign-born and American-born population experienced different statistical employment fates, both categories of adults experienced net growth.
The numbers come as Congress continues to debate a Department of Homeland Security appropriations bill that would defund President Obama’s executive amnesty, which has opened the door for millions of illegal immigrants to legally work in the United States.
Sen. Jeff Sessions (R-AL), Immigration Subcommittee Chairman, has been one of the most vocal opponents of the president’s actions and the administration’s immigration policies, which he argues harms American workers.
Friday, his office highlighted the employment discrepancies between native- and foreign- born employment.
“There are two jobs narratives: the one from the Administration, and the one lived and experienced by American workers. Fewer American workers are employed today than when the recession began. The President’s policies have profited the corporate immigration lobby and no-borders contingent, but have been only deleterious for wage-earners,” Session’s spokesman Stephen Miller emailed Breitbart News.
Miller highlighted that in addition to the annual flow of over 1.7 million permanent legal immigrants and nonimmigrant workers, as the Center for Immigration Studies recently exposed, since 2009 the administration has also provided another 5.5 million immigrants with employment authorization documents (EAD).
“What we are seeing in the BLS stats is the human fallout from the President’s actions,” Miller continued. “Figures such as these should be leading the nightly news. One of the first questions posited ought to be: will Minority Leader [Harry] Reid’s (D-NV) caucus continue to shield the issuance of 5 million more EADs for those illegally here?”
In 1977, Congress amended The Federal Reserve Act, stating the monetary policy objectives of the Federal Reserve as:
“The Board of Governors of the Federal Reserve System and the Federal Open Market Committee shall maintain long run growth of the monetary and credit aggregates commensurate with the economy’s long run potential to increase production, so as to promote effectively the goals of maximum employment, stable prices and moderate long-term interest rates.”
This is often called the “dual mandate” and guides the Fed’s decision-making in conducting monetary policy. On January 25, 2012, the Federal Open Market Committee (FOMC) released the principles regarding its longer-run goals and monetary policy strategy.
The statement notes that:
“The FOMC is firmly committed to fulfilling its statutory mandate from the Congress of promoting maximum employment, stable prices, and moderate long-term interest rates. The Committee seeks to explain its monetary policy decisions to the public as clearly as possible. Such clarity facilitates well-informed decision making by households and businesses, reduces economic and financial uncertainty, increases the effectiveness of monetary policy, and enhances transparency and accountability, which are essential in a democratic society.
Inflation, employment, and long-term interest rates fluctuate over time in response to economic and financial disturbances. Moreover, monetary policy actions tend to influence economic activity and prices with a lag. Therefore, the Committee’s policy decisions reflect its longer-run goals, its medium-term outlook, and its assessments of the balance of risks, including risks to the financial system that could impede the attainment of the Committee’s goals.
The inflation rate over the longer run is primarily determined by monetary policy, and hence the Committee has the ability to specify a longer-run goal for inflation. The Committee judges that inflation at the rate of 2 percent, as measured by the annual change in the price index for personal consumption expenditures, is most consistent over the longer run with the Federal Reserve’s statutory mandate. Communicating this inflation goal clearly to the public helps keep longer-term inflation expectations firmly anchored, thereby fostering price stability and moderate long-term interest rates and enhancing the Committee’s ability to promote maximum employment in the face of significant economic disturbances.
The maximum level of employment is largely determined by nonmonetary factors that affect the structure and dynamics of the labor market. These factors may change over time and may not be directly measurable. Consequently, it would not be appropriate to specify a fixed goal for employment; rather, the Committee’s policy decisions must be informed by assessments of the maximum level of employment, recognizing that such assessments are necessarily uncertain and subject to revision. The Committee considers a wide range of indicators in making these assessments. Information about Committee participants’ estimates of the longer-run normal rates of output growth and unemployment is published four times per year in the FOMC’s Summary of Economic Projections. For example, in the most recent projections, FOMC participants’ estimates of the longer-run normal rate of unemployment had a central tendency of 5.2 percent to 6.0 percent, roughly unchanged from last January but substantially higher than the corresponding interval several years earlier.”
Effective communications of the Committee’s objectives and economic forecasts increases the transparency, accountability, and effectiveness of policy decisions. To this end, the FOMC publishes the participants’ projections for the key economic variables and their estimates of the longer-run normal rates of output growth and unemployment four times a year in the Summary of Economic Projections. The projections are made by all FOMC participants, irrespective of whether they are voting members or not. The projections are prepared ahead of the FOMC meetings and do not necessarily reflect the discussions at the meetings that inform the FOMC’s decisions.
These charts plot the current rates of inflation and unemployment, as well as the FOMC participants’ most recent projections over the next three years and in the longer run. The dots show the median forecasts for the next three years and the dashed lines give the upper and lower ranges of the central tendency of the long-run projections.
Policy
This chart plots the federal funds rate and the rate after adjusting for the annual change in the price index for personal consumption expenditures excluding food and energy prices. Read more…
Federal Reserve Balance Sheet
During the financial crisis and in the period since the fed funds rate neared the zero lower bound, the FOMC has employed unconventional tools to improve the functioning of financial markets and to provide additional policy accommodation.
Federal Reserve Balance Sheet
During the financial crisis and in the period since the fed funds rate neared the zero lower bound, the FOMC has employed unconventional tools to improve the functioning of financial markets and to provide additional policy accommodation. As seen in the chart above, the use of these tools has increased the size of the Federal Reserve’s balance sheet and altered its composition. At the same, the increase in assets has been accompanied by an increase in liabilities of a similar magnitude, driven primarily by an increase in the reserve balances of depository institutions held at the Federal Reserve.
Federal Funds Rate Projections
In addition to its interest rate and balance sheet policies, the FOMC has enhanced its communications and increased transparency regarding its outlook, objectives and policy strategy. The dots represent individual policymakers’ projections of the appropriate federal funds rate target at the end of each of the next several years and in the longer run. It should be noted that these projections reflect the views of all the participants, irrespective of whether they are a voting member or not.
Federal Funds Rate Projections
In addition to its interest rate and balance sheet policies, the FOMC has enhanced its communications and increased transparency regarding its outlook, objectives and policy strategy. Forward guidance regarding the likely future path of policy is one such communications tool. In its March 2009 statement, the FOMC stated that it anticipates rates to remain at low levels for an extended period. At its August 2011meeting, the Committee elaborated further by stating that economic conditions are likely to warrant exceptionally low rates “at least through mid-2013.” In the January 2012 statement, in response to changes in current and expected economic conditions, the Committee altered its forward guidance regarding the period of exceptionally low rates to “at least through late-2014.” To further enhance its communications, the FOMC also published the participants’ projections for the federal funds rate in January 2012. In this chart, the dots represent individual policymakers’ projections of the appropriate federal funds rate target at the end of each of the next several years and in the longer run. It should be noted that these projections reflect the views of all the participants, irrespective of whether they are a voting member or not. Moreover, the projections are made in advance of the FOMC meetings and do not reflect how the participants’ views are enhanced from the discussions at the meetings. The statements released after each FOMC meeting reflect the policy decision of the voting members of the FOMC and their consensus view regarding the likely path of the federal funds rate in the future.
Story 1: First Good Jobs Report In Years with 321,000 Jobs Created In November With 5.8% Unemployment Rate U-3, 9.1 Million Unemployed — Still 10-12 Million Jobs Short Due To Low Labor Participation Rate of 62.8% — Years Away From Near Full Unemployment Rate of 3% With 67% Labor Participation Rate — National Debt Hits $18 Trillion and Climbing — Videos
Get Ready for More Layoffs and Higher Unemployment
Ep 28: Media Spins Horrible Holiday Sales as Reflecting Economic Strength
The Real Reason for Falling Oil and Gas Prices
Crude Oil Drop – Richard Perrin – December 5, 2014
Could Oil Fall To $60?
Series Preview: The Global Drop in Oil Prices
Falling Gas Prices Impact US Oil Extraction
Over $150 Billion of Oil Projects Face Axe in 2015
Nook Fail, Jobs Report, Buffet backs Clinton – Today’s Investor News
Mohamed El-Erian: Nov. Jobs Report Is Great News for Economy
Hiring surge: 321k jobs added in November
Employment Situation Report – November 2014
Labor Force Statistics from the Current Population Survey
Employment Level
147,287,000
Series Id:           LNS12000000
Seasonally Adjusted
Series title:        (Seas) Employment Level
Labor force status:  Employed
Type of data:        Number in thousands
Age:                 16 years and over
Year
Jan
Feb
Mar
Apr
May
Jun
Jul
Aug
Sep
Oct
Nov
Dec
Annual
2000
136559(1)
136598
136701
137270
136630
136940
136531
136662
136893
137088
137322
137614
2001
137778
137612
137783
137299
137092
136873
137071
136241
136846
136392
136238
136047
2002
135701
136438
136177
136126
136539
136415
136413
136705
137302
137008
136521
136426
2003
137417(1)
137482
137434
137633
137544
137790
137474
137549
137609
137984
138424
138411
2004
138472(1)
138542
138453
138680
138852
139174
139556
139573
139487
139732
140231
140125
2005
140245(1)
140385
140654
141254
141609
141714
142026
142434
142401
142548
142499
142752
2006
143150(1)
143457
143741
143761
144089
144353
144202
144625
144815
145314
145534
145970
2007
146028(1)
146057
146320
145586
145903
146063
145905
145682
146244
145946
146595
146273
2008
146378(1)
146156
146086
146132
145908
145737
145532
145203
145076
144802
144100
143369
2009
142152(1)
141640
140707
140656
140248
140009
139901
139492
138818
138432
138659
138013
2010
138451(1)
138599
138752
139309
139247
139148
139179
139427
139393
139111
139030
139266
2011
139287(1)
139422
139655
139622
139653
139409
139524
139904
140154
140335
140747
140836
2012
141677(1)
141943
142079
141963
142257
142432
142272
142204
142947
143369
143233
143212
2013
143384(1)
143464
143393
143676
143919
144075
144285
144179
144270
143485
144443
144586
2014
145224(1)
145266
145742
145669
145814
146221
146352
146368
146600
147283
147287
1 : Data affected by changes in population controls.
Civilian Labor Force Level
156,397,000
Series Id: LNS11000000
Seasonally Adjusted Series title: (Seas) Civilian Labor Force Level Labor force status: Civilian labor force Type of data: Number in thousands Age: 16 years and over
Year
Jan
Feb
Mar
Apr
May
Jun
Jul
Aug
Sep
Oct
Nov
Dec
Annual
2000
142267(1)
142456
142434
142751
142388
142591
142278
142514
142518
142622
142962
143248
2001
143800
143701
143924
143569
143318
143357
143654
143284
143989
144086
144240
144305
2002
143883
144653
144481
144725
144938
144808
144803
145009
145552
145314
145041
145066
2003
145937(1)
146100
146022
146474
146500
147056
146485
146445
146530
146716
147000
146729
2004
146842(1)
146709
146944
146850
147065
147460
147692
147564
147415
147793
148162
148059
2005
148029(1)
148364
148391
148926
149261
149238
149432
149779
149954
150001
150065
150030
2006
150214(1)
150641
150813
150881
151069
151354
151377
151716
151662
152041
152406
152732
2007
153144(1)
152983
153051
152435
152670
153041
153054
152749
153414
153183
153835
153918
2008
154063(1)
153653
153908
153769
154303
154313
154469
154641
154570
154876
154639
154655
2009
154210(1)
154538
154133
154509
154747
154716
154502
154307
153827
153784
153878
153111
2010
153404(1)
153720
153964
154642
154106
153631
153706
154087
153971
153631
154127
153639
2011
153198(1)
153280
153403
153566
153526
153379
153309
153724
154059
153940
154072
153927
2012
154328(1)
154826
154811
154565
154946
155134
154970
154669
155018
155507
155279
155485
2013
155699(1)
155511
155099
155359
155609
155822
155693
155435
155473
154625
155284
154937
2014
155460(1)
155724
156227
155421
155613
155694
156023
155959
155862
156278
156397
1 : Data affected by changes in population controls.
Labor Force Participation Rate
62.8%
Series Id: LNS11300000
Seasonally Adjusted
Series title: (Seas) Labor Force Participation Rate
Labor force status: Civilian labor force participation rate
Type of data: Percent or rate
Age: 16 years and over
Year
Jan
Feb
Mar
Apr
May
Jun
Jul
Aug
Sep
Oct
Nov
Dec
Annual
2000
67.3
67.3
67.3
67.3
67.1
67.1
66.9
66.9
66.9
66.8
66.9
67.0
2001
67.2
67.1
67.2
66.9
66.7
66.7
66.8
66.5
66.8
66.7
66.7
66.7
2002
66.5
66.8
66.6
66.7
66.7
66.6
66.5
66.6
66.7
66.6
66.4
66.3
2003
66.4
66.4
66.3
66.4
66.4
66.5
66.2
66.1
66.1
66.1
66.1
65.9
2004
66.1
66.0
66.0
65.9
66.0
66.1
66.1
66.0
65.8
65.9
66.0
65.9
2005
65.8
65.9
65.9
66.1
66.1
66.1
66.1
66.2
66.1
66.1
66.0
66.0
2006
66.0
66.1
66.2
66.1
66.1
66.2
66.1
66.2
66.1
66.2
66.3
66.4
2007
66.4
66.3
66.2
65.9
66.0
66.0
66.0
65.8
66.0
65.8
66.0
66.0
2008
66.2
66.0
66.1
65.9
66.1
66.1
66.1
66.1
66.0
66.0
65.9
65.8
2009
65.7
65.8
65.6
65.7
65.7
65.7
65.5
65.4
65.1
65.0
65.0
64.6
2010
64.8
64.9
64.9
65.2
64.9
64.6
64.6
64.7
64.6
64.4
64.6
64.3
2011
64.2
64.2
64.2
64.2
64.2
64.0
64.0
64.1
64.2
64.1
64.1
64.0
2012
63.7
63.9
63.8
63.7
63.8
63.8
63.7
63.5
63.6
63.7
63.6
63.6
2013
63.6
63.5
63.3
63.4
63.4
63.5
63.4
63.2
63.2
62.8
63.0
62.8
2014
63.0
63.0
63.2
62.8
62.8
62.8
62.9
62.8
62.7
62.8
62.8
Unemployment Level
9,110,000
Series Id:           LNS13000000
Seasonally Adjusted
Series title:        (Seas) Unemployment Level
Labor force status:  Unemployed
Type of data:        Number in thousands
Age:                 16 years and over
Year
Jan
Feb
Mar
Apr
May
Jun
Jul
Aug
Sep
Oct
Nov
Dec
Annual
2000
5708
5858
5733
5481
5758
5651
5747
5853
5625
5534
5639
5634
2001
6023
6089
6141
6271
6226
6484
6583
7042
7142
7694
8003
8258
2002
8182
8215
8304
8599
8399
8393
8390
8304
8251
8307
8520
8640
2003
8520
8618
8588
8842
8957
9266
9011
8896
8921
8732
8576
8317
2004
8370
8167
8491
8170
8212
8286
8136
7990
7927
8061
7932
7934
2005
7784
7980
7737
7672
7651
7524
7406
7345
7553
7453
7566
7279
2006
7064
7184
7072
7120
6980
7001
7175
7091
6847
6727
6872
6762
2007
7116
6927
6731
6850
6766
6979
7149
7067
7170
7237
7240
7645
2008
7685
7497
7822
7637
8395
8575
8937
9438
9494
10074
10538
11286
2009
12058
12898
13426
13853
14499
14707
14601
14814
15009
15352
15219
15098
2010
14953
15121
15212
15333
14858
14483
14527
14660
14578
14520
15097
14373
2011
13910
13858
13748
13944
13873
13971
13785
13820
13905
13604
13326
13090
2012
12650
12883
12732
12603
12689
12702
12698
12464
12070
12138
12045
12273
2013
12315
12047
11706
11683
11690
11747
11408
11256
11203
11140
10841
10351
2014
10236
10459
10486
9753
9799
9474
9671
9591
9262
8995
9110
Unemployment Rate U-3
5.8%
Series Id:           LNS14000000
Seasonally Adjusted
Series title:        (Seas) Unemployment Rate
Labor force status:  Unemployment rate
Type of data:        Percent or rate
Age:                 16 years and over
Year
Jan
Feb
Mar
Apr
May
Jun
Jul
Aug
Sep
Oct
Nov
Dec
Annual
2000
4.0
4.1
4.0
3.8
4.0
4.0
4.0
4.1
3.9
3.9
3.9
3.9
2001
4.2
4.2
4.3
4.4
4.3
4.5
4.6
4.9
5.0
5.3
5.5
5.7
2002
5.7
5.7
5.7
5.9
5.8
5.8
5.8
5.7
5.7
5.7
5.9
6.0
2003
5.8
5.9
5.9
6.0
6.1
6.3
6.2
6.1
6.1
6.0
5.8
5.7
2004
5.7
5.6
5.8
5.6
5.6
5.6
5.5
5.4
5.4
5.5
5.4
5.4
2005
5.3
5.4
5.2
5.2
5.1
5.0
5.0
4.9
5.0
5.0
5.0
4.9
2006
4.7
4.8
4.7
4.7
4.6
4.6
4.7
4.7
4.5
4.4
4.5
4.4
2007
4.6
4.5
4.4
4.5
4.4
4.6
4.7
4.6
4.7
4.7
4.7
5.0
2008
5.0
4.9
5.1
5.0
5.4
5.6
5.8
6.1
6.1
6.5
6.8
7.3
2009
7.8
8.3
8.7
9.0
9.4
9.5
9.5
9.6
9.8
10.0
9.9
9.9
2010
9.7
9.8
9.9
9.9
9.6
9.4
9.5
9.5
9.5
9.5
9.8
9.4
2011
9.1
9.0
9.0
9.1
9.0
9.1
9.0
9.0
9.0
8.8
8.6
8.5
2012
8.2
8.3
8.2
8.2
8.2
8.2
8.2
8.1
7.8
7.8
7.8
7.9
2013
7.9
7.7
7.5
7.5
7.5
7.5
7.3
7.2
7.2
7.2
7.0
6.7
2014
6.6
6.7
6.7
6.3
6.3
6.1
6.2
6.1
5.9
5.8
5.8
Employment -Population Ratio
5.9%
Series Id: LNS12300000
Seasonally Adjusted Series title: (Seas) Employment-Population Ratio Labor force status: Employment-population ratio Type of data: Percent or rate Age: 16 years and over
Year
Jan
Feb
Mar
Apr
May
Jun
Jul
Aug
Sep
Oct
Nov
Dec
Annual
2000
64.6
64.6
64.6
64.7
64.4
64.5
64.2
64.2
64.2
64.2
64.3
64.4
2001
64.4
64.3
64.3
64.0
63.8
63.7
63.7
63.2
63.5
63.2
63.0
62.9
2002
62.7
63.0
62.8
62.7
62.9
62.7
62.7
62.7
63.0
62.7
62.5
62.4
2003
62.5
62.5
62.4
62.4
62.3
62.3
62.1
62.1
62.0
62.1
62.3
62.2
2004
62.3
62.3
62.2
62.3
62.3
62.4
62.5
62.4
62.3
62.3
62.5
62.4
2005
62.4
62.4
62.4
62.7
62.8
62.7
62.8
62.9
62.8
62.8
62.7
62.8
2006
62.9
63.0
63.1
63.0
63.1
63.1
63.0
63.1
63.1
63.3
63.3
63.4
2007
63.3
63.3
63.3
63.0
63.0
63.0
62.9
62.7
62.9
62.7
62.9
62.7
2008
62.9
62.8
62.7
62.7
62.5
62.4
62.2
62.0
61.9
61.7
61.4
61.0
2009
60.6
60.3
59.9
59.8
59.6
59.4
59.3
59.1
58.7
58.5
58.6
58.3
2010
58.5
58.5
58.5
58.7
58.6
58.5
58.5
58.6
58.5
58.3
58.2
58.3
2011
58.4
58.4
58.4
58.4
58.4
58.2
58.2
58.3
58.4
58.4
58.5
58.5
2012
58.5
58.5
58.6
58.5
58.6
58.6
58.5
58.4
58.6
58.8
58.7
58.6
2013
58.6
58.6
58.5
58.6
58.7
58.7
58.7
58.6
58.6
58.2
58.6
58.6
2014
58.8
58.8
58.9
58.9
58.9
59.0
59.0
59.0
59.0
59.2
59.2
Unemployment Rate 16-19 Years Old
17.7%
Series Id: LNS14000012
Seasonally Adjusted Series title: (Seas) Unemployment Rate – 16-19 yrs. Labor force status: Unemployment rate Type of data: Percent or rate Age: 16 to 19 years
Year
Jan
Feb
Mar
Apr
May
Jun
Jul
Aug
Sep
Oct
Nov
Dec
Annual
2000
12.7
13.8
13.3
12.6
12.8
12.3
13.4
14.0
13.0
12.8
13.0
13.2
2001
13.8
13.7
13.8
13.9
13.4
14.2
14.4
15.6
15.2
16.0
15.9
17.0
2002
16.5
16.0
16.6
16.7
16.6
16.7
16.8
17.0
16.3
15.1
17.1
16.9
2003
17.2
17.2
17.8
17.7
17.9
19.0
18.2
16.6
17.6
17.2
15.7
16.2
2004
17.0
16.5
16.8
16.6
17.1
17.0
17.8
16.7
16.6
17.4
16.4
17.6
2005
16.2
17.5
17.1
17.8
17.8
16.3
16.1
16.1
15.5
16.1
17.0
14.9
2006
15.1
15.3
16.1
14.6
14.0
15.8
15.9
16.0
16.3
15.2
14.8
14.6
2007
14.8
14.9
14.9
15.9
15.9
16.3
15.3
15.9
15.9
15.4
16.2
16.8
2008
17.8
16.6
16.1
15.9
19.0
19.2
20.7
18.6
19.1
20.0
20.3
20.5
2009
20.7
22.3
22.2
22.2
23.4
24.7
24.3
25.0
25.9
27.2
26.9
26.7
2010
26.0
25.6
26.2
25.4
26.5
26.0
25.9
25.6
25.8
27.3
24.8
25.3
2011
25.5
24.1
24.3
24.5
23.9
24.8
24.8
25.1
24.5
24.2
24.1
23.3
2012
23.5
23.8
24.8
24.6
24.2
23.7
23.7
24.4
23.8
23.8
23.9
24.0
2013
23.5
25.2
23.9
23.7
24.1
23.8
23.4
22.6
21.3
22.0
20.8
20.2
2014
20.7
21.4
20.9
19.1
19.2
21.0
20.2
19.6
20.0
18.6
17.7
Average Weeks Unemployed
33.0%
Series Id:           LNS13008275
Seasonally Adjusted
Series title:        (Seas) Average Weeks Unemployed
Labor force status:  Unemployed
Type of data:        Number of weeks
Age:                 16 years and over
Year
Jan
Feb
Mar
Apr
May
Jun
Jul
Aug
Sep
Oct
Nov
Dec
Annual
2000
13.1
12.6
12.7
12.4
12.6
12.3
13.4
12.9
12.2
12.7
12.4
12.5
2001
12.7
12.8
12.8
12.4
12.1
12.7
12.9
13.3
13.2
13.3
14.3
14.5
2002
14.7
15.0
15.4
16.3
16.8
16.9
16.9
16.5
17.6
17.8
17.6
18.5
2003
18.5
18.5
18.1
19.4
19.0
19.9
19.7
19.2
19.5
19.3
19.9
19.8
2004
19.9
20.1
19.8
19.6
19.8
20.5
18.8
18.8
19.4
19.5
19.7
19.4
2005
19.5
19.1
19.5
19.6
18.6
17.9
17.6
18.4
17.9
17.9
17.5
17.5
2006
16.9
17.8
17.1
16.7
17.1
16.6
17.1
17.1
17.1
16.3
16.2
16.1
2007
16.3
16.7
17.8
16.9
16.6
16.5
17.2
17.0
16.3
17.0
17.3
16.6
2008
17.5
16.9
16.5
16.9
16.6
17.1
17.0
17.7
18.6
19.9
18.9
19.9
2009
19.8
20.2
20.9
21.7
22.4
23.9
25.1
25.3
26.6
27.5
28.9
29.7
2010
30.3
29.9
31.6
33.3
33.9
34.5
33.8
33.6
33.4
34.2
33.9
34.8
2011
37.2
37.5
39.2
38.7
39.5
39.7
40.4
40.2
40.2
39.1
40.3
40.7
2012
40.1
40.0
39.4
39.3
39.6
40.0
38.8
39.1
39.4
40.3
39.2
38.0
2013
35.4
36.9
37.0
36.6
36.9
35.7
36.7
37.0
36.8
36.0
37.1
37.1
2014
35.4
37.1
35.6
35.1
34.5
33.5
32.4
31.7
31.5
32.7
33.0
Not In Labor Force
2,109,000
Series Id:                       LNU05026642
Not Seasonally Adjusted
Series title:                    (Unadj) Not in Labor Force, Searched For Work and Available
Labor force status:              Not in labor force
Type of data:                    Number in thousands
Age:                             16 years and over
Job desires/not in labor force:  Want a job now
Reasons not in labor force:      Available to work now
Year
Jan
Feb
Mar
Apr
May
Jun
Jul
Aug
Sep
Oct
Nov
Dec
Annual
2000
1207
1281
1219
1216
1113
1142
1172
1097
1166
1044
1100
1125
1157
2001
1295
1337
1109
1131
1157
1170
1232
1364
1335
1398
1331
1330
1266
2002
1532
1423
1358
1397
1467
1380
1507
1456
1501
1416
1401
1432
1439
2003
1598
1590
1577
1399
1428
1468
1566
1665
1544
1586
1473
1483
1531
2004
1670
1691
1643
1526
1533
1492
1557
1587
1561
1647
1517
1463
1574
2005
1804
1673
1588
1511
1428
1583
1516
1583
1438
1414
1415
1589
1545
2006
1644
1471
1468
1310
1388
1584
1522
1592
1299
1478
1366
1252
1448
2007
1577
1451
1385
1391
1406
1454
1376
1365
1268
1364
1363
1344
1395
2008
1729
1585
1352
1414
1416
1558
1573
1640
1604
1637
1947
1908
1614
2009
2130
2051
2106
2089
2210
2176
2282
2270
2219
2373
2323
2486
2226
2010
2539
2527
2255
2432
2223
2591
2622
2370
2548
2602
2531
2609
2487
2011
2800
2730
2434
2466
2206
2680
2785
2575
2511
2555
2591
2540
2573
2012
2809
2608
2352
2363
2423
2483
2529
2561
2517
2433
2505
2614
2516
2013
2443
2588
2326
2347
2164
2582
2414
2342
2302
2283
2096
2427
2360
2014
2592
2303
2168
2160
2130
2028
2178
2141
2226
2192
2109
Not In Labor Force Searched For Work and Available, Discouraged Reasons For Not Currently Looking
698,000
Series Id:                       LNU05026645
Not Seasonally Adjusted
Series title:                    (Unadj) Not in Labor Force, Searched For Work and Available, Discouraged Reasons For Not Currently Looking
Labor force status:              Not in labor force
Type of data:                    Number in thousands
Age:                             16 years and over
Job desires/not in labor force:  Want a job now
Reasons not in labor force:      Discouragement over job prospects  (Persons who believe no job is available.)
Year
Jan
Feb
Mar
Apr
May
Jun
Jul
Aug
Sep
Oct
Nov
Dec
Annual
2000
236
267
258
331
280
309
266
203
253
232
236
269
262
2001
301
287
349
349
328
294
310
337
285
331
328
348
321
2002
328
375
330
320
414
342
405
378
392
359
385
403
369
2003
449
450
474
437
482
478
470
503
388
462
457
433
457
2004
432
484
514
492
476
478
504
534
412
429
392
442
466
2005
515
485
480
393
392
476
499
384
362
392
404
451
436
2006
396
386
451
381
323
481
428
448
325
331
349
274
381
2007
442
375
381
399
368
401
367
392
276
320
349
363
369
2008
467
396
401
412
400
420
461
381
467
484
608
642
462
2009
734
731
685
740
792
793
796
758
706
808
861
929
778
2010
1065
1204
994
1197
1083
1207
1185
1110
1209
1219
1282
1318
1173
2011
993
1020
921
989
822
982
1119
977
1037
967
1096
945
989
2012
1059
1006
865
968
830
821
852
844
802
813
979
1068
909
2013
804
885
803
835
780
1027
988
866
852
815
762
917
861
2014
837
755
698
783
697
676
741
775
698
770
698
Total Unemployment Rate U-6
11.4%
Series Id:           LNS13327709
Seasonally Adjusted
Series title:        (seas) Total unemployed, plus all marginally attached workers plus total employed part time for economic reasons, as a percent of all civilian labor force plus all marginally attached workers
Labor force status:  Aggregated totals unemployed
Type of data:        Percent or rate
Age:                 16 years and over
Percent/rates:       Unemployed and mrg attached and pt for econ reas as percent of labor force plus marg attached
Year
Jan
Feb
Mar
Apr
May
Jun
Jul
Aug
Sep
Oct
Nov
Dec
Annual
2000
7.1
7.2
7.1
6.9
7.1
7.0
7.0
7.1
7.0
6.8
7.1
6.9
2001
7.3
7.4
7.3
7.4
7.5
7.9
7.8
8.1
8.7
9.3
9.4
9.6
2002
9.5
9.5
9.4
9.7
9.5
9.5
9.6
9.6
9.6
9.6
9.7
9.8
2003
10.0
10.2
10.0
10.2
10.1
10.3
10.3
10.1
10.4
10.2
10.0
9.8
2004
9.9
9.7
10.0
9.6
9.6
9.5
9.5
9.4
9.4
9.7
9.4
9.2
2005
9.3
9.3
9.1
8.9
8.9
9.0
8.8
8.9
9.0
8.7
8.7
8.6
2006
8.4
8.4
8.2
8.1
8.2
8.4
8.5
8.4
8.0
8.2
8.1
7.9
2007
8.4
8.2
8.0
8.2
8.2
8.3
8.4
8.4
8.4
8.4
8.4
8.8
2008
9.2
9.0
9.1
9.2
9.7
10.1
10.5
10.8
11.0
11.8
12.6
13.6
2009
14.2
15.2
15.8
15.9
16.5
16.5
16.4
16.7
16.7
17.1
17.1
17.1
2010
16.7
17.0
17.1
17.2
16.6
16.4
16.4
16.5
16.8
16.6
16.9
16.6
2011
16.1
16.0
15.9
16.1
15.8
16.1
16.0
16.1
16.3
15.9
15.6
15.2
2012
15.1
15.0
14.5
14.6
14.8
14.8
14.9
14.7
14.7
14.4
14.4
14.4
2013
14.4
14.3
13.8
13.9
13.8
14.2
13.9
13.6
13.6
13.7
13.1
13.1
2014
12.7
12.6
12.7
12.3
12.2
12.1
12.2
12.0
11.8
11.5
11.4
Employment Situation Summary
Transmission of material in this release is embargoed until                  USDL-14-2184
8:30 a.m. (EST) Friday, December 5, 2014

Technical information:
 Household data:      (202) 691-6378  •  cpsinfo@bls.gov  •  www.bls.gov/cps
 Establishment data:  (202) 691-6555  •  cesinfo@bls.gov  •  www.bls.gov/ces

Media contact:       (202) 691-5902  •  PressOffice@bls.gov


                             THE EMPLOYMENT SITUATION -- NOVEMBER 2014


Total nonfarm payroll employment increased by 321,000 in November, and the unemployment
rate was unchanged at 5.8 percent, the U.S. Bureau of Labor Statistics reported today.
Job gains were widespread, led by growth in professional and business services, retail
trade, health care, and manufacturing.

Household Survey Data

In November, the unemployment rate held at 5.8 percent, and the number of unemployed
persons was little changed at 9.1 million. Over the year, the unemployment rate and
the number of unemployed persons were down by 1.2 percentage points and 1.7 million,
respectively. (See table A-1.)

Among the major worker groups, the unemployment rate for adult men rose to 5.4 percent
in November. The rates for adult women (5.3 percent), teenagers (17.7 percent), whites
(4.9 percent), blacks (11.1 percent), and Hispanics (6.6 percent) showed little change
over the month. The jobless rate for Asians was 4.8 percent (not seasonally adjusted),
little changed from a year earlier. (See tables A-1, A-2, and A-3.)

The number of long-term unemployed (those jobless for 27 weeks or more) was little
changed at 2.8 million in November. These individuals accounted for 30.7 percent of
the unemployed. Over the past 12 months, the number of long-term unemployed declined
by 1.2 million. (See table A-12.)

The civilian labor force participation rate held at 62.8 percent in November and has
been essentially unchanged since April. The employment-population ratio, at 59.2
percent, was unchanged in November but is up by 0.6 percentage point over the year.
(See table A-1.)

The number of persons employed part time for economic reasons (sometimes referred to
as involuntary part-time workers), at 6.9 million, changed little in November. These
individuals, who would have preferred full-time employment, were working part time
because their hours had been cut back or because they were unable to find a full-time
job. (See table A-8.)

In November, 2.1 million persons were marginally attached to the labor force,
essentially unchanged from a year earlier. (The data are not seasonally adjusted.)
These individuals were not in the labor force, wanted and were available for work,
and had looked for a job sometime in the prior 12 months. They were not counted as
unemployed because they had not searched for work in the 4 weeks preceding the
survey. (See table A-16.)

Among the marginally attached, there were 698,000 discouraged workers in November,
little different from a year earlier. (The data are not seasonally adjusted.)
Discouraged workers are persons not currently looking for work because they believe
no jobs are available for them. The remaining 1.4 million persons marginally attached
to the labor force in November had not searched for work for reasons such as school
attendance or family responsibilities. (See table A-16.)

Establishment Survey Data

Total nonfarm payroll employment rose by 321,000 in November, compared with an
average monthly gain of 224,000 over the prior 12 months. In November, job growth
was widespread, led by gains in professional and business services, retail trade,
health care, and manufacturing. (See table B-1.)

Employment in professional and business services increased by 86,000 in November,
compared with an average gain of 57,000 per month over the prior 12 months. Within
the industry, accounting and bookkeeping services added 16,000 jobs in November.
Employment continued to trend up in temporary help services (+23,000), management
and technical consulting services (+7,000), computer systems design and related
services (+7,000), and architectural and engineering services (+5,000).

Employment in retail trade rose by 50,000 in November, compared with an average
gain of 22,000 per month over the prior 12 months. In November, job gains occurred
in motor vehicle and parts dealers (+11,000); clothing and accessories stores
(+11,000); sporting goods, hobby, book, and music stores (+9,000); and nonstore
retailers (+6,000).

Health care added 29,000 jobs over the month. Employment continued to trend up in
offices of physicians (+7,000), home health care services (+5,000), outpatient care
centers (+4,000), and hospitals (+4,000). Over the past 12 months, employment in
health care has increased by 261,000.

In November, manufacturing added 28,000 jobs. Durable goods manufacturers accounted
for 17,000 of the increase, with small gains in most of the component industries.
Employment in nondurable goods increased by 11,000, with plastics and rubber products
(+7,000) accounting for most of the gain. Over the year, manufacturing has added
171,000 jobs, largely in durable goods.

Financial activities added 20,000 jobs in November, with half of the gain in insurance
carriers and related activities. Over the past year, insurance has contributed 70,000
jobs to the overall employment gain of 114,000 in financial activities.

Transportation and warehousing employment increased by 17,000 in November, with a
gain in couriers and messengers (+5,000). Over the past 12 months, transportation
and warehousing has added 143,000 jobs.

Employment in food services and drinking places continued to trend up in November
(+27,000) and has increased by 321,000 over the year.

Construction employment also continued to trend up in November (+20,000). Employment in
specialty trade contractors rose by 21,000, mostly in the residential component. Over
the past 12 months, construction has added 213,000 jobs, with just over half the gain
among specialty trade contractors.

In November, the average workweek for all employees on private nonfarm payrolls rose
by 0.1 hour to 34.6 hours. The manufacturing workweek rose by 0.2 hour to 41.1 hours,
and factory overtime edged up by 0.1 hour to 3.5 hours. The average workweek for
production and nonsupervisory employees on private nonfarm payrolls was unchanged at
33.8 hours. (See tables B-2 and B-7.)

Average hourly earnings for all employees on private nonfarm payrolls rose by 9 cents
to $24.66 in November. Over the year, average hourly earnings have risen by 2.1 percent.
In November, average hourly earnings of private-sector production and nonsupervisory
employees increased by 4 cents to $20.74. (See tables B-3 and B-8.)

The change in total nonfarm payroll employment for September was revised from +256,000
to +271,000, and the change for October was revised from +214,000 to +243,000. With
these revisions, employment gains in September and October combined were 44,000 more
than previously reported.

_____________
The Employment Situation for December is scheduled to be released on Friday,
January 9, 2015, at 8:30 a.m. (EST).


   __________________________________________________________________________________
  |                                                                                  |
  |               Upcoming Changes to the Employment Situation News Release          |
  |                                                                                  |
  |Effective with the release of January 2015 data on February 6, 2015, the U.S.     |
  |Bureau of Labor Statistics will introduce several changes to The Employment       |
  |Situation news release tables.                                                    |
  |                                                                                  |
  |Household survey table A-2 will introduce seasonally adjusted series on the labor |
  |force characteristics of Asians. These series will appear in addition to the not  |
  |seasonally adjusted data for Asians currently displayed in the table. Also, in    |
  |summary table A, the seasonally adjusted unemployment rate for Asians will replace|
  |the not seasonally adjusted series that is currently displayed for the group.     |
  |                                                                                  |
  |Household survey table A-3 will introduce seasonally adjusted series on the labor |
  |force characteristics of Hispanic men age 20 and over, Hispanic women age 20 and  |
  |over, and Hispanic teenagers age 16 to 19. The not seasonally adjusted series for |
  |these groups will continue to be displayed in the table.                          |
  |                                                                                  |
  |The establishment survey will introduce two data series: (1) total nonfarm        |
  |employment, 3-month average change and (2) total private employment, 3-month      |
  |average change. These new series will be added to establishment survey summary    |
  |table B. Additionally, in the employment section of summary table B, the list     |
  |of industries will be expanded to include utilities (currently published in       |
  |table B-1). Also, hours and earnings of production and nonsupervisory employees   |
  |will be removed from summary table B, although these series will continue to be   |
  |published in establishment survey tables B-7 and B-8. A sample of the new summary |
  |table B is available on the BLS website at www.bls.gov/ces/cesnewsumb.pdf.        |
  |__________________________________________________________________________________|


   __________________________________________________________________________________
  |                                                                                  |
  |            Revision of Seasonally Adjusted Household Survey Data                 |
  |                                                                                  |
  |In accordance with usual practice, The Employment Situation news release for      |
  |December 2014, scheduled for January 9, 2015, will incorporate annual revisions in|
  |seasonally adjusted household survey data. Seasonally adjusted data for the most  |
  |recent 5 years are subject to revision.                                           |
  |__________________________________________________________________________________|
Job losers and persons who completed temporary jobs
5,7314,5304,3584,483125
Job leavers
89082979483844
Reentrants
3,0652,8092,8712,773-98
New entrants
1,1691,1051,0631,0641
Duration of unemployment
Less than 5 weeks
2,4392,3832,4732,52956
5 to 14 weeks
2,5852,5082,3122,39078
15 to 26 weeks
1,7421,4161,4171,43114
27 weeks and over
4,0442,9542,9162,815-101
Employed persons at work part time
Part time for economic reasons
7,7237,1037,0276,850-177
Slack work or business conditions
4,8694,1624,2144,064-150
Could only find part-time work
2,4992,5622,4472,4536
Part time for noneconomic reasons
18,85819,56119,76920,004235
Persons not in the labor force (not seasonally adjusted)
Marginally attached to the labor force
2,0962,2262,1922,109–
Discouraged workers
762698770698–
– Over-the-month changes are not displayed for not seasonally adjusted data.
NOTE: Persons whose ethnicity is identified as Hispanic or Latino may be of any race. Detail for the seasonally adjusted data shown in this table will not necessarily add to totals because of the independent seasonal adjustment of the various series. Updated population controls are introduced annually with the release of January data.
Employment Situation Summary Table B. Establishment data, seasonally adjusted
ESTABLISHMENT DATA
Summary table B. Establishment data, seasonally adjusted
Footnotes (1) Includes other industries, not shown separately. (2) Data relate to production employees in mining and logging and manufacturing, construction employees in construction, and nonsupervisory employees in the service-providing industries. (3) The indexes of aggregate weekly hours are calculated by dividing the current month’s estimates of aggregate hours by the corresponding annual average aggregate hours. (4) The indexes of aggregate weekly payrolls are calculated by dividing the current month’s estimates of aggregate weekly payrolls by the corresponding annual average aggregate weekly payrolls. (5) Figures are the percent of industries with employment increasing plus one-half of the industries with unchanged employment, where 50 percent indicates an equal balance between industries with increasing and decreasing employment. (p) Preliminary
EMBARGOED UNTIL RELEASE AT 8:30 A.M. EST, TUESDAY, NOVEMBER 25, 2014
BEA 14-59
* See the navigation bar at the right side of the news release text for links to data tables,
contact personnel and their telephone numbers, and supplementary materials.
National Income and Product Accounts
Gross Domestic Product: Third Quarter 2014 (Second Estimate)
Corporate Profits: Third Quarter 2014 (Preliminary Estimate)
      Real gross domestic product -- the value of the production of goods and services in the United
States, adjusted for price changes -- increased at an annual rate of 3.9 percent in the third quarter of
2014, according to the "second" estimate released by the Bureau of Economic Analysis.  In the second
quarter, real GDP increased 4.6 percent.

      The GDP estimate released today is based on more complete source data than were available for
the "advance" estimate issued last month.  In the advance estimate, the increase in real GDP was 3.5
percent.  With the second estimate for the third quarter, private inventory investment decreased less than
previously estimated, and both personal consumption expenditures (PCE) and nonresidential fixed
investment increased more.  In contrast, exports increased less than previously estimated (see
"Revisions" on page 3).

      The increase in real GDP in the third quarter reflected positive contributions from PCE,
nonresidential fixed investment, federal government spending, exports, residential fixed investment, and
state and local government spending that were partly offset by a negative contribution from private
inventory investment.  Imports, which are a subtraction in the calculation of GDP, decreased.

      The deceleration in the percent change in real GDP reflected a downturn in private inventory
investment and decelerations in exports, in nonresidential fixed investment, in state and local
government spending, in PCE, and in residential fixed investment that were partly offset by a downturn
in imports and an upturn in federal government spending.

      The price index for gross domestic purchases, which measures prices paid by U.S. residents,
increased 1.4 percent in the third quarter, 0.1 percentage point more than in the advance estimate; this
index increased 2.0 percent in the second quarter.  Excluding food and energy prices, the price index for
gross domestic purchases increased 1.6 percent in the third quarter, compared with an increase of 1.7
percent in the second.


_____
FOOTNOTE.  Quarterly estimates are expressed at seasonally adjusted annual rates, unless otherwise
specified.  Quarter-to-quarter dollar changes are differences between these published estimates.  Percent
changes are calculated from unrounded data and are annualized.  "Real" estimates are in chained (2009)
dollars.  Price indexes are chain-type measures.

This news release is available on BEA's Web site along with the Technical Note and Highlights related
to this release.  For information on revisions, see "The Revisions to GDP, GDI, and Their
Major Components."
_____

      Real personal consumption expenditures increased 2.2 percent in the third quarter, compared
with an increase of 2.5 percent in the second.  Durable goods increased 8.7 percent, compared with an
increase of 14.1 percent.  Nondurable goods increased 2.2 percent, the same increase as in the second
quarter.  Services increased 1.2 percent, compared with an increase of 0.9 percent.

      Real nonresidential fixed investment increased 7.1 percent in the third quarter, compared with an
increase of 9.7 percent in the second.  Investment in nonresidential structures increased 1.1 percent,
compared with an increase of 12.6 percent.  Investment in equipment increased 10.7 percent, compared
with an increase of 11.2 percent.  Investment in intellectual property products increased 6.4 percent,
compared with an increase of 5.5 percent.  Real residential fixed investment increased 2.7 percent,
compared with an increase of 8.8 percent.

      Real exports of goods and services increased 4.9 percent in the third quarter, compared with an
increase of 11.1 percent in the second.  Real imports of goods and services decreased 0.7 percent, in
contrast to an increase of 11.3 percent.

      Real federal government consumption expenditures and gross investment increased 9.9 percent
in the third quarter, in contrast to a decrease of 0.9 percent in the second.  National defense increased
16.0 percent, compared with an increase of 0.9 percent.  Nondefense increased 0.4 percent, in contrast to
a decrease of 3.8 percent.  Real state and local government consumption expenditures and gross
investment increased 0.8 percent, compared with an increase of 3.4 percent.

      The change in real private inventories subtracted 0.12 percentage point from the third-quarter
change in real GDP after adding 1.42 percentage points to the second-quarter change.  Private
businesses increased inventories $79.1 billion in the third quarter, following increases of $84.8 billion in
the second quarter and $35.2 billion in the first.

      Real final sales of domestic product -- GDP less change in private inventories -- increased 4.1
percent in the third quarter, compared with an increase of 3.2 percent in the second.


Gross domestic purchases

      Real gross domestic purchases -- purchases by U.S. residents of goods and services wherever
produced -- increased 3.0 percent in the third quarter, compared with an increase of 4.8 percent in the
second.


Gross national product

      Real gross national product -- the value of the goods and services produced by the labor and
property supplied by U.S. residents -- increased 3.8 percent in the third quarter, compared with an
increase of 4.6 percent in the second.  GNP includes, and GDP excludes, net receipts of income from the
rest of the world, which decreased $1.6 billion in the third quarter, in contrast to an increase of $1.4
billion in the second; in the third quarter, receipts decreased $1.1 billion, and payments increased $0.5
billion.


Current-dollar GDP

      Current-dollar GDP -- the market value of the production of goods and services in the United
States -- increased 5.3 percent, or $227.0 billion, in the third quarter to a level of $17,555.2 billion.  In
the second quarter, current-dollar GDP increased 6.8 percent, or $284.2 billion.


Gross domestic income

      Real gross domestic income (GDI), which measures the value of the production of goods and
services in the United States as the costs incurred and the incomes earned on that production, increased
4.5 percent in the third quarter, compared with an increase of 4.0 percent (revised) in the second.  For a
given quarter, the estimates of GDP and GDI may differ for a variety of reasons, including the
incorporation of largely independent source data.  However, over longer time spans, the estimates of
GDP and GDI tend to follow similar patterns of change.


Revisions

      The upward revision to the percent change in real GDP primarily reflected upward revisions to
private inventory investment, to personal consumption expenditures, and to nonresidential fixed
investment that were partly offset by a downward revision to exports and an upward revision to imports.


                                         Advance Estimate  Second Estimate

                                     (Percent change from preceding quarter)
Real GDP...............................         3.5            3.9
Current-dollar GDP.....................         4.9            5.3
Real GDI...............................         --             4.5
Gross domestic purchases price index...         1.3            1.4
Corporate Profits


Profits from current production

      Profits from current production (corporate profits with inventory valuation adjustment (IVA) and
capital consumption adjustment (CCAdj)) increased $43.8 billion in the third quarter, compared with an
increase of $164.1 billion in the second.

      Profits of domestic financial corporations increased $20.3 billion in the third quarter, compared
with an increase of $33.3 billion in the second.  Profits of domestic nonfinancial corporations increased
$22.5 billion, compared with an increase of $134.3 billion.  The rest-of-the-world component of profits
increased $1.0 billion, in contrast to a decrease of $3.6 billion.  This measure is calculated as the
difference between receipts from the rest of the world and payments to the rest of the world.  In the third
quarter, receipts were unchanged, and payments decreased $1.0 billion.

      Taxes on corporate income decreased $4.8 billion in the third quarter, in contrast to an increase
of $45.7 billion in the second.  Profits after tax with IVA and CCAdj increased $48.6 billion, compared
with an increase of $118.4 billion.

      Dividends decreased $3.9 billion in the third quarter, compared with a decrease of $0.5 billion in
the second.  Undistributed profits increased $52.5 billion, compared with an increase of $118.8 billion.
Net cash flow with IVA -- the internal funds available to corporations for investment -- increased $25.1
billion, compared with an increase of $133.4 billion.

	The IVA and CCAdj are adjustments that convert inventory withdrawals and depreciation of
fixed assets reported on a tax-return, historical-cost basis to the current-cost economic measures used in
the national income and product accounts.  The IVA increased $16.8 billion in the third quarter,
compared with an increase of $11.9 billion in the second.  The CCAdj increased $1.2 billion, in contrast
to a decrease of $0.8 billion.


Gross value added of nonfinancial domestic corporate business

      In the third quarter, real gross value added of nonfinancial corporations increased, and profits per
unit of real gross value added increased.  The increase in unit profits reflected an increase in unit prices
that was partly offset by an increase in unit nonlabor costs; unit labor costs were unchanged.


                                     *          *          *

      BEA's national, international, regional, and industry estimates; the Survey of Current Business;
and BEA news releases are available without charge on BEA's Web site at www.bea.gov.  By visiting
the site, you can also subscribe to receive free e-mail summaries of BEA releases and announcements.


                                     *          *          *


                     Next release -- December 23, 2014 at 8:30 A.M. EST for:
                  Gross Domestic Product:  Third Quarter 2014 (Third Estimate)
                    Corporate Profits:  Third Quarter 2014 (Revised Estimate)


                                     *          *          *


Release dates in 2015


Gross Domestic Product

                 2014: IV and 2014 annual     2015: I          2015: II          2015: III

Advance....           January 30              April 29         July 30           October 29
Second.....           February 27             May 29           August 27         November 24
Third......           March 27                June 24          September 25      December 22


Corporate Profits

Preliminary...        ..                      May 29           August 27         November 24
Revised.......        March 27                June 24          September 25      December 22
Story 2: 315,000 More Americans Have Left Labor Force in September 2014 Bringing Total To 92,584,000 — Nearly Seven Years Later The Number of Employed Hits 146.6 Million Last Seen In November 2007 — Labor Participation Rate At 62.7% Should Be At 67% — The Ebola Income and Jobs Effect Will Hit In The November 7 Jobs Report After Elections — Videos
Current Labor Participation Rate Dropped To 62.7%
U.S. Labor Participation Rate – Graph of Reagan vs obama
Surge Of Hiring Cuts US Jobless Rate To 5.9 Pct.
JEC Chair Brady discusses the importance of declining labor force participation rate
Labor participation rate is down to unprecedented levels
What The Six-Year Unemployment Low Means For U.S. Economy
Ebola ;could wreck W Africa economies, #; warns World Bank
BBC News – Ebola crisis: Toll on regional economies
Counting the Cost – Ebola: The Economic Fallout
Employment Situation Summary
Transmission of material in this release is embargoed until                 USDL-14-1796
8:30 a.m. (EDT) Friday, October 3, 2014

Technical information:
 Household data:	(202) 691-6378  •  cpsinfo@bls.gov  •  www.bls.gov/cps
 Establishment data:	(202) 691-6555  •  cesinfo@bls.gov  •  www.bls.gov/ces

Media contact:		(202) 691-5902  •  PressOffice@bls.gov


                        THE EMPLOYMENT SITUATION -- SEPTEMBER 2014


Total nonfarm payroll employment increased by 248,000 in September, and the
unemployment rate declined to 5.9 percent, the U.S. Bureau of Labor Statistics
reported today. Employment increased in professional and business services,
retail trade, and health care.

Household Survey Data

In September, the unemployment rate declined by 0.2 percentage point to 5.9
percent. The number of unemployed persons decreased by 329,000 to 9.3 million.
Over the year, the unemployment rate and the number of unemployed persons were
down by 1.3 percentage points and 1.9 million, respectively. (See table A-1.)

Among the major worker groups, unemployment rates declined in September for
adult men (5.3 percent), whites (5.1 percent), and Hispanics (6.9 percent). The
rates for adult women (5.5 percent), teenagers (20.0 percent), and blacks (11.0
percent) showed little change over the month. The jobless rate for Asians was
4.3 percent (not seasonally adjusted), little changed from a year earlier.
(See tables A-1, A-2, and A-3.)

Among the unemployed, the number of job losers and persons who completed temporary
jobs decreased by 306,000 in September to 4.5 million. The number of long-term
unemployed (those jobless for 27 weeks or more) was essentially unchanged at 3.0
million in September. These individuals accounted for 31.9 percent of the unemployed.
Over the past 12 months, the number of long-term unemployed is down by 1.2 million.
(See tables A-11 and A-12.)

The civilian labor force participation rate, at 62.7 percent, changed little in
September. The employment-population ratio was 59.0 percent for the fourth
consecutive month. (See table A-1.)

The number of persons employed part time for economic reasons (sometimes referred
to as involuntary part-time workers) was little changed in September at 7.1 million.
These individuals, who would have preferred full-time employment, were working part
time because their hours had been cut back or because they were unable to find a
full-time job. (See table A-8.)

In September, 2.2 million persons were marginally attached to the labor force,
essentially unchanged from a year earlier. (The data are not seasonally adjusted.)
These individuals were not in the labor force, wanted and were available for work,
and had looked for a job sometime in the prior 12 months. They were not counted as
unemployed because they had not searched for work in the 4 weeks preceding the survey.
(See table A-16.)

Among the marginally attached, there were 698,000 discouraged workers in September,
down by 154,000 from a year earlier. (The data are not seasonally adjusted.) Discouraged
workers are persons not currently looking for work because they believe no jobs are
available for them. The remaining 1.5 million persons marginally attached to the labor
force in September had not searched for work for reasons such as school attendance or
family responsibilities. (See table A-16.)

Establishment Survey Data

Total nonfarm payroll employment rose by 248,000 in September, compared with an
average monthly gain of 213,000 over the prior 12 months. In September, job growth
occurred in professional and business services, retail trade, and health care.
(See table B-1.)

Professional and business services added 81,000 jobs in September, compared with an
average gain of 56,000 per month over the prior 12 months. In September, job gains
occurred in employment services (+34,000), management and technical consulting
services (+12,000), and architectural and engineering services (+6,000). Employment
in legal services declined by 5,000 over the month.

Employment in retail trade rose by 35,000 in September. Food and beverage stores
added 20,000 jobs, largely reflecting the return of workers who had been off payrolls
in August due to employment disruptions at a grocery store chain in New England.
Employment in retail trade has increased by 264,000 over the past 12 months.

Health care added 23,000 jobs in September, in line with the prior 12-month average
gain of 20,000 jobs per month. In September, employment rose in home health care
services (+7,000) and hospitals (+6,000).

Employment in information increased by 12,000 in September, with a gain of 5,000
in telecommunications. Over the year, employment in information has shown little net
change.

Mining employment rose by 9,000 in September, with the majority of the increase
occurring in support activities for mining (+7,000). Over the year, mining has added
50,000 jobs.

Within leisure and hospitality, employment in food services and drinking places
continued to trend up in September (+20,000) and is up by 290,000 over the year.

In September, construction employment continued on an upward trend (+16,000).
Within the industry, employment in residential building increased by 6,000. Over
the year, construction has added 230,000 jobs.

Employment in financial activities continued to trend up in September (+12,000) and
has added 89,000 jobs over the year. In September, job growth occurred in insurance
carriers and related activities (+6,000) and in securities, commodity contracts,
and investments (+5,000).

Employment in other major industries, including manufacturing, wholesale trade,
transportation and warehousing, and government, showed little change over the month.

In September, the average workweek for all employees on private nonfarm payrolls
edged up by 0.1 hour to 34.6 hours. The manufacturing workweek was unchanged at
40.9 hours, and factory overtime edged up by 0.1 hour to 3.5 hours. The average
workweek for production and nonsupervisory employees on private nonfarm payrolls
edged down by 0.1 hour to 33.7 hours. (See tables B-2 and B-7.)

Average hourly earnings for all employees on private nonfarm payrolls, at $24.53,
changed little in September (-1 cent). Over the year, average hourly earnings
have risen by 2.0 percent. In September, average hourly earnings of private-sector
production and nonsupervisory employees were unchanged at $20.67.
(See tables B-3 and B-8.)

The change in total nonfarm payroll employment for July was revised from +212,000
to +243,000, and the change for August was revised from +142,000 to +180,000.
With these revisions, employment gains in July and August combined were 69,000 more
than previously reported.

_____________
The Employment Situation for October is scheduled to be released on Friday,
November 7, 2014, at 8:30 a.m. (EST).
Employment Situation Summary Table A. Household data, seasonally adjusted
HOUSEHOLD DATA
Summary table A. Household data, seasonally adjusted
[Numbers in thousands]
Category
Sept.
2013
July
2014
Aug.
2014
Sept.
2014
Change from:
Aug.
2014-
Sept.
2014
Employment status
Civilian noninstitutional population
246,168
248,023
248,229
248,446
217
Civilian labor force
155,473
156,023
155,959
155,862
-97
Participation rate
63.2
62.9
62.8
62.7
-0.1
Employed
144,270
146,352
146,368
146,600
232
Employment-population ratio
58.6
59.0
59.0
59.0
0.0
Unemployed
11,203
9,671
9,591
9,262
-329
Unemployment rate
7.2
6.2
6.1
5.9
-0.2
Not in labor force
90,695
92,001
92,269
92,584
315
Unemployment rates
Total, 16 years and over
7.2
6.2
6.1
5.9
-0.2
Adult men (20 years and over)
7.0
5.7
5.7
5.3
-0.4
Adult women (20 years and over)
6.2
5.7
5.7
5.5
-0.2
Teenagers (16 to 19 years)
21.3
20.2
19.6
20.0
0.4
White
6.3
5.3
5.3
5.1
-0.2
Black or African American
13.0
11.4
11.4
11.0
-0.4
Asian (not seasonally adjusted)
5.3
4.5
4.5
4.3
–
Hispanic or Latino ethnicity
8.9
7.8
7.5
6.9
-0.6
Total, 25 years and over
5.9
5.0
5.1
4.7
-0.4
Less than a high school diploma
10.4
9.6
9.1
8.4
-0.7
High school graduates, no college
7.5
6.1
6.2
5.3
-0.9
Some college or associate degree
6.1
5.3
5.4
5.4
0.0
Bachelor’s degree and higher
3.7
3.1
3.2
2.9
-0.3
Reason for unemployment
Job losers and persons who completed temporary jobs
5,803
4,859
4,836
4,530
-306
Job leavers
984
862
860
829
-31
Reentrants
3,165
2,848
2,845
2,809
-36
New entrants
1,211
1,087
1,066
1,105
39
Duration of unemployment
Less than 5 weeks
2,571
2,587
2,609
2,383
-226
5 to 14 weeks
2,685
2,431
2,449
2,508
59
15 to 26 weeks
1,802
1,412
1,486
1,416
-70
27 weeks and over
4,125
3,155
2,963
2,954
-9
Employed persons at work part time
Part time for economic reasons
7,914
7,511
7,277
7,103
-174
Slack work or business conditions
4,955
4,609
4,261
4,162
-99
Could only find part-time work
2,548
2,519
2,587
2,562
-25
Part time for noneconomic reasons
18,919
19,662
19,526
19,561
35
Persons not in the labor force (not seasonally adjusted)
Marginally attached to the labor force
2,302
2,178
2,141
2,226
–
Discouraged workers
852
741
775
698
–
– Over-the-month changes are not displayed for not seasonally adjusted data.
NOTE: Persons whose ethnicity is identified as Hispanic or Latino may be of any race. Detail for the seasonally adjusted data shown in this table will not necessarily add to totals because of the independent seasonal adjustment of the various series. Updated population controls are introduced annually with the release of January data.
Employment Situation Summary Table B. Establishment data, seasonally adjusted
ESTABLISHMENT DATA
Summary table B. Establishment data, seasonally adjusted
Footnotes (1) Includes other industries, not shown separately. (2) Data relate to production employees in mining and logging and manufacturing, construction employees in construction, and nonsupervisory employees in the service-providing industries. (3) The indexes of aggregate weekly hours are calculated by dividing the current month’s estimates of aggregate hours by the corresponding annual average aggregate hours. (4) The indexes of aggregate weekly payrolls are calculated by dividing the current month’s estimates of aggregate weekly payrolls by the corresponding annual average aggregate weekly payrolls. (5) Figures are the percent of industries with employment increasing plus one-half of the industries with unchanged employment, where 50 percent indicates an equal balance between industries with increasing and decreasing employment. (p) Preliminary
Story 2: The Economy Still Stagnating As The 10 Million Plus Jobs Gap Widens — Videos
Making Sense of Today’s January Jobs Report
February 7th 2014 CNBC Stock Market Squawk Box (January Jobs Report)
Employment Level
145,224,000
Series Id:           LNS12000000
Seasonally Adjusted
Series title:        (Seas) Employment Level
Labor force status:  Employed
Type of data:        Number in thousands
Age:                 16 years and over
Year
Jan
Feb
Mar
Apr
May
Jun
Jul
Aug
Sep
Oct
Nov
Dec
Annual
2000
136559(1)
136598
136701
137270
136630
136940
136531
136662
136893
137088
137322
137614
2001
137778
137612
137783
137299
137092
136873
137071
136241
136846
136392
136238
136047
2002
135701
136438
136177
136126
136539
136415
136413
136705
137302
137008
136521
136426
2003
137417(1)
137482
137434
137633
137544
137790
137474
137549
137609
137984
138424
138411
2004
138472(1)
138542
138453
138680
138852
139174
139556
139573
139487
139732
140231
140125
2005
140245(1)
140385
140654
141254
141609
141714
142026
142434
142401
142548
142499
142752
2006
143150(1)
143457
143741
143761
144089
144353
144202
144625
144815
145314
145534
145970
2007
146028(1)
146057
146320
145586
145903
146063
145905
145682
146244
145946
146595
146273
2008
146378(1)
146156
146086
146132
145908
145737
145532
145203
145076
144802
144100
143369
2009
142152(1)
141640
140707
140656
140248
140009
139901
139492
138818
138432
138659
138013
2010
138451(1)
138599
138752
139309
139247
139148
139179
139427
139393
139111
139030
139266
2011
139287(1)
139422
139655
139622
139653
139409
139524
139904
140154
140335
140747
140836
2012
141677(1)
141943
142079
141963
142257
142432
142272
142204
142947
143369
143233
143212
2013
143384(1)
143464
143393
143676
143919
144075
144285
144179
144270
143485
144443
144586
2014
145224(1)
Civilian Labor Force
155,460,000
Series Id:           LNS11000000
Seasonally Adjusted
Series title:        (Seas) Civilian Labor Force Level
Labor force status:  Civilian labor force
Type of data:        Number in thousands
Age:                 16 years and over
Year
Jan
Feb
Mar
Apr
May
Jun
Jul
Aug
Sep
Oct
Nov
Dec
Annual
2000
142267(1)
142456
142434
142751
142388
142591
142278
142514
142518
142622
142962
143248
2001
143800
143701
143924
143569
143318
143357
143654
143284
143989
144086
144240
144305
2002
143883
144653
144481
144725
144938
144808
144803
145009
145552
145314
145041
145066
2003
145937(1)
146100
146022
146474
146500
147056
146485
146445
146530
146716
147000
146729
2004
146842(1)
146709
146944
146850
147065
147460
147692
147564
147415
147793
148162
148059
2005
148029(1)
148364
148391
148926
149261
149238
149432
149779
149954
150001
150065
150030
2006
150214(1)
150641
150813
150881
151069
151354
151377
151716
151662
152041
152406
152732
2007
153144(1)
152983
153051
152435
152670
153041
153054
152749
153414
153183
153835
153918
2008
154063(1)
153653
153908
153769
154303
154313
154469
154641
154570
154876
154639
154655
2009
154210(1)
154538
154133
154509
154747
154716
154502
154307
153827
153784
153878
153111
2010
153404(1)
153720
153964
154642
154106
153631
153706
154087
153971
153631
154127
153639
2011
153198(1)
153280
153403
153566
153526
153379
153309
153724
154059
153940
154072
153927
2012
154328(1)
154826
154811
154565
154946
155134
154970
154669
155018
155507
155279
155485
2013
155699(1)
155511
155099
155359
155609
155822
155693
155435
155473
154625
155284
154937
2014
155460(1)
Labor Force Participation Rate
63.0%
Series Id:           LNS11300000
Seasonally Adjusted
Series title:        (Seas) Labor Force Participation Rate
Labor force status:  Civilian labor force participation rate
Type of data:        Percent or rate
Age:                 16 years and over
Year
Jan
Feb
Mar
Apr
May
Jun
Jul
Aug
Sep
Oct
Nov
Dec
Annual
2000
67.3
67.3
67.3
67.3
67.1
67.1
66.9
66.9
66.9
66.8
66.9
67.0
2001
67.2
67.1
67.2
66.9
66.7
66.7
66.8
66.5
66.8
66.7
66.7
66.7
2002
66.5
66.8
66.6
66.7
66.7
66.6
66.5
66.6
66.7
66.6
66.4
66.3
2003
66.4
66.4
66.3
66.4
66.4
66.5
66.2
66.1
66.1
66.1
66.1
65.9
2004
66.1
66.0
66.0
65.9
66.0
66.1
66.1
66.0
65.8
65.9
66.0
65.9
2005
65.8
65.9
65.9
66.1
66.1
66.1
66.1
66.2
66.1
66.1
66.0
66.0
2006
66.0
66.1
66.2
66.1
66.1
66.2
66.1
66.2
66.1
66.2
66.3
66.4
2007
66.4
66.3
66.2
65.9
66.0
66.0
66.0
65.8
66.0
65.8
66.0
66.0
2008
66.2
66.0
66.1
65.9
66.1
66.1
66.1
66.1
66.0
66.0
65.9
65.8
2009
65.7
65.8
65.6
65.7
65.7
65.7
65.5
65.4
65.1
65.0
65.0
64.6
2010
64.8
64.9
64.9
65.2
64.9
64.6
64.6
64.7
64.6
64.4
64.6
64.3
2011
64.2
64.2
64.2
64.2
64.2
64.0
64.0
64.1
64.2
64.1
64.1
64.0
2012
63.7
63.9
63.8
63.7
63.8
63.8
63.7
63.5
63.6
63.7
63.6
63.6
2013
63.6
63.5
63.3
63.4
63.4
63.5
63.4
63.2
63.2
62.8
63.0
62.8
2014
63.0
Unemployment Level
10,236,000
Series Id:           LNS13000000
Seasonally Adjusted
Series title:        (Seas) Unemployment Level
Labor force status:  Unemployed
Type of data:        Number in thousands
Age:                 16 years and over
Year
Jan
Feb
Mar
Apr
May
Jun
Jul
Aug
Sep
Oct
Nov
Dec
Annual
2000
5708
5858
5733
5481
5758
5651
5747
5853
5625
5534
5639
5634
2001
6023
6089
6141
6271
6226
6484
6583
7042
7142
7694
8003
8258
2002
8182
8215
8304
8599
8399
8393
8390
8304
8251
8307
8520
8640
2003
8520
8618
8588
8842
8957
9266
9011
8896
8921
8732
8576
8317
2004
8370
8167
8491
8170
8212
8286
8136
7990
7927
8061
7932
7934
2005
7784
7980
7737
7672
7651
7524
7406
7345
7553
7453
7566
7279
2006
7064
7184
7072
7120
6980
7001
7175
7091
6847
6727
6872
6762
2007
7116
6927
6731
6850
6766
6979
7149
7067
7170
7237
7240
7645
2008
7685
7497
7822
7637
8395
8575
8937
9438
9494
10074
10538
11286
2009
12058
12898
13426
13853
14499
14707
14601
14814
15009
15352
15219
15098
2010
14953
15121
15212
15333
14858
14483
14527
14660
14578
14520
15097
14373
2011
13910
13858
13748
13944
13873
13971
13785
13820
13905
13604
13326
13090
2012
12650
12883
12732
12603
12689
12702
12698
12464
12070
12138
12045
12273
2013
12315
12047
11706
11683
11690
11747
11408
11256
11203
11140
10841
10351
2014
10236
Unemployment Rate
6.6%
Series Id:           LNS14000000
Seasonally Adjusted
Series title:        (Seas) Unemployment Rate
Labor force status:  Unemployment rate
Type of data:        Percent or rate
Age:                 16 years and over
Year
Jan
Feb
Mar
Apr
May
Jun
Jul
Aug
Sep
Oct
Nov
Dec
Annual
2000
4.0
4.1
4.0
3.8
4.0
4.0
4.0
4.1
3.9
3.9
3.9
3.9
2001
4.2
4.2
4.3
4.4
4.3
4.5
4.6
4.9
5.0
5.3
5.5
5.7
2002
5.7
5.7
5.7
5.9
5.8
5.8
5.8
5.7
5.7
5.7
5.9
6.0
2003
5.8
5.9
5.9
6.0
6.1
6.3
6.2
6.1
6.1
6.0
5.8
5.7
2004
5.7
5.6
5.8
5.6
5.6
5.6
5.5
5.4
5.4
5.5
5.4
5.4
2005
5.3
5.4
5.2
5.2
5.1
5.0
5.0
4.9
5.0
5.0
5.0
4.9
2006
4.7
4.8
4.7
4.7
4.6
4.6
4.7
4.7
4.5
4.4
4.5
4.4
2007
4.6
4.5
4.4
4.5
4.4
4.6
4.7
4.6
4.7
4.7
4.7
5.0
2008
5.0
4.9
5.1
5.0
5.4
5.6
5.8
6.1
6.1
6.5
6.8
7.3
2009
7.8
8.3
8.7
9.0
9.4
9.5
9.5
9.6
9.8
10.0
9.9
9.9
2010
9.7
9.8
9.9
9.9
9.6
9.4
9.5
9.5
9.5
9.5
9.8
9.4
2011
9.1
9.0
9.0
9.1
9.0
9.1
9.0
9.0
9.0
8.8
8.6
8.5
2012
8.2
8.3
8.2
8.2
8.2
8.2
8.2
8.1
7.8
7.8
7.8
7.9
2013
7.9
7.7
7.5
7.5
7.5
7.5
7.3
7.2
7.2
7.2
7.0
6.7
2014
6.6
Employment-Population Ratio
58.8%
Series Id:           LNS12300000
Seasonally Adjusted
Series title:        (Seas) Employment-Population Ratio
Labor force status:  Employment-population ratio
Type of data:        Percent or rate
Age:                 16 years and over
Year
Jan
Feb
Mar
Apr
May
Jun
Jul
Aug
Sep
Oct
Nov
Dec
Annual
2000
64.6
64.6
64.6
64.7
64.4
64.5
64.2
64.2
64.2
64.2
64.3
64.4
2001
64.4
64.3
64.3
64.0
63.8
63.7
63.7
63.2
63.5
63.2
63.0
62.9
2002
62.7
63.0
62.8
62.7
62.9
62.7
62.7
62.7
63.0
62.7
62.5
62.4
2003
62.5
62.5
62.4
62.4
62.3
62.3
62.1
62.1
62.0
62.1
62.3
62.2
2004
62.3
62.3
62.2
62.3
62.3
62.4
62.5
62.4
62.3
62.3
62.5
62.4
2005
62.4
62.4
62.4
62.7
62.8
62.7
62.8
62.9
62.8
62.8
62.7
62.8
2006
62.9
63.0
63.1
63.0
63.1
63.1
63.0
63.1
63.1
63.3
63.3
63.4
2007
63.3
63.3
63.3
63.0
63.0
63.0
62.9
62.7
62.9
62.7
62.9
62.7
2008
62.9
62.8
62.7
62.7
62.5
62.4
62.2
62.0
61.9
61.7
61.4
61.0
2009
60.6
60.3
59.9
59.8
59.6
59.4
59.3
59.1
58.7
58.5
58.6
58.3
2010
58.5
58.5
58.5
58.7
58.6
58.5
58.5
58.6
58.5
58.3
58.2
58.3
2011
58.4
58.4
58.4
58.4
58.4
58.2
58.2
58.3
58.4
58.4
58.5
58.5
2012
58.5
58.5
58.6
58.5
58.6
58.6
58.5
58.4
58.6
58.8
58.7
58.6
2013
58.6
58.6
58.5
58.6
58.7
58.7
58.7
58.6
58.6
58.2
58.6
58.6
2014
58.8
Unemployment Rate – 16-19 Yrs
20.7%
Series Id:           LNS14000012
Seasonally Adjusted
Series title:        (Seas) Unemployment Rate - 16-19 yrs.
Labor force status:  Unemployment rate
Type of data:        Percent or rate
Age:                 16 to 19 years
Year
Jan
Feb
Mar
Apr
May
Jun
Jul
Aug
Sep
Oct
Nov
Dec
Annual
2000
12.7
13.8
13.3
12.6
12.8
12.3
13.4
14.0
13.0
12.8
13.0
13.2
2001
13.8
13.7
13.8
13.9
13.4
14.2
14.4
15.6
15.2
16.0
15.9
17.0
2002
16.5
16.0
16.6
16.7
16.6
16.7
16.8
17.0
16.3
15.1
17.1
16.9
2003
17.2
17.2
17.8
17.7
17.9
19.0
18.2
16.6
17.6
17.2
15.7
16.2
2004
17.0
16.5
16.8
16.6
17.1
17.0
17.8
16.7
16.6
17.4
16.4
17.6
2005
16.2
17.5
17.1
17.8
17.8
16.3
16.1
16.1
15.5
16.1
17.0
14.9
2006
15.1
15.3
16.1
14.6
14.0
15.8
15.9
16.0
16.3
15.2
14.8
14.6
2007
14.8
14.9
14.9
15.9
15.9
16.3
15.3
15.9
15.9
15.4
16.2
16.8
2008
17.8
16.6
16.1
15.9
19.0
19.2
20.7
18.6
19.1
20.0
20.3
20.5
2009
20.7
22.3
22.2
22.2
23.4
24.7
24.3
25.0
25.9
27.2
26.9
26.7
2010
26.0
25.6
26.2
25.4
26.5
26.0
25.9
25.6
25.8
27.3
24.8
25.3
2011
25.5
24.1
24.3
24.5
23.9
24.8
24.8
25.1
24.5
24.2
24.1
23.3
2012
23.5
23.8
24.8
24.6
24.2
23.7
23.7
24.4
23.8
23.8
23.9
24.0
2013
23.5
25.2
23.9
23.7
24.1
23.8
23.4
22.6
21.3
22.0
20.8
20.2
2014
20.7
Average Weeks Unemployed
35.4 Weeks
Series Id:           LNS13008275
Seasonally Adjusted
Series title:        (Seas) Average Weeks Unemployed
Labor force status:  Unemployed
Type of data:        Number of weeks
Age:                 16 years and over
Year
Jan
Feb
Mar
Apr
May
Jun
Jul
Aug
Sep
Oct
Nov
Dec
Annual
2000
13.1
12.6
12.7
12.4
12.6
12.3
13.4
12.9
12.2
12.7
12.4
12.5
2001
12.7
12.8
12.8
12.4
12.1
12.7
12.9
13.3
13.2
13.3
14.3
14.5
2002
14.7
15.0
15.4
16.3
16.8
16.9
16.9
16.5
17.6
17.8
17.6
18.5
2003
18.5
18.5
18.1
19.4
19.0
19.9
19.7
19.2
19.5
19.3
19.9
19.8
2004
19.9
20.1
19.8
19.6
19.8
20.5
18.8
18.8
19.4
19.5
19.7
19.4
2005
19.5
19.1
19.5
19.6
18.6
17.9
17.6
18.4
17.9
17.9
17.5
17.5
2006
16.9
17.8
17.1
16.7
17.1
16.6
17.1
17.1
17.1
16.3
16.2
16.1
2007
16.3
16.7
17.8
16.9
16.6
16.5
17.2
17.0
16.3
17.0
17.3
16.6
2008
17.5
16.9
16.5
16.9
16.6
17.1
17.0
17.7
18.6
19.9
18.9
19.9
2009
19.8
20.2
20.9
21.7
22.4
23.9
25.1
25.3
26.6
27.5
28.9
29.7
2010
30.3
29.9
31.6
33.3
33.9
34.5
33.8
33.6
33.4
34.2
33.9
34.8
2011
37.2
37.5
39.2
38.7
39.5
39.7
40.4
40.2
40.2
39.1
40.3
40.7
2012
40.1
40.0
39.4
39.3
39.6
40.0
38.8
39.1
39.4
40.3
39.2
38.0
2013
35.4
36.9
37.0
36.6
36.9
35.7
36.7
37.0
36.8
36.0
37.1
37.1
2014
35.4
Median Weeks Unemployed
16.0 weeks
Series Id:           LNS13008276
Seasonally Adjusted
Series title:        (Seas) Median Weeks Unemployed
Labor force status:  Unemployed
Type of data:        Number of weeks
Age:                 16 years and over
Year
Jan
Feb
Mar
Apr
May
Jun
Jul
Aug
Sep
Oct
Nov
Dec
Annual
2000
5.8
6.1
6.0
6.1
5.8
5.7
6.0
6.3
5.2
6.1
6.1
6.0
2001
5.8
6.1
6.6
5.9
6.3
6.0
6.8
6.9
7.2
7.3
7.7
8.2
2002
8.4
8.3
8.4
8.9
9.5
11.0
8.9
9.0
9.5
9.6
9.3
9.6
2003
9.6
9.5
9.7
10.2
9.9
11.5
10.3
10.1
10.2
10.4
10.3
10.4
2004
10.6
10.2
10.2
9.5
9.9
11.0
8.9
9.2
9.6
9.5
9.7
9.5
2005
9.4
9.2
9.3
9.0
9.1
9.0
8.8
9.2
8.4
8.6
8.5
8.7
2006
8.6
9.1
8.7
8.4
8.5
7.3
8.0
8.4
8.0
7.9
8.3
7.5
2007
8.3
8.5
9.1
8.6
8.2
7.7
8.7
8.8
8.7
8.4
8.6
8.4
2008
9.0
8.7
8.7
9.4
7.9
9.0
9.7
9.7
10.2
10.4
9.8
10.5
2009
10.7
11.7
12.3
13.1
14.2
17.2
16.0
16.3
17.8
18.9
19.8
20.1
2010
20.0
19.9
20.5
22.1
22.3
25.0
22.2
20.9
20.2
21.4
21.0
22.0
2011
21.5
21.2
21.7
20.9
21.6
22.1
21.8
22.2
21.9
20.7
20.9
20.6
2012
20.9
20.0
19.6
19.2
19.8
19.8
17.2
18.2
18.7
20.0
18.6
17.8
2013
16.0
17.7
18.1
17.3
16.9
16.2
15.8
16.5
16.4
16.5
17.0
17.1
2014
16.0
Not in Labor Force, Searched for Work and Available
2,592,000
Series Id:                       LNU05026642
Not Seasonally Adjusted
Series title:                    (Unadj) Not in Labor Force, Searched For Work and Available
Labor force status:              Not in labor force
Type of data:                    Number in thousands
Age:                             16 years and over
Job desires/not in labor force:  Want a job now
Reasons not in labor force:      Available to work now
Year
Jan
Feb
Mar
Apr
May
Jun
Jul
Aug
Sep
Oct
Nov
Dec
Annual
2000
1207
1281
1219
1216
1113
1142
1172
1097
1166
1044
1100
1125
1157
2001
1295
1337
1109
1131
1157
1170
1232
1364
1335
1398
1331
1330
1266
2002
1532
1423
1358
1397
1467
1380
1507
1456
1501
1416
1401
1432
1439
2003
1598
1590
1577
1399
1428
1468
1566
1665
1544
1586
1473
1483
1531
2004
1670
1691
1643
1526
1533
1492
1557
1587
1561
1647
1517
1463
1574
2005
1804
1673
1588
1511
1428
1583
1516
1583
1438
1414
1415
1589
1545
2006
1644
1471
1468
1310
1388
1584
1522
1592
1299
1478
1366
1252
1448
2007
1577
1451
1385
1391
1406
1454
1376
1365
1268
1364
1363
1344
1395
2008
1729
1585
1352
1414
1416
1558
1573
1640
1604
1637
1947
1908
1614
2009
2130
2051
2106
2089
2210
2176
2282
2270
2219
2373
2323
2486
2226
2010
2539
2527
2255
2432
2223
2591
2622
2370
2548
2602
2531
2609
2487
2011
2800
2730
2434
2466
2206
2680
2785
2575
2511
2555
2591
2540
2573
2012
2809
2608
2352
2363
2423
2483
2529
2561
2517
2433
2505
2614
2516
2013
2443
2588
2326
2347
2164
2582
2414
2342
2302
2283
2096
2427
2360
2014
2592
Total Unemployment Rate U-6
12.7%
Series Id:           LNS13327709
Seasonally Adjusted
Series title:        (seas) Total unemployed, plus all marginally attached workers plus total employed part time for economic reasons, as a percent of all civilian labor force plus all marginally attached workers
Labor force status:  Aggregated totals unemployed
Type of data:        Percent or rate
Age:                 16 years and over
Percent/rates:       Unemployed and mrg attached and pt for econ reas as percent of labor force plus marg attached
Year
Jan
Feb
Mar
Apr
May
Jun
Jul
Aug
Sep
Oct
Nov
Dec
Annual
2000
7.1
7.2
7.1
6.9
7.1
7.0
7.0
7.1
7.0
6.8
7.1
6.9
2001
7.3
7.4
7.3
7.4
7.5
7.9
7.8
8.1
8.7
9.3
9.4
9.6
2002
9.5
9.5
9.4
9.7
9.5
9.5
9.6
9.6
9.6
9.6
9.7
9.8
2003
10.0
10.2
10.0
10.2
10.1
10.3
10.3
10.1
10.4
10.2
10.0
9.8
2004
9.9
9.7
10.0
9.6
9.6
9.5
9.5
9.4
9.4
9.7
9.4
9.2
2005
9.3
9.3
9.1
8.9
8.9
9.0
8.8
8.9
9.0
8.7
8.7
8.6
2006
8.4
8.4
8.2
8.1
8.2
8.4
8.5
8.4
8.0
8.2
8.1
7.9
2007
8.4
8.2
8.0
8.2
8.2
8.3
8.4
8.4
8.4
8.4
8.4
8.8
2008
9.2
9.0
9.1
9.2
9.7
10.1
10.5
10.8
11.0
11.8
12.6
13.6
2009
14.2
15.2
15.8
15.9
16.5
16.5
16.4
16.7
16.7
17.1
17.1
17.1
2010
16.7
17.0
17.1
17.2
16.6
16.4
16.4
16.5
16.8
16.6
16.9
16.6
2011
16.1
16.0
15.9
16.1
15.8
16.1
16.0
16.1
16.3
15.9
15.6
15.2
2012
15.1
15.0
14.5
14.6
14.8
14.8
14.9
14.7
14.7
14.4
14.4
14.4
2013
14.4
14.3
13.8
13.9
13.8
14.2
13.9
13.6
13.6
13.7
13.1
13.1
2014
12.7
Employment Situation Summary
Transmission of material in this release is embargoed until                      USDL-14-0168
8:30 a.m. (EST) Friday, February 7, 2014

Technical information:
Household data:        (202) 691-6378  •  cpsinfo@bls.gov  •  www.bls.gov/cps
Establishment data:    (202) 691-6555  •  cesinfo@bls.gov  •  www.bls.gov/ces

Media contact:         (202) 691-5902  •  PressOffice@bls.gov

                                 THE EMPLOYMENT SITUATION -- JANUARY 2014

Total nonfarm payroll employment rose by 113,000 in January, and the unemployment rate
was little changed at 6.6 percent, the U.S. Bureau of Labor Statistics reported today.
Employment grew in construction, manufacturing, wholesale trade, and mining.

  ------------------------------------------------------------------------------------
 |                        Changes to the Employment Situation Data                    |
 |                                                                                    |
 |Establishment survey data have been revised as a result of the annual benchmarking  |
 |process and the updating of seasonal adjustment factors. Also, household survey data|
 |for January 2014 reflect updated population estimates. See the notes at the end of  |
 |this release for more information about these changes.                              |
 |                                                                                    |
  ------------------------------------------------------------------------------------

Household Survey Data

Both the number of unemployed persons, at 10.2 million, and the unemployment rate, at
6.6 percent, changed little in January. Since October, the jobless rate has decreased by
0.6 percentage point. (See table A-1.)  (See the note and tables B and C for information
about the effect of annual population adjustments to the household survey estimates.)

Among the major worker groups, the unemployment rates for adult men (6.2 percent), adult
women (5.9 percent), teenagers (20.7 percent), whites (5.7 percent), blacks (12.1 percent),
and Hispanics (8.4 percent) showed little change in January. The jobless rate for Asians
was 4.8 percent (not seasonally adjusted), down by 1.7 percentage points over the year.
(See tables A-1, A-2, and A-3.)

The number of long-term unemployed (those jobless for 27 weeks or more), at 3.6 million,
declined by 232,000 in January. These individuals accounted for 35.8 percent of the
unemployed. The number of long-term unemployed has declined by 1.1 million over the year.
(See table A-12.)

After accounting for the annual adjustment to the population controls, the civilian labor
force rose by 499,000 in January, and the labor force participation rate edged up to 63.0
percent. Total employment, as measured by the household survey, increased by 616,000 over
the month, and the employment-population ratio increased by 0.2 percentage point to 58.8
percent. (See table A-1. For additional information about the effects of the population
adjustments, see table C.)

The number of persons employed part time for economic reasons (sometimes referred to as
involuntary part-time workers) fell by 514,000 to 7.3 million in January. These individuals
were working part time because their hours had been cut back or because they were unable to
find full-time work. (See table A-8.)

In January, 2.6 million persons were marginally attached to the labor force, little changed
from a year earlier. (The data are not seasonally adjusted.) These individuals were not in
the labor force, wanted and were available for work, and had looked for a job sometime in
the prior 12 months. They were not counted as unemployed because they had not searched for
work in the 4 weeks preceding the survey. (See table A-16.)

Among the marginally attached, there were 837,000 discouraged workers in January, about
unchanged from a year earlier. Discouraged workers are persons not currently looking for
work because they believe no jobs are available for them. The remaining 1.8 million persons
marginally attached to the labor force in January had not searched for work for reasons such
as school attendance or family responsibilities. (See table A-16.)

Establishment Survey Data

Total nonfarm payroll employment increased by 113,000 in January. In 2013, employment growth
averaged 194,000 per month. In January, job gains occurred in construction, manufacturing,
wholesale trade, and mining. (See table B-1.)

Construction added 48,000 jobs over the month, more than offsetting a decline of 22,000 in
December. In January, job gains occurred in both residential and nonresidential building
(+13,000 and +8,000, respectively) and in nonresidential specialty trade contractors
(+13,000). Heavy and civil engineering construction also added 10,000 jobs.

Employment in manufacturing increased in January (+21,000). Over the month, job gains
occurred in machinery (+7,000), wood products (+5,000), and motor vehicles and parts
(+5,000). Manufacturing added an average of 7,000 jobs per month in 2013.

In January, wholesale trade added 14,000 jobs, with most of the increase occurring in
nondurable goods (+10,000).

Mining added 7,000 jobs in January, compared with an average monthly gain of 2,000 jobs
in 2013.

Employment in professional and business services continued to trend up in January (+36,000).
The industry added an average of 55,000 jobs per month in 2013. Within the industry,
professional and technical services added 20,000 jobs in January.

Leisure and hospitality employment continued to trend up over the month (+24,000). Job
growth in the industry averaged 38,000 per month in 2013.

Employment in health care was essentially unchanged in January for the second consecutive
month.  Health care added an average of 17,000 jobs per month in 2013.

Employment in retail trade changed little in January (-13,000). Within the industry, sporting
goods, hobby, book, and music stores lost 22,000 jobs, offsetting job gains in the prior 3
months. In January, motor vehicle and parts dealers added 7,000 jobs.

In January, federal government employment decreased by 12,000; the U.S. Postal Service
accounted for most of this decline (-9,000).

Employment in other major industries, including transportation and warehousing, information,
and financial activities, showed little or no change over the month.

In January, the average workweek for all employees on private nonfarm payrolls was unchanged
at 34.4 hours. The manufacturing workweek declined by 0.2 hour to 40.7 hours, and factory
overtime edged down by 0.1 hour to 3.4 hours. The average workweek for production and
nonsupervisory employees on private nonfarm payrolls was unchanged at 33.5 hours. (See
tables B-2 and B-7.)

Average hourly earnings for all employees on private nonfarm payrolls rose by 5 cents to
$24.21. Over the year, average hourly earnings have risen by 46 cents, or 1.9 percent. In
January, average hourly earnings of private-sector production and nonsupervisory employees
increased by 6 cents to $20.39. (See tables B-3 and B-8.)

The change in total nonfarm payroll employment for November was revised from +241,000 to
+274,000, and the change for December was revised from +74,000 to +75,000. With these
revisions, employment gains in November and December were 34,000 higher than previously
reported. Monthly revisions result from additional reports received from businesses since
the last published estimates and the monthly recalculation of seasonal factors. The annual
benchmark process also contributed to the revisions in this news release.

_____________
The Employment Situation for February is scheduled to be released on Friday, March 7, 2014,
at 8:30 a.m. (EST).

                                  Revisions to Establishment Survey Data

In accordance with annual practice, the establishment survey data released today have been
benchmarked to reflect comprehensive counts of payroll jobs for March 2013. These counts
are derived principally from the Quarterly Census of Employment and Wages (QCEW), which
enumerates jobs covered by the UI tax system. The benchmark process results in revisions
to not seasonally adjusted data from April 2012 forward. Seasonally adjusted data from
January 2009 forward are subject to revision. In addition, data for some series prior to
2009, both seasonally adjusted and unadjusted, incorporate revisions.

The total nonfarm employment level for March 2013 was revised upward by 369,000 (+347,000
on a not seasonally adjusted basis, or 0.3 percent). The average benchmark revision over
the past 10 years was plus or minus 0.3 percent.

This revision incorporates the reclassification of jobs in the QCEW. Private household
employment is out of scope for the establishment survey. The QCEW reclassified some
private household employment into an industry that is in scope for the establishment
survey--services for the elderly and persons with disabilities. This reclassification
accounted for an increase of 466,000 jobs in the establishment survey. This increase of
466,000 associated with reclassification was offset by survey error of -119,000 for a
total net benchmark revision of +347,000 on a not seasonally adjusted basis. Historical
time series have been reconstructed to incorporate these revisions.

The effect of these revisions on the underlying trend in nonfarm payroll employment was
minor. For example, the over-the-year change in total nonfarm employment for 2013 was
revised from 2,186,000 to 2,322,000 seasonally adjusted. Table A presents revised total
nonfarm employment data on a seasonally adjusted basis for January through December 2013.

All revised historical CES data, as well as an article that discusses the benchmark and
post-benchmark revisions and other technical issues can be accessed through the CES
homepage at www.bls.gov/ces/. Information on the data released today also may be obtained
by calling (202) 691-6555.

Table A. Revisions in total nonfarm employment, January-December 2013, seasonally adjusted
(Numbers in thousands)

------------------------------------------------------------------------------------------
                    |                                    |
                    |                Level               |      Over-the-month change
                    |---------------------------------------------------------------------
    Year and month  |    As     |           |            |    As    |         |
                    |previously |    As     | Difference |previously|   As    | Difference
                    |published  |  revised  |            |published | revised |
------------------------------------------------------------------------------------------
                    |           |           |            |          |         |
          2013      |           |           |            |          |         |
                    |           |           |            |          |         |
 January............|  134,839  |  135,261  |     422    |    148   |    197  |      49
 February...........|  135,171  |  135,541  |     370    |    332   |    280  |     -52
 March..............|  135,313  |  135,682  |     369    |    142   |    141  |      -1
 April..............|  135,512  |  135,885  |     373    |    199   |    203  |       4
 May................|  135,688  |  136,084  |     396    |    176   |    199  |      23
 June...............|  135,860  |  136,285  |     425    |    172   |    201  |      29
 July...............|  135,949  |  136,434  |     485    |     89   |    149  |      60
 August.............|  136,187  |  136,636  |     449    |    238   |    202  |     -36
 September..........|  136,362  |  136,800  |     438    |    175   |    164  |     -11
 October............|  136,562  |  137,037  |     475    |    200   |    237  |      37
 November...........|  136,803  |  137,311  |     508    |    241   |    274  |      33
 December (p).......|  136,877  |  137,386  |     509    |     74   |     75  |       1
------------------------------------------------------------------------------------------

   p = preliminary

                Adjustments to Population Estimates for the Household Survey

Effective with data for January 2014, updated population estimates have been used in the
household survey. Population estimates for the household survey are developed by the U.S.
Census Bureau. Each year, the Census Bureau updates the estimates to reflect new information
and assumptions about the growth of the population since the previous decennial census. The
change in population reflected in the new estimates results from adjustments for net
international migration, updated vital statistics and other information, and some
methodological changes in the estimation process.

In accordance with usual practice, BLS will not revise the official household survey estimates
for December 2013 and earlier months. To show the impact of the population adjustments, however,
differences in selected December 2013 labor force series based on the old and new population
estimates are shown in table B.

The adjustments increased the estimated size of the civilian noninstitutional population in
December by 2,000, the civilian labor force by 24,000, employment by 22,000, and unemployment
by 2,000. The number of persons not in the labor force was reduced by 22,000. The total
unemployment rate, employment-population ratio, and labor force participation rate were
unaffected.

Data users are cautioned that these annual population adjustments can affect the comparability
of household data series over time. Table C shows the effect of the introduction of new
population estimates on the comparison of selected labor force measures between December 2013
and January 2014. Additional information on the population adjustments and their effect on
national labor force estimates is available at www.bls.gov/cps/cps14adj.pdf.

Table B. Effect of the updated population controls on December 2013 estimates by sex, race, and
Hispanic or Latino ethnicity, not seasonally adjusted
(Numbers in thousands)

__________________________________________________________________________________________________
                                        |      |     |      |       |        |       |
                                        |      |     |      |       |  Black |       |
                                        |      |     |      |       |    or  |       |  Hispanic
                  Category              | Total| Men | Women| White | African| Asian | or Latino
                                        |      |     |      |       |American|       | ethnicity
                                        |      |     |      |       |        |       |
________________________________________|______|_____|______|_______|________|_______|____________
                                        |      |     |      |       |        |       |
  Civilian noninstitutional population..|    2 |  29 |  -27 |   -65 |     48 |    33 |     -57
    Civilian labor force................|   24 |  24 |    0 |   -17 |     34 |    15 |     -38
      Participation rate................|   .0 |  .0 |   .0 |    .0 |     .0 |    .0 |      .0
     Employed...........................|   22 |  22 |    0 |   -16 |     31 |    14 |     -34
      Employment-population ratio.......|   .0 |  .0 |   .0 |    .0 |     .0 |    .0 |      .0
     Unemployed.........................|    2 |   3 |   -1 |    -1 |      4 |     1 |      -4
      Unemployment rate.................|   .0 |  .0 |   .0 |    .0 |     .0 |    .0 |      .0
    Not in labor force..................|  -22 |   4 |  -27 |   -48 |     14 |    18 |     -18
________________________________________|______|_____|______|_______|________|_______|____________

   NOTE: Detail may not sum to totals because of rounding. Estimates for the above race groups
(white, black or African American, and Asian) do not sum to totals because data are not presented
for all races. Persons whose ethnicity is identified as Hispanic or Latino may be of any race.

Table C. December 2013-January 2014 changes in selected labor force measures,
with adjustments for population control effects
(Numbers in thousands)

______________________________________________________________________________
                                       |           |            |
                                       |           |            |  Dec.-Jan.
                                       | Dec.-Jan. |    2014    |   change,
                                       |  change,  | population |  after re-
                Category               |    as     |   control  |  moving the
                                       | published |   effect   |  population
                                       |           |            |   control
                                       |           |            |  effect (1)
_______________________________________|___________|____________|_____________
                                       |           |            |
  Civilian noninstitutional population.|    170    |       2    |     168
    Civilian labor force...............|    523    |      24    |     499
      Participation rate...............|     .2    |      .0    |      .2
     Employed..........................|    638    |      22    |     616
      Employment-population ratio......|     .2    |      .0    |      .2
     Unemployed........................|   -115    |       2    |    -117
      Unemployment rate................|    -.1    |      .0    |     -.1
    Not in labor force.................|   -353    |     -22    |    -331
_______________________________________|___________|____________|_____________

   (1) This Dec.-Jan. change is calculated by subtracting the population
control effect from the over-the-month change in the published seasonally
adjusted estimates.
   NOTE: Detail may not sum to totals because of rounding.

  ------------------------------------------------------------------------------------
 |                                                                                    |
 |                            Change to the Household Survey Tables                   |
 |                                                                                    |
 |Effective with this release, household survey table A-10 includes two new seasonally|
 |adjusted series for women age 55 and over--the number of unemployed persons and the |
 |unemployment rate. These replace the series that were previously displayed for this |
 |group, which were not seasonally adjusted.                                          |
 |                                                                                    |
  ------------------------------------------------------------------------------------

  ------------------------------------------------------------------------------------
 |                                                                                    |
 |               Updated Veteran Weighting Methodology for Household Survey           |
 |                                                                                    |
 |Beginning with data for January 2014, estimates for veterans in table A-5 of this   |
 |release incorporate updated weighting procedures. The new weighting methodology more|
 |accurately reflects the current demographic composition of the veteran population.  |
 |The primary impact of the change was an increase in the "Gulf War-era I" veteran    |
 |population and a decrease in the number of veterans in the "Other service periods"  |
 |category. The updated methodology had little effect on unemployment rates for       |
 |veterans, regardless of gender or period of service. Additional information on the  |
 |effect of the change on labor force estimates for veterans is available at          |
 |www.bls.gov/cps/vetsweights2014.pdf.                                                |
 |                                                                                    |
  ------------------------------------------------------------------------------------
Employment Situation Summary Table A. Household data, seasonally adjusted
HOUSEHOLD DATA
Summary table A. Household data, seasonally adjusted
[Numbers in thousands]
CategoryJan.
2013Nov.
2013Dec.
2013Jan.
2014Change from:
Dec.
2013-
Jan.
2014Employment status Civilian noninstitutional population244,663246,567246,745246,915-Civilian labor force155,699155,284154,937155,460-Participation rate63.663.062.863.0-Employed143,384144,443144,586145,224-Employment-population ratio58.658.658.658.8-Unemployed12,31510,84110,35110,236-Unemployment rate7.97.06.76.6-Not in labor force88,96391,28391,80891,455- Unemployment rates Total, 16 years and over7.97.06.76.6-Adult men (20 years and over)7.46.76.36.2-Adult women (20 years and over)7.26.26.05.9-Teenagers (16 to 19 years)23.520.820.220.7-White7.16.15.95.7-Black or African American13.812.411.912.1-Asian (not seasonally adjusted)6.55.34.14.8-Hispanic or Latino ethnicity9.78.78.38.4- Total, 25 years and over6.55.85.65.4-Less than a high school diploma12.010.69.89.6-High school graduates, no college8.17.37.16.5-Some college or associate degree7.06.46.16.0-Bachelor’s degree and higher3.83.43.33.2- Reason for unemployment Job losers and persons who completed temporary jobs6,6755,7315,3665,407-Job leavers984890862818-Reentrants3,5203,0653,0362,937-New entrants1,2741,1691,2011,184- Duration of unemployment Less than 5 weeks2,7532,4392,2552,434-5 to 14 weeks3,0772,5852,5062,429-15 to 26 weeks1,8671,7421,6511,689-27 weeks and over4,7074,0443,8783,646- Employed persons at work part time Part time for economic reasons7,9837,7237,7717,257-Slack work or business conditions5,1174,8694,8844,405-Could only find part-time work2,6132,4992,5922,571-Part time for noneconomic reasons18,55618,85818,73119,165- Persons not in the labor force (not seasonally adjusted) Marginally attached to the labor force2,4432,0962,4272,592-Discouraged workers804762917837– December – January changes in household data are not shown due to the introduction of updated population controls.
NOTE: Persons whose ethnicity is identified as Hispanic or Latino may be of any race. Detail for the seasonally adjusted data shown in this table will not necessarily add to totals because of the independent seasonal adjustment of the various series. Updated population controls are introduced annually with the release of January data.
Employment Situation Summary Table B. Establishment data, seasonally adjusted
ESTABLISHMENT DATA
Summary table B. Establishment data, seasonally adjusted
Footnotes (1) Includes other industries, not shown separately. (2) Data relate to production employees in mining and logging and manufacturing, construction employees in construction, and nonsupervisory employees in the service-providing industries. (3) The indexes of aggregate weekly hours are calculated by dividing the current month’s estimates of aggregate hours by the corresponding annual average aggregate hours. (4) The indexes of aggregate weekly payrolls are calculated by dividing the current month’s estimates of aggregate weekly payrolls by the corresponding annual average aggregate weekly payrolls. (5) Figures are the percent of industries with employment increasing plus one-half of the industries with unchanged employment, where 50 percent indicates an equal balance between industries with increasing and decreasing employment. (p) Preliminary
NOTE: Data have been revised to reflect March 2013 benchmark levels and updated seasonal adjustment factors.
Weakness Continues as 113,000 Jobs Are Added in January
Employers added jobs at a slower-than-expected pace in January, the second month in a row that hiring has been disappointing and a sign that the labor market remains anemic despite indications of growth elsewhere in the economy.
Payrolls increased by 113,000, the Labor Department reported Friday morning, well below the gain of 180,000 that economists expected. The unemployment rate, based on a separate survey of households that was more encouraging, actually fell by a tenth of a percentage point, to 6.6 percent.
The data for January come after an even more disappointing report on the labor market for December, which was revised upward only slightly Friday, to show a gain of just 75,000 jobs, from 74,000. The level of hiring in January was also substantially below the average monthly gain of 178,000 positions over the last six months, as well as the monthly addition of 187,000 over the last year.
The two weak months in a row will prompt questions about whether the Federal Reserve acted prematurely when policy makers in December voted to begin scaling back the central bank’s expansive stimulus efforts.
The new data is not expected to alter the Fed’s course, economists said, but another poor report on hiring next month might force policy makers to rethink their plan when they next meet in late March.
“In one line: grim,” said Ian Shepherdson, chief economist at Pantheon Macroeconomics, in a note to clients Friday morning.
While seasonal adjustments may have played a role and upward revisions for hiring in October and November were more encouraging, he said, “The payroll rebound clearly is disappointing; none of the ground lost in December was recovered.”
Other economists conceded the picture for January was hardly bright, but cautioned it was too soon to conclude there had been a fundamental loss of momentum in the economy, especially given seasonal fluctuations in the data and the possibility that weather inhibited some hiring.
“We’re not seeing the takeoff that people wanted to see, but it’s not a disaster,” said Julia Coronado, chief economist for North America at BNP Paribas. “The 113,000 figure is definitely way below trend, but we want another month or two of data before we can draw conclusions.”
One mystery economists will be focusing on is why employment gains have not kept up with economic growth as measured by gross domestic product, which picked up substantially in the second half of 2013. The annualized pace of expansion was 3.2 percent in the fourth quarter, and 4.1 percent in the third quarter.
One reason may be that new technologies are allowing employers to make do with fewer workers, for instance the use of automated customer service systems instead of call centers, or Internet retailers’ taking over from brick-and-mortar stores where sales associates prowl the floors.
Another shift is evident from the yawning gap in employment for college graduates versus workers who lack a high school diploma. For people with a college degree or higher, the jobless rate was 3.1 percent, compared with 9.6 percent for Americans who did not finish high school.
Wintry conditions that held back hiring were blamed for the weakness in December, a theory popular among more optimistic economists after those numbers came out in early January.
But despite what seems like an endless series of snowstorms on the East Coast and arctic conditions in the Midwest recently, the reference week for the latest survey was Jan. 12-18, when conditions were fairly normal as Januaries go, limiting some of the impact of the weather in this report.
In the report on January, one sector holding back payrolls was the government, which shrank by 29,000 jobs in January. Excluding that loss, private employers added 142,000 positions, a slightly better showing.
Several other sectors which had been strong in recent months – education and health care as well as retailing – also lost positions, contributing to the overall weakness.
The falloff in hiring in the health care sector was especially notable. In December and January together, just 2,600 health care positions were filled. By contrast, as recently as November, nearly 25,000 health care workers were added to payrolls.
Although this area of the economy is going through a transformation as President Obama’s new health care plan is slowly introduced, that is unlikely to have caused the abrupt slowdown in hiring, said Ethan Harris, a head of global economics at Bank of America Merrill Lynch. If anything, he said, the law should create new jobs in the sector as health care coverage is expanded, even if higher costs for some employers result in job cuts elsewhere in the economy.
As for retail, which lost nearly 13,000 jobs in January, some of that reduction could have essentially been because of excessive hiring in December, Mr. Harris said, when stores added nearly 63,000 positions as the holiday shopping season peaked. The cuts may also have been spurred by weak results at some retailers, with chains like J. C. Penney announcing major job cuts last month, and Loehmann’s, the venerable discounter, now in liquidation.
The employment-population ratio, which has been falling as more workers drop out of the job market, edged up 0.2 percentage points to 58.8 percent. In recent years, the exit of people from the work force has reduced the unemployment rate, but it is a sign that people are giving up hope of finding a job in the face of slack conditions, hardly the way policy makers would like to see joblessness come down.
EMBARGOED UNTIL RELEASE AT 8:30 A.M. EST, THURSDAY, JANUARY 30, 2014
BEA 14-03
* See the navigation bar at the right side of the news release text for links to data tables,
contact personnel and their telephone numbers, and supplementary materials.
National Income and Product Accounts
Gross Domestic Product, 4th quarter and annual 2013 (advance estimate)
      Real gross domestic product -- the output of goods and services produced by labor and property
located in the United States -- increased at an annual rate of 3.2 percent in the fourth quarter of 2013
(that is, from the third quarter to the fourth quarter), according to the "advance" estimate released by the
Bureau of Economic Analysis.  In the third quarter, real GDP increased 4.1 percent.
The Bureau emphasized that the fourth-quarter advance estimate released today is based on
source data that are incomplete or subject to further revision by the source agency (see the box on page 4
and “Comparisons of Revisions to GDP” on page 5). The “second” estimate for the fourth quarter, based
on more complete data, will be released on February 28, 2014.
The increase in real GDP in the fourth quarter primarily reflected positive contributions from
personal consumption expenditures (PCE), exports, nonresidential fixed investment, private inventory
investment, and state and local government spending that were partly offset by negative contributions
from federal government spending and residential fixed investment. Imports, which are a subtraction in
the calculation of GDP, increased.
The deceleration in real GDP in the fourth quarter reflected a deceleration in private inventory
investment, a larger decrease in federal government spending, a downturn in residential fixed
investment, and decelerations in state and local government spending and in nonresidential fixed
investment that were partly offset by accelerations in exports and in PCE and a deceleration in imports.
The price index for gross domestic purchases, which measures prices paid by U.S. residents,
increased 1.2 percent in the fourth quarter, compared with an increase of 1.8 percent in the third.
Excluding food and energy prices, the price index for gross domestic purchases increased 1.7 percent in
the fourth quarter, compared with an increase of 1.5 percent in the third.
_______
FOOTNOTE. Quarterly estimates are expressed at seasonally adjusted annual rates, unless otherwise
specified. Quarter-to-quarter dollar changes are differences between these published estimates. Percent
changes are calculated from unrounded data and are annualized. “Real” estimates are in chained (2009)
dollars. Price indexes are chain-type measures.
Real personal consumption expenditures increased 3.3 percent in the fourth quarter, compared
with an increase of 2.0 percent in the third. Durable goods increased 5.9 percent, compared with an
increase of 7.9 percent. Nondurable goods increased 4.4 percent, compared with an increase of 2.9
percent. Services increased 2.5 percent, compared with an increase of 0.7 percent.
Real nonresidential fixed investment increased 3.8 percent in the fourth quarter, compared with
an increase of 4.8 percent in the third. Nonresidential structures decreased 1.2 percent, in contrast to an
increase of 13.4 percent. Equipment increased 6.9 percent, compared with an increase of 0.2 percent.
Intellectual property products increased 3.2 percent, compared with an increase of 5.8 percent. Real
residential fixed investment decreased 9.8 percent, in contrast to an increase of 10.3 percent.
Real exports of goods and services increased 11.4 percent in the fourth quarter, compared with
an increase of 3.9 percent in the third. Real imports of goods and services increased 0.9 percent,
compared with an increase of 2.4 percent.
Real federal government consumption expenditures and gross investment decreased 12.6 percent
in the fourth quarter, compared with a decrease of 1.5 percent in the third. National defense decreased
14.0 percent, compared with a decrease of 0.5 percent. Nondefense decreased 10.3 percent, compared
with a decrease of 3.1 percent. Real state and local government consumption expenditures and gross
investment increased 0.5 percent, compared with an increase of 1.7 percent.
The change in real private inventories added 0.42 percentage point to the fourth-quarter change
in real GDP after adding 1.67 percentage points to the third-quarter change. Private businesses
increased inventories $127.2 billion in the fourth quarter, following increases of $115.7 billion in the
third quarter and $56.6 billion in the second.
Real final sales of domestic product — GDP less change in private inventories — increased 2.8
percent in the fourth quarter, compared with an increase of 2.5 percent in the third.
Gross domestic purchases
Real gross domestic purchases — purchases by U.S. residents of goods and services wherever
produced — increased 1.8 percent in the fourth quarter, compared with an increase of 3.9 percent in the
third.
Disposition of personal income
Current-dollar personal income increased $69.4 billion (2.0 percent) in the fourth quarter,
compared with an increase of $140.0 billion (4.0 percent) in the third. The deceleration in personal
income primarily reflected downturns in personal dividend income and in farm proprietors’ income and
a deceleration in personal current transfer receipts that were partly offset by an acceleration in wages
and salaries.
Personal current taxes increased $23.7 billion in the fourth quarter, in contrast to a decrease of
$11.0 billion in the third.
Disposable personal income increased $45.7 billion (1.5 percent) in the fourth quarter, compared
with an increase of $151.0 billion (5.0 percent) in the third. Real disposable personal income increased
0.8 percent in the fourth quarter, compared with an increase of 3.0 percent in the third.
Personal outlays increased $118.6 billion (4.0 percent) in the fourth quarter, compared with an
increase of $113.4 billion (3.9 percent) in the third. Personal saving — disposable personal income less
personal outlays — was $545.1 billion in the fourth quarter, compared with $618.0 billion in the third.
The personal saving rate — personal saving as a percentage of disposable personal income — was
4.3 percent in the fourth quarter, compared with 4.9 percent in the third. For a comparison of personal
saving in BEA’s national income and product accounts with personal saving in the Federal Reserve
Board’s financial accounts of the United States and data on changes in net worth, go to www.bea.gov/national/nipaweb/Nipa-Frb.asp.
Current-dollar GDP
Current-dollar GDP — the market value of the nation’s output of goods and services — increased
4.6 percent, or $189.6 billion, in the fourth quarter to a level of $17,102.5 billion. In the third quarter,
current-dollar GDP increased 6.2 percent, or $251.9 billion.
2013 GDP
Real GDP increased 1.9 percent in 2013 (that is, from the 2012 annual level to the 2013 annual
level), compared with an increase of 2.8 percent in 2012.
The increase in real GDP in 2013 primarily reflected positive contributions from personal
consumption expenditures (PCE), exports, residential fixed investment, nonresidential fixed investment,
and private inventory investment that were partly offset by a negative contribution from federal
government spending. Imports, which are a subtraction in the calculation of GDP, increased.
The deceleration in real GDP in 2013 primarily reflected a deceleration in nonresidential fixed
investment, a larger decrease in federal government spending, and decelerations in PCE and in exports
that were partly offset by a deceleration in imports and a smaller decrease in state and local government
spending.
The price index for gross domestic purchases increased 1.2 percent in 2013, compared with an
increase of 1.7 percent in 2012.
Current-dollar GDP increased 3.4 percent, or $558.4 billion, in 2013, compared with an increase
of 4.6 percent, or $710.8 billion, in 2012.
During 2013 (that is, measured from the fourth quarter of 2012 to the fourth quarter of 2013) real
GDP increased 2.7 percent. Real GDP increased 2.0 percent during 2012. The price index for gross
domestic purchases increased 1.1 percent during 2013, compared with an increase of 1.5 percent in
2012.
________
BOX. Information on the assumptions used for unavailable source data is provided in a technical note
that is posted with the news release on BEA’s Web site. Within a few days after the release, a detailed
“Key Source Data and Assumptions” file is posted on the Web site. In the middle of each month, an analysis
of the current quarterly estimate of GDP and related series is made available on the Web site; click on
Survey of Current Business, “GDP and the Economy.” For information on revisions, see “Revisions to GDP, GDI,
and Their Major Components.”
________
BEA’s national, international, regional, and industry estimates; the Survey of Current Business;
and BEA news releases are available without charge on BEA’s Web site at www.bea.gov. By visiting
the site, you can also subscribe to receive free e-mail summaries of BEA releases and announcements.
* * *
Next release — February 28, 2014 at 8:30 A.M. EST for:
Gross Domestic Product: Fourth Quarter and Annual 2013 (Second Estimate)
* * *
Release dates in 2014
Gross Domestic Product
2013: IV and 2013 annual 2014: I 2014: II 2014: III
Advance… January 30 April 30 July 30 October 30
Second…. February 28 May 29 August 28 November 25
Third….. March 27 June 25 September 26 December 23
Corporate Profits
Preliminary… …… May 29 August 28 November 25
Revised……. March 27 June 25 September 26 December 23
Comparisons of Revisions to GDP
Quarterly estimates of GDP are released on the following schedule: the “advance” estimate, based on
source data that are incomplete or subject to further revision by the source agency, is released near the end of the
first month after the end of the quarter; as more detailed and more comprehensive data become available,
the “second” and “third” estimates are released near the end of the second and third months, respectively.
The “latest”” estimate reflects the results of both annual and comprehensive revisions.
Annual revisions, which generally cover the quarters of the 3 most recent calendar years, are usually carried
out each summer and incorporate newly available major annual source data. Comprehensive (or benchmark)
revisions are carried out at about 5-year intervals and incorporate major periodic source data, as well as
improvements in concepts and methods that update the accounts to portray more accurately the evolving U.S.
economy.
The table below shows comparisons of the revisions between quarterly percent changes of current-dollar
and of real GDP for the different vintages of the estimates. From the advance estimate to the second estimate (one
month later), the average revision to real GDP without regard to sign is 0.5 percentage point, while from the
advance estimate to the third estimate (two months later), it is 0.6 percentage point. From the advance estimate to
the latest estimate, the average revision without regard to sign is 1.3 percentage points. The average revision
(with regard to sign) from the advance estimate to the latest estimate is 0.3 percentage point, which is larger
than the average revisions from the advance estimate to the second or to the third estimates. The larger average
revisions to the latest estimate reflect the fact that comprehensive revisions include major improvements, such as
the incorporation of BEA’s latest benchmark input-output accounts. The quarterly estimates correctly indicate the
direction of change of real GDP 97 percent of the time, correctly indicate whether GDP is accelerating or
decelerating 72 percent of the time, and correctly indicate whether real GDP growth is above, near, or below trend
growth more than four-fifths of the time.
Revisions Between Quarterly Percent Changes of GDP: Vintage Comparisons
[Annual rates]
Vintages Average Average without Standard deviation of
compared regard to sign revisions without
regard to sign
US jobs numbers disappoint but ‘underlying tone is bullish’
Data extracted on: August 2, 2013 (2:01:21 PM)
Labor Force Statistics from the Current Population Survey
Employment Level
144,285,000
Series Id:           LNS12000000
Seasonally Adjusted
Series title:        (Seas) Employment Level
Labor force status:  Employed
Type of data:        Number in thousands
Age:                 16 years and over
Year
Jan
Feb
Mar
Apr
May
Jun
Jul
Aug
Sep
Oct
Nov
Dec
Annual
2000
136559(1)
136598
136701
137270
136630
136940
136531
136662
136893
137088
137322
137614
2001
137778
137612
137783
137299
137092
136873
137071
136241
136846
136392
136238
136047
2002
135701
136438
136177
136126
136539
136415
136413
136705
137302
137008
136521
136426
2003
137417(1)
137482
137434
137633
137544
137790
137474
137549
137609
137984
138424
138411
2004
138472(1)
138542
138453
138680
138852
139174
139556
139573
139487
139732
140231
140125
2005
140245(1)
140385
140654
141254
141609
141714
142026
142434
142401
142548
142499
142752
2006
143150(1)
143457
143741
143761
144089
144353
144202
144625
144815
145314
145534
145970
2007
146028(1)
146057
146320
145586
145903
146063
145905
145682
146244
145946
146595
146273
2008
146378(1)
146156
146086
146132
145908
145737
145532
145203
145076
144802
144100
143369
2009
142153(1)
141644
140721
140652
140250
140005
139898
139481
138810
138421
138665
138025
2010
138439(1)
138624
138767
139296
139255
139148
139167
139405
139388
139097
139046
139295
2011
139253(1)
139471
139643
139606
139681
139405
139509
139870
140164
140314
140771
140896
2012
141608(1)
142019
142020
141934
142302
142448
142250
142164
142974
143328
143277
143305
2013
143322(1)
143492
143286
143579
143898
144058
144285
1 : Data affected by changes in population controls.
Civilian Labor Force
155,798,000
Series Id:           LNS11000000
Seasonally Adjusted
Series title:        (Seas) Civilian Labor Force Level
Labor force status:  Civilian labor force
Type of data:        Number in thousands
Age:                 16 years and over
Year
Jan
Feb
Mar
Apr
May
Jun
Jul
Aug
Sep
Oct
Nov
Dec
Annual
2000
142267(1)
142456
142434
142751
142388
142591
142278
142514
142518
142622
142962
143248
2001
143800
143701
143924
143569
143318
143357
143654
143284
143989
144086
144240
144305
2002
143883
144653
144481
144725
144938
144808
144803
145009
145552
145314
145041
145066
2003
145937(1)
146100
146022
146474
146500
147056
146485
146445
146530
146716
147000
146729
2004
146842(1)
146709
146944
146850
147065
147460
147692
147564
147415
147793
148162
148059
2005
148029(1)
148364
148391
148926
149261
149238
149432
149779
149954
150001
150065
150030
2006
150214(1)
150641
150813
150881
151069
151354
151377
151716
151662
152041
152406
152732
2007
153144(1)
152983
153051
152435
152670
153041
153054
152749
153414
153183
153835
153918
2008
154063(1)
153653
153908
153769
154303
154313
154469
154641
154570
154876
154639
154655
2009
154232(1)
154526
154142
154479
154742
154710
154505
154300
153815
153804
153887
153120
2010
153455(1)
153702
153960
154577
154110
153623
153709
154078
153966
153681
154140
153649
2011
153244(1)
153269
153358
153478
153552
153369
153325
153707
154074
154010
154096
153945
2012
154356(1)
154825
154707
154451
154998
155149
154995
154647
155056
155576
155319
155511
2013
155654(1)
155524
155028
155238
155658
155835
155798
Labor Force Participation Rate
63.4%
Series Id:           LNS11300000
Seasonally Adjusted
Series title:        (Seas) Labor Force Participation Rate
Labor force status:  Civilian labor force participation rate
Type of data:        Percent or rate
Age:                 16 years and over
Year
Jan
Feb
Mar
Apr
May
Jun
Jul
Aug
Sep
Oct
Nov
Dec
Annual
2000
67.3
67.3
67.3
67.3
67.1
67.1
66.9
66.9
66.9
66.8
66.9
67.0
2001
67.2
67.1
67.2
66.9
66.7
66.7
66.8
66.5
66.8
66.7
66.7
66.7
2002
66.5
66.8
66.6
66.7
66.7
66.6
66.5
66.6
66.7
66.6
66.4
66.3
2003
66.4
66.4
66.3
66.4
66.4
66.5
66.2
66.1
66.1
66.1
66.1
65.9
2004
66.1
66.0
66.0
65.9
66.0
66.1
66.1
66.0
65.8
65.9
66.0
65.9
2005
65.8
65.9
65.9
66.1
66.1
66.1
66.1
66.2
66.1
66.1
66.0
66.0
2006
66.0
66.1
66.2
66.1
66.1
66.2
66.1
66.2
66.1
66.2
66.3
66.4
2007
66.4
66.3
66.2
65.9
66.0
66.0
66.0
65.8
66.0
65.8
66.0
66.0
2008
66.2
66.0
66.1
65.9
66.1
66.1
66.1
66.1
66.0
66.0
65.9
65.8
2009
65.7
65.8
65.6
65.7
65.7
65.7
65.5
65.4
65.1
65.0
65.0
64.6
2010
64.8
64.9
64.9
65.1
64.9
64.6
64.6
64.7
64.6
64.4
64.6
64.3
2011
64.2
64.2
64.2
64.2
64.2
64.0
64.0
64.1
64.2
64.1
64.1
64.0
2012
63.7
63.9
63.8
63.6
63.8
63.8
63.7
63.5
63.6
63.8
63.6
63.6
2013
63.6
63.5
63.3
63.3
63.4
63.5
63.4
Unemployment Level
11,514,000
Series Id:           LNS13000000
Seasonally Adjusted
Series title:        (Seas) Unemployment Level
Labor force status:  Unemployed
Type of data:        Number in thousands
Age:                 16 years and over
Year
Jan
Feb
Mar
Apr
May
Jun
Jul
Aug
Sep
Oct
Nov
Dec
Annual
2000
5708
5858
5733
5481
5758
5651
5747
5853
5625
5534
5639
5634
2001
6023
6089
6141
6271
6226
6484
6583
7042
7142
7694
8003
8258
2002
8182
8215
8304
8599
8399
8393
8390
8304
8251
8307
8520
8640
2003
8520
8618
8588
8842
8957
9266
9011
8896
8921
8732
8576
8317
2004
8370
8167
8491
8170
8212
8286
8136
7990
7927
8061
7932
7934
2005
7784
7980
7737
7672
7651
7524
7406
7345
7553
7453
7566
7279
2006
7064
7184
7072
7120
6980
7001
7175
7091
6847
6727
6872
6762
2007
7116
6927
6731
6850
6766
6979
7149
7067
7170
7237
7240
7645
2008
7685
7497
7822
7637
8395
8575
8937
9438
9494
10074
10538
11286
2009
12079
12881
13421
13826
14492
14705
14607
14819
15005
15382
15223
15095
2010
15016
15078
15192
15281
14856
14475
14542
14673
14577
14584
15094
14354
2011
13992
13798
13716
13872
13871
13964
13817
13837
13910
13696
13325
13049
2012
12748
12806
12686
12518
12695
12701
12745
12483
12082
12248
12042
12206
2013
12332
12032
11742
11659
11760
11777
11514
Unemployment Rate U-3
7.4%
Series Id:           LNS14000000
Seasonally Adjusted
Series title:        (Seas) Unemployment Rate
Labor force status:  Unemployment rate
Type of data:        Percent or rate
Age:                 16 years and over
Year
Jan
Feb
Mar
Apr
May
Jun
Jul
Aug
Sep
Oct
Nov
Dec
Annual
2000
4.0
4.1
4.0
3.8
4.0
4.0
4.0
4.1
3.9
3.9
3.9
3.9
2001
4.2
4.2
4.3
4.4
4.3
4.5
4.6
4.9
5.0
5.3
5.5
5.7
2002
5.7
5.7
5.7
5.9
5.8
5.8
5.8
5.7
5.7
5.7
5.9
6.0
2003
5.8
5.9
5.9
6.0
6.1
6.3
6.2
6.1
6.1
6.0
5.8
5.7
2004
5.7
5.6
5.8
5.6
5.6
5.6
5.5
5.4
5.4
5.5
5.4
5.4
2005
5.3
5.4
5.2
5.2
5.1
5.0
5.0
4.9
5.0
5.0
5.0
4.9
2006
4.7
4.8
4.7
4.7
4.6
4.6
4.7
4.7
4.5
4.4
4.5
4.4
2007
4.6
4.5
4.4
4.5
4.4
4.6
4.7
4.6
4.7
4.7
4.7
5.0
2008
5.0
4.9
5.1
5.0
5.4
5.6
5.8
6.1
6.1
6.5
6.8
7.3
2009
7.8
8.3
8.7
9.0
9.4
9.5
9.5
9.6
9.8
10.0
9.9
9.9
2010
9.8
9.8
9.9
9.9
9.6
9.4
9.5
9.5
9.5
9.5
9.8
9.3
2011
9.1
9.0
8.9
9.0
9.0
9.1
9.0
9.0
9.0
8.9
8.6
8.5
2012
8.3
8.3
8.2
8.1
8.2
8.2
8.2
8.1
7.8
7.9
7.8
7.8
2013
7.9
7.7
7.6
7.5
7.6
7.6
7.4
Employment-Population Ratio
58.7%
Series Id:           LNS12300000
Seasonally Adjusted
Series title:        (Seas) Employment-Population Ratio
Labor force status:  Employment-population ratio
Type of data:        Percent or rate
Age:                 16 years and over
Year
Jan
Feb
Mar
Apr
May
Jun
Jul
Aug
Sep
Oct
Nov
Dec
Annual
2000
64.6
64.6
64.6
64.7
64.4
64.5
64.2
64.2
64.2
64.2
64.3
64.4
2001
64.4
64.3
64.3
64.0
63.8
63.7
63.7
63.2
63.5
63.2
63.0
62.9
2002
62.7
63.0
62.8
62.7
62.9
62.7
62.7
62.7
63.0
62.7
62.5
62.4
2003
62.5
62.5
62.4
62.4
62.3
62.3
62.1
62.1
62.0
62.1
62.3
62.2
2004
62.3
62.3
62.2
62.3
62.3
62.4
62.5
62.4
62.3
62.3
62.5
62.4
2005
62.4
62.4
62.4
62.7
62.8
62.7
62.8
62.9
62.8
62.8
62.7
62.8
2006
62.9
63.0
63.1
63.0
63.1
63.1
63.0
63.1
63.1
63.3
63.3
63.4
2007
63.3
63.3
63.3
63.0
63.0
63.0
62.9
62.7
62.9
62.7
62.9
62.7
2008
62.9
62.8
62.7
62.7
62.5
62.4
62.2
62.0
61.9
61.7
61.4
61.0
2009
60.6
60.3
59.9
59.8
59.6
59.4
59.3
59.1
58.7
58.5
58.6
58.3
2010
58.5
58.5
58.5
58.7
58.6
58.5
58.5
58.5
58.5
58.3
58.2
58.3
2011
58.3
58.4
58.4
58.4
58.4
58.2
58.2
58.3
58.4
58.4
58.5
58.6
2012
58.5
58.6
58.5
58.5
58.6
58.6
58.5
58.4
58.7
58.7
58.7
58.6
2013
58.6
58.6
58.5
58.6
58.6
58.7
58.7
Unemployment Rate 16-19 Years Old
23.7%
Series Id:           LNS14000012
Seasonally Adjusted
Series title:        (Seas) Unemployment Rate - 16-19 yrs.
Labor force status:  Unemployment rate
Type of data:        Percent or rate
Age:                 16 to 19 years
Year
Jan
Feb
Mar
Apr
May
Jun
Jul
Aug
Sep
Oct
Nov
Dec
Annual
2000
12.7
13.8
13.3
12.6
12.8
12.3
13.4
14.0
13.0
12.8
13.0
13.2
2001
13.8
13.7
13.8
13.9
13.4
14.2
14.4
15.6
15.2
16.0
15.9
17.0
2002
16.5
16.0
16.6
16.7
16.6
16.7
16.8
17.0
16.3
15.1
17.1
16.9
2003
17.2
17.2
17.8
17.7
17.9
19.0
18.2
16.6
17.6
17.2
15.7
16.2
2004
17.0
16.5
16.8
16.6
17.1
17.0
17.8
16.7
16.6
17.4
16.4
17.6
2005
16.2
17.5
17.1
17.8
17.8
16.3
16.1
16.1
15.5
16.1
17.0
14.9
2006
15.1
15.3
16.1
14.6
14.0
15.8
15.9
16.0
16.3
15.2
14.8
14.6
2007
14.8
14.9
14.9
15.9
15.9
16.3
15.3
15.9
15.9
15.4
16.2
16.8
2008
17.8
16.6
16.1
15.9
19.0
19.2
20.7
18.6
19.1
20.0
20.3
20.5
2009
20.7
22.2
22.2
22.2
23.4
24.7
24.3
25.0
25.9
27.1
26.9
26.6
2010
26.0
25.4
26.2
25.5
26.6
26.0
26.0
25.7
25.8
27.2
24.6
25.1
2011
25.5
24.0
24.4
24.7
24.0
24.7
24.9
25.2
24.4
24.1
23.9
22.9
2012
23.4
23.7
25.0
24.9
24.4
23.7
23.9
24.5
23.7
23.7
23.6
23.5
2013
23.4
25.1
24.2
24.1
24.5
24.0
23.7
White Unemployment Rate
6.6%
Series Id:           LNS14000003
Seasonally Adjusted
Series title:        (Seas) Unemployment Rate - White
Labor force status:  Unemployment rate
Type of data:        Percent or rate
Age:                 16 years and over
Race:                White
Year
Jan
Feb
Mar
Apr
May
Jun
Jul
Aug
Sep
Oct
Nov
Dec
Annual
2000
3.4
3.6
3.5
3.4
3.5
3.4
3.5
3.6
3.5
3.4
3.5
3.5
2001
3.6
3.7
3.7
3.9
3.8
4.0
4.0
4.3
4.3
4.7
4.9
5.1
2002
5.1
5.0
5.0
5.2
5.1
5.1
5.2
5.1
5.1
5.1
5.1
5.1
2003
5.2
5.1
5.1
5.3
5.4
5.5
5.4
5.4
5.3
5.1
5.2
5.0
2004
5.0
4.9
5.1
5.0
4.9
5.0
4.7
4.7
4.6
4.6
4.6
4.5
2005
4.5
4.6
4.5
4.4
4.4
4.3
4.2
4.2
4.4
4.4
4.3
4.2
2006
4.1
4.1
4.0
4.1
4.1
4.1
4.1
4.1
3.9
3.9
4.0
3.9
2007
4.2
4.1
3.8
4.0
3.9
4.1
4.2
4.2
4.2
4.1
4.2
4.4
2008
4.4
4.4
4.5
4.4
4.8
5.0
5.2
5.4
5.4
5.9
6.2
6.7
2009
7.1
7.6
8.0
8.1
8.6
8.7
8.7
8.9
9.0
9.2
9.2
9.0
2010
8.8
8.9
8.9
9.0
8.7
8.6
8.5
8.6
8.6
8.6
8.9
8.5
2011
8.1
8.1
8.0
8.1
8.0
8.1
8.0
7.9
7.9
8.0
7.7
7.5
2012
7.4
7.4
7.3
7.4
7.4
7.3
7.4
7.2
7.0
6.9
6.8
6.9
2013
7.0
6.8
6.7
6.7
6.7
6.6
6.6
Black Unemployment Rate
Series Id:           LNS14000006
Seasonally Adjusted
Series title:        (Seas) Unemployment Rate - Black or African American
Labor force status:  Unemployment rate
Type of data:        Percent or rate
Age:                 16 years and over
Race:                Black or African American
Employment Situation News Release
Transmission of material in this release is embargoed                                  USDL-13-1527
until 8:30 a.m. (EDT) Friday, August 2, 2013

Technical information:
 Household data:       (202) 691-6378  *  cpsinfo@bls.gov  *  www.bls.gov/cps
 Establishment data:   (202) 691-6555  *  cesinfo@bls.gov  *  www.bls.gov/ces

Media contact:         (202) 691-5902  *  PressOffice@bls.gov

                         THE EMPLOYMENT SITUATION -- JULY 2013

Total nonfarm payroll employment increased by 162,000 in July, and the unemployment rate edged
down to 7.4 percent, the U.S. Bureau of Labor Statistics reported today. Employment rose in
retail trade, food services and drinking places, financial activities, and wholesale trade.

Household Survey Data

Both the number of unemployed persons, at 11.5 million, and the unemployment rate, at 7.4 percent,
edged down in July. Over the year, these measures were down by 1.2 million and 0.8 percentage
point, respectively. (See table A-1.)

Among the major worker groups, the unemployment rates for adult women (6.5 percent) and blacks
(12.6 percent) declined in July. The rates for adult men (7.0 percent), teenagers (23.7 percent),
whites (6.6 percent), and Hispanics (9.4 percent) showed little or no change. The jobless rate
for Asians was 5.7 percent (not seasonally adjusted), little changed from a year earlier. (See
tables A-1, A-2, and A-3.)

In July, the number of long-term unemployed (those jobless for 27 weeks or more) was little
changed at 4.2 million. These individuals accounted for 37.0 percent of the unemployed. The
number of long-term unemployed has declined by 921,000 over the past year. (See table A-12.)

The civilian labor force participation rate was 63.4 percent in July, little changed over the
month. The employment-population ratio was unchanged at 58.7 percent. (See table A-1.)

The number of persons employed part time for economic reasons (sometimes referred to as involuntary
part-time workers) was essentially unchanged at 8.2 million in July. These individuals were working
part time because their hours had been cut back or because they were unable to find a full-time
job. (See table A-8.)

In July, 2.4 million persons were marginally attached to the labor force, little changed from a
year earlier. (The data are not seasonally adjusted.) These individuals were not in the labor
force, wanted and were available for work, and had looked for a job sometime in the prior 12
months. They were not counted as unemployed because they had not searched for work in the 4 weeks
preceding the survey. (See table A-16.)

Among the marginally attached, there were 988,000 discouraged workers in July, up by 136,000 from
a year earlier. (The data are not seasonally adjusted.) Discouraged workers are persons not
currently looking for work because they believe no jobs are available for them. The remaining
1.4 million persons marginally attached to the labor force in July had not searched for work for
reasons such as school attendance or family responsibilities. (See table A-16.)

Establishment Survey Data

Total nonfarm payroll employment increased by 162,000 in July, with gains in retail trade, food
services and drinking places, financial activities, and wholesale trade. Over the prior 12 months,
nonfarm employment growth averaged 189,000 per month. (See table B-1.)

Retail trade added 47,000 jobs in July and has added 352,000 over the past 12 months. In July, job
growth occurred in general merchandise stores (+9,000), motor vehicle and parts dealers (+6,000),
building material and garden supply stores (+6,000), and health and personal care stores (+5,000).

Within leisure and hospitality, employment in food services and drinking places increased by 38,000
in July and by 381,000 over the year.

Financial activities employment increased by 15,000 in July, with a gain of 6,000 in securities,
commodity contracts, and investments. Over the year, financial activities has added 120,000 jobs.

Employment increased in wholesale trade (+14,000) in July. Over the past 12 months, this industry
has added 83,000 jobs.

Employment in professional and business services continued to trend up in July (+36,000). Within
the industry, job growth continued in management of companies and enterprises (+7,000) and in
management and technical consulting services (+7,000). Employment in temporary help services
changed little over the month.

Manufacturing employment was essentially unchanged in July and has changed little, on net, over
the past 12 months. Within the industry, employment in motor vehicles and parts rose by 9,000
in July.

Employment in health care was essentially unchanged over the month. Thus far in 2013, health
care has added an average of 16,000 jobs per month, compared with an average monthly increase
of 27,000 in 2012.

Employment in other major industries, including mining and logging, construction, transportation
and warehousing, and government, showed little change in July.

The average workweek for all employees on private nonfarm payrolls decreased by 0.1 hour in July
to 34.4 hours. In manufacturing, the workweek decreased by 0.2 hour to 40.6 hours, and overtime
declined by 0.2 hour to 3.2 hours. The average workweek for production and nonsupervisory employees
on private nonfarm payrolls decreased by 0.1 hour to 33.6 hours. (See tables B-2 and B-7.)

In July, average hourly earnings for all employees on private nonfarm payrolls edged down by 2 cents
to $23.98, following a 10-cent increase in June. Over the year, average hourly earnings have risen
by 44 cents, or 1.9 percent. In July, average hourly earnings of private-sector production and
nonsupervisory employees were unchanged at $20.14. (See tables B-3 and B-8.)

The change in total nonfarm payroll employment for May was revised from +195,000 to +176,000, and
the change for June was revised from +195,000 to +188,000. With these revisions, employment gains
in May and June combined were 26,000 less than previously reported.

_____________
The Employment Situation for August is scheduled to be released on Friday, September 6, 2013, at
8:30 a.m. (EDT).
HOUSEHOLD DATA
Summary table A. Household data, seasonally adjusted
[Numbers in thousands]
Category
July
2012
May
2013
June
2013
July
2013
Change from:
June
2013-
July
2013
Employment status
Civilian noninstitutional population
243,354
245,363
245,552
245,756
204
Civilian labor force
154,995
155,658
155,835
155,798
-37
Participation rate
63.7
63.4
63.5
63.4
-0.1
Employed
142,250
143,898
144,058
144,285
227
Employment-population ratio
58.5
58.6
58.7
58.7
0.0
Unemployed
12,745
11,760
11,777
11,514
-263
Unemployment rate
8.2
7.6
7.6
7.4
-0.2
Not in labor force
88,359
89,705
89,717
89,957
240
Unemployment rates
Total, 16 years and over
8.2
7.6
7.6
7.4
-0.2
Adult men (20 years and over)
7.7
7.2
7.0
7.0
0.0
Adult women (20 years and over)
7.5
6.5
6.8
6.5
-0.3
Teenagers (16 to 19 years)
23.9
24.5
24.0
23.7
-0.3
White
7.4
6.7
6.6
6.6
0.0
Black or African American
14.1
13.5
13.7
12.6
-1.1
Asian (not seasonally adjusted)
6.2
4.3
5.0
5.7
–
Hispanic or Latino ethnicity
10.3
9.1
9.1
9.4
0.3
Total, 25 years and over
6.9
6.1
6.2
6.1
-0.1
Less than a high school diploma
12.7
11.1
10.7
11.0
0.3
High school graduates, no college
8.6
7.4
7.6
7.6
0.0
Some college or associate degree
7.1
6.5
6.4
6.0
-0.4
Bachelor’s degree and higher
4.1
3.8
3.9
3.8
-0.1
Reason for unemployment
Job losers and persons who completed temporary jobs
7,106
6,147
6,119
5,921
-198
Job leavers
879
944
1,030
979
-51
Reentrants
3,374
3,333
3,291
3,258
-33
New entrants
1,299
1,268
1,259
1,254
-5
Duration of unemployment
Less than 5 weeks
2,697
2,706
2,692
2,563
-129
5 to 14 weeks
3,102
2,669
2,864
2,869
5
15 to 26 weeks
1,756
1,950
1,896
1,788
-108
27 weeks and over
5,167
4,357
4,328
4,246
-82
Employed persons at work part time
Part time for economic reasons
8,245
7,904
8,226
8,245
19
Slack work or business conditions
5,319
4,841
5,193
5,177
-16
Could only find part-time work
2,568
2,721
2,652
2,665
13
Part time for noneconomic reasons
18,846
18,934
19,044
19,128
84
Persons not in the labor force (not seasonally adjusted)
Marginally attached to the labor force
2,529
2,164
2,582
2,414
–
Discouraged workers
852
780
1,027
988
–
– Over-the-month changes are not displayed for not seasonally adjusted data.
NOTE: Persons whose ethnicity is identified as Hispanic or Latino may be of any race. Detail for the seasonally adjusted data shown in this table will not necessarily add to totals because of the independent seasonal adjustment of the various series. Updated population controls are introduced annually with the release of January data.
ESTABLISHMENT DATA
Summary table B. Establishment data, seasonally adjusted
Footnotes (1) Includes other industries, not shown separately. (2) Data relate to production employees in mining and logging and manufacturing, construction employees in construction, and nonsupervisory employees in the service-providing industries. (3) The indexes of aggregate weekly hours are calculated by dividing the current month’s estimates of aggregate hours by the corresponding annual average aggregate hours. (4) The indexes of aggregate weekly payrolls are calculated by dividing the current month’s estimates of aggregate weekly payrolls by the corresponding annual average aggregate weekly payrolls. (5) Figures are the percent of industries with employment increasing plus one-half of the industries with unchanged employment, where 50 percent indicates an equal balance between industries with increasing and decreasing employment. (p) Preliminary
Frequently Asked Questions about Employment and Unemployment Estimates

1. Why are there two monthly measures of employment?

   The household survey and establishment survey both produce sample-based estimates
   of   employment, and both have strengths and limitations. The establishment survey
   employment series has a   smaller margin of error on the measurement of month-to-
   month change   than the household survey because of its much larger sample size. An
   over-the-month employment change of about 100,000 is statistically significant in
   the establishment survey, while the threshold for a statistically significant change
   in the household survey is about 400,000. However, the household survey has a more
   expansive scope than the establishment survey because it includes self-employed
   workers whose businesses are unincorporated, unpaid family workers, agricultural
   workers, and private household workers, who are excluded by the establishment survey.
   The household survey also provides estimates of employment for demographic groups.
   For more information on the differences between the two surveys, please visit
   www.bls.gov/web/empsit/ces_cps_trends.pdf.

2. Are undocumented immigrants counted in the surveys?

   It is likely that both surveys include at least some undocumented immigrants. However,
   neither the establishment nor the household survey is designed to identify the legal
   status of workers. Therefore, it is not possible to determine how many are counted in
   either survey. The establishment survey does not collect data on the legal status of
   workers. The household survey does include questions which identify the foreign and
   native born, but it does not include questions about the legal status of the foreign
   born. Data on the foreign and native born are published each month in table A-7 of
   The Employment Situation news release.

3. Why does the establishment survey have revisions?

   The establishment survey revises published estimates to improve its data series by
   incorporating additional information that was not available at the time of the
   initial publication of the estimates. The establishment survey revises its initial
   monthly estimates twice, in the immediately succeeding 2 months, to incorporate
   additional sample receipts from respondents in the survey and recalculated seasonal
   adjustment factors. For more information on the monthly revisions, please visit
   www.bls.gov/ces/cesrevinfo.htm.

   On an annual basis, the establishment survey incorporates a benchmark revision that
   re-anchors estimates to nearly complete employment counts available from unemployment
   insurance tax records. The benchmark helps to control for sampling and modeling errors
   in the estimates. For more information on the annual benchmark revision, please visit
   www.bls.gov/web/empsit/cesbmart.htm.

4. Does the establishment survey sample include small firms?

   Yes; about 40 percent of the establishment survey sample is comprised of business
   establishments with fewer than 20 employees. The establishment survey sample is
   designed to maximize the reliability of the statewide total nonfarm employment
   estimate; firms from all states, size classes, and industries are appropriately
   sampled to achieve that goal.

5. Does the establishment survey account for employment from new businesses?

   Yes; monthly establishment survey estimates include an adjustment to account for
   the net employment change generated by business births and deaths. The adjustment
   comes from an econometric model that forecasts the monthly net jobs impact of
   business births and deaths based on the actual past values of the net impact that
   can be observed with a lag from the Quarterly Census of Employment and Wages. The
   establishment survey uses modeling rather than sampling for this purpose because
   the survey is not immediately able to bring new businesses into the sample. There
   is an unavoidable lag between the birth of a new firm and its appearance on the
   sampling frame and availability for selection. BLS adds new businesses to the survey
   twice a year.

6. Is the count of unemployed persons limited to just those people receiving unemployment
   insurance benefits?

   No; the estimate of unemployment is based on a monthly sample survey of households.
   All persons who are without jobs and are actively seeking and available to work are
   included among the unemployed. (People on temporary layoff are included even if
   they do not actively seek work.) There is no requirement or question relating to
   unemployment insurance benefits in the monthly survey.

7. Does the official unemployment rate exclude people who want a job but are not currently
   looking for work?

   Yes; however, there are separate estimates of persons outside the labor force who
   want a job, including those who are not currently looking because they believe no
   jobs are available (discouraged workers). In addition, alternative measures of labor
   underutilization (some of which include discouraged workers and other groups not
   officially counted as unemployed) are published each month in table A-15 of The
   Employment Situation news release. For more information about these alternative
   measures, please visit www.bls.gov/cps/lfcharacteristics.htm#altmeasures.

8. How can unusually severe weather affect employment and hours estimates?

   In the establishment survey, the reference period is the pay period that includes
   the 12th of the month. Unusually severe weather is more likely to have an impact on
   average weekly hours than on employment. Average weekly hours are estimated for paid
   time during the pay period, including pay for holidays, sick leave, or other time off.
   The impact of severe weather on hours estimates typically, but not always, results in
   a reduction in average weekly hours. For example, some employees may be off work for
   part of the pay period and not receive pay for the time missed, while some workers,
   such as those dealing with cleanup or repair, may work extra hours.

   In order for severe weather conditions to reduce the estimate of payroll employment,
   employees have to be off work without pay for the entire pay period. Slightly more
   than 20 percent of all employees in the payroll survey sample have a weekly pay
   period. Employees who receive pay for any part of the pay period, even 1 hour, are
   counted in the payroll employment figures. It is not possible to quantify the effect
   of extreme weather on estimates of over-the-month change in employment.

   In the household survey, the reference period is generally the calendar week that
   includes the 12th of the month. Persons who miss the entire week's work for weather-
   related events are counted as employed whether or not they are paid for the time
   off. The household survey collects data on the number of persons who had a job but
   were not at work due to bad weather. It also provides a measure of the number of
   persons who usually work full time but had reduced hours. Current and historical
   data are available on the  household survey's most requested statistics page at
   http://data.bls.gov/cgi-bin/surveymost?ln.
Technical Note

   This news release presents statistics from two major surveys, the Current
Population Survey (CPS; household survey) and the Current Employment Statistics
survey (CES; establishment survey). The household survey provides information
on the labor force, employment, and unemployment that appears in the "A" tables,
marked HOUSEHOLD DATA. It is a sample survey of about 60,000 eligible households
conducted by the U.S. Census Bureau for the U.S. Bureau of Labor Statistics (BLS).

   The establishment survey provides information on employment, hours, and
earnings of employees on nonfarm payrolls; the data appear in the "B" tables,
marked ESTABLISHMENT DATA. BLS collects these data each month from the payroll
records of a sample of nonagricultural business establishments. Each month
the CES program surveys about 145,000 businesses and government agencies,
representing approximately 557,000 individual worksites, in order to provide
detailed industry data on employment, hours, and earnings of workers on nonfarm
payrolls. The active sample includes approximately one-third of all nonfarm
payroll employees.

   For both surveys, the data for a given month relate to a particular week or
pay period. In the household survey, the reference period is generally the
calendar week that contains the 12th day of the month. In the establishment
survey, the reference period is the pay period including the 12th, which may or
may not correspond directly to the calendar week.

Coverage, definitions, and differences between surveys

   Household survey. The sample is selected to reflect the entire civilian
noninstitutional population. Based on responses to a series of questions on
work and job search activities, each person 16 years and over in a sample
household is classified as employed, unemployed, or not in the labor force.

   People are classified as employed if they did any work at all as paid employees
during the reference week; worked in their own business, profession, or on their
own farm; or worked without pay at least 15 hours in a family business or farm.
People are also counted as employed if they were temporarily absent from their jobs
because of illness, bad weather, vacation, labor-management disputes, or personal
reasons.

   People are classified as unemployed if they meet all of the following criteria:
they had no employment during the reference week; they were available for work at
that time; and they made specific efforts to find employment sometime during the
4-week period ending with the reference week. Persons laid off from a job and
expecting recall need not be looking for work to be counted as unemployed. The
unemployment data derived from the household survey in no way depend upon the
eligibility for or receipt of unemployment insurance benefits.

   The civilian labor force is the sum of employed and unemployed persons.
Those persons not classified as employed or unemployed are not in the labor
force. The unemployment rate is the number unemployed as a percent of the
labor force. The labor force participation rate is the labor force as a
percent of the population, and the employment-population ratio is the
employed as a percent of the population. Additional information about the
household survey can be found at www.bls.gov/cps/documentation.htm.

   Establishment survey. The sample establishments are drawn from private
nonfarm businesses such as factories, offices, and stores, as well as
from federal, state, and local government entities. Employees on nonfarm
payrolls are those who received pay for any part of the reference pay
period, including persons on paid leave. Persons are counted in each job
they hold. Hours and earnings data are produced for the private sector for
all employees and for production and nonsupervisory employees. Production
and nonsupervisory employees are defined as production and related employees
in manufacturing and mining and logging, construction workers in construction,
and nonsupervisory employees in private service-providing industries.

   Industries are classified on the basis of an establishment’s principal
activity in accordance with the 2012 version of the North American Industry
Classification System. Additional information about the establishment survey
can be found at www.bls.gov/ces/.

   Differences in employment estimates. The numerous conceptual and methodological
differences between the household and establishment  surveys result in important
distinctions in the employment estimates derived from the surveys. Among these are:

   --The household survey includes agricultural workers, self-employed workers
     whose businesses are unincorporated, unpaid family workers, and private
     household workers among the employed. These groups are excluded from the
     establishment survey.

   --The household survey includes people on unpaid leave among the employed.
     The establishment survey does not.

   --The household survey is limited to workers 16 years of age and older.
     The establishment survey is not limited by age.

   --The household survey has no duplication of individuals, because
     individuals are counted only once, even if they hold more than one
     job. In the establishment survey, employees working at more than one
     job and thus appearing on more than one payroll are counted separately
     for each appearance.

Seasonal adjustment

   Over the course of a year, the size of the nation's labor force and the levels
of employment and unemployment undergo regularly occurring fluctuations. These
events may result from seasonal changes in weather, major holidays, and the opening
and closing of schools. The effect of such seasonal variation can be very large.

   Because these seasonal events follow a more or less regular pattern each year,
their influence on the level of a series can be tempered by adjusting for regular
seasonal variation. These adjustments make nonseasonal developments, such as
declines in employment or increases in the participation of women in the labor
force, easier to spot. For example, in the household survey, the large number of
youth entering the labor force each June is likely to obscure any other changes
that have taken place relative to May, making it difficult to determine if the
level of economic activity has risen or declined. Similarly, in the establishment
survey, payroll employment in education declines by about 20 percent at the end
of the spring term and later rises with the start of the fall term, obscuring the
underlying employment trends in the industry. Because seasonal employment changes
at the end and beginning of the school year can be estimated, the statistics can be
adjusted to make underlying employment patterns more discernable.  The seasonally
adjusted figures provide a more useful tool with which to analyze changes in
month-to-month economic activity.

   Many seasonally adjusted series are independently adjusted in both the household
and establishment surveys. However, the adjusted series for many major estimates,
such as total payroll employment, employment in most major sectors, total employment,
and unemployment are computed by aggregating independently adjusted component series.
For example, total unemployment is derived by summing the adjusted series for four
major age-sex components; this differs from the unemployment estimate that would be
obtained by directly adjusting the total or by combining
the duration, reasons, or more detailed age categories.

   For both the household and establishment surveys, a concurrent seasonal adjustment
methodology is used in which new seasonal factors are calculated each month using all
relevant data, up to and including the data for the current month. In the household
survey, new seasonal factors are used to adjust only the current month's data. In the
establishment survey, however, new seasonal factors are used each month to adjust the
three most recent monthly estimates. The prior 2 months are routinely revised to
incorporate additional sample reports and recalculated seasonal adjustment factors.
In both surveys, 5-year revisions to historical data are made once a year.

Reliability of the estimates

   Statistics based on the household and establishment surveys are subject to both
sampling and nonsampling error. When a sample, rather than the entire population,
is surveyed, there is a chance that the sample estimates may differ from the true
population values they represent. The component of this difference that occurs
because samples differ by chance is known as sampling error, and its variability
is measured by the standard error of the estimate. There is about a 90-percent
chance, or level of confidence, that an estimate based on a sample will differ by
no more than 1.6 standard errors from the true population value because of sampling
error. BLS analyses are generally conducted at the 90-percent level of confidence.

   For example, the confidence interval for the monthly change in total nonfarm
employment from the establishment survey is on the order of plus or minus 90,000.
Suppose the estimate of nonfarm employment increases by 50,000 from one month to
the next. The 90-percent confidence interval on the monthly change would range from
-40,000 to +140,000 (50,000 +/- 90,000). These figures do not mean that the sample
results are off by these magnitudes, but rather that there is about a 90-percent
chance that the true over-the-month change lies within this interval. Since this
range includes values of less than zero, we could not say with confidence that
nonfarm employment had, in fact, increased that month. If, however, the reported
nonfarm employment rise was 250,000, then all of the values within the 90- percent
confidence interval would be greater than zero. In this case, it is likely (at
least a 90-percent chance) that nonfarm employment had, in fact, risen that month.
At an unemployment rate of around 6.0 percent, the 90-percent confidence interval
for the monthly change in unemployment as measured by the household survey is
about +/- 300,000, and for the monthly change in the unemployment rate it is about
+/- 0.2 percentage point.

   In general, estimates involving many individuals or establishments have lower
standard errors (relative to the size of the estimate) than estimates which are based
on a small number of observations. The precision of estimates also is improved when
the data are cumulated over time, such as for quarterly and annual averages.

   The household and establishment surveys are also affected by nonsampling error,
which can occur for many reasons, including the failure to sample a segment of the
population, inability to obtain information for all respondents in the sample,
inability or unwillingness of respondents to provide correct information on a
timely basis, mistakes made by respondents, and errors made in the collection or
processing of the data.

   For example, in the establishment survey, estimates for the most recent 2 months
are based on incomplete returns; for this reason, these estimates are labeled
preliminary in the tables. It is only after two successive revisions to a monthly
estimate, when nearly all sample reports have been received, that the estimate is
considered final.

   Another major source of nonsampling error in the establishment survey is the
inability to capture, on a timely basis, employment generated by new firms. To
correct for this systematic underestimation of employment growth, an estimation
procedure with two components is used to account for business births. The first
component excludes employment losses from business deaths from sample-based
estimation in order to offset the missing employment gains from business births.
This is incorporated into the sample-based estimation procedure by simply not
reflecting sample units going out of business, but imputing to them the same
employment trend as the other firms in the sample. This procedure accounts for
most of the net birth/death employment.

   The second component is an ARIMA time series model designed to estimate the
residual net birth/death employment not accounted for by the imputation. The
historical time series used to create and test the ARIMA model was derived from
the unemployment insurance universe micro- level database, and reflects the actual
residual net of births and deaths over the past 5 years.

   The sample-based estimates from the establishment survey are adjusted once a
year (on a lagged basis) to universe counts of payroll employment obtained from
administrative records of the unemployment insurance program. The difference
between the March sample-based employment estimates and the March universe counts
is known as a benchmark revision, and serves as a rough proxy for total survey
error. The new benchmarks also incorporate changes in the classification of
industries. Over the past decade, absolute benchmark revisions for total nonfarm
employment have averaged 0.3 percent, with a range from -0.7 to 0.6 percent.

Other information

   Information in this release will be made available to sensory impaired
individuals upon request. Voice phone: (202) 691-5200; Federal Relay
Service: (800) 877-8339.
HOUSEHOLD DATA
Table A-1. Employment status of the civilian population by sex and age
Footnotes (1) The population figures are not adjusted for seasonal variation; therefore, identical numbers appear in the unadjusted and seasonally adjusted columns.
NOTE: Updated population controls are introduced annually with the release of January data.
HOUSEHOLD DATA
Table A-2. Employment status of the civilian population by race, sex, and age
Footnotes (1) The population figures are not adjusted for seasonal variation; therefore, identical numbers appear in the unadjusted and seasonally adjusted columns.
– Data not available.
NOTE: Estimates for the above race groups will not sum to totals shown in table A-1 because data are not presented for all races. Updated population controls are introduced annually with the release of January data.
HOUSEHOLD DATA
Table A-3. Employment status of the Hispanic or Latino population by sex and age
Footnotes (1) The population figures are not adjusted for seasonal variation; therefore, identical numbers appear in the unadjusted and seasonally adjusted columns.
– Data not available.
NOTE: Persons whose ethnicity is identified as Hispanic or Latino may be of any race. Updated population controls are introduced annually with the release of January data.
HOUSEHOLD DATA
Table A-4. Employment status of the civilian population 25 years and over by educational attainment
Footnotes (1) Includes persons with a high school diploma or equivalent. (2) Includes persons with bachelor’s, master’s, professional, and doctoral degrees.
NOTE: Updated population controls are introduced annually with the release of January data.
HOUSEHOLD DATA
Table A-5. Employment status of the civilian population 18 years and over by veteran status, period of service, and sex, not seasonally adjusted
[Numbers in thousands]
Employment status, veteran status, and period of service
Total
Men
Women
July
2012
July
2013
July
2012
July
2013
July
2012
July
2013
VETERANS, 18 years and over
Civilian noninstitutional population
21,163
21,384
19,349
19,159
1,814
2,225
Civilian labor force
10,925
10,923
9,845
9,529
1,080
1,395
Participation rate
51.6
51.1
50.9
49.7
59.5
62.7
Employed
10,173
10,221
9,171
8,918
1,002
1,303
Employment-population ratio
48.1
47.8
47.4
46.5
55.2
58.6
Unemployed
752
702
674
610
79
92
Unemployment rate
6.9
6.4
6.8
6.4
7.3
6.6
Not in labor force
10,238
10,461
9,504
9,630
734
830
Gulf War-era II veterans
Civilian noninstitutional population
2,453
2,728
2,056
2,197
397
530
Civilian labor force
1,945
2,155
1,683
1,800
263
355
Participation rate
79.3
79.0
81.9
81.9
66.1
67.0
Employed
1,771
1,989
1,524
1,661
247
328
Employment-population ratio
72.2
72.9
74.2
75.6
62.2
61.8
Unemployed
174
166
159
138
15
27
Unemployment rate
8.9
7.7
9.4
7.7
5.9
7.7
Not in labor force
507
573
373
397
135
175
Gulf War-era I veterans
Civilian noninstitutional population
3,158
3,291
2,668
2,664
489
627
Civilian labor force
2,599
2,713
2,237
2,208
361
504
Participation rate
82.3
82.4
83.8
82.9
73.8
80.5
Employed
2,428
2,572
2,098
2,093
330
479
Employment-population ratio
76.9
78.1
78.6
78.6
67.5
76.4
Unemployed
170
141
139
115
31
26
Unemployment rate
6.5
5.2
6.2
5.2
8.5
5.1
Not in labor force
559
578
431
456
128
122
World War II, Korean War, and Vietnam-era veterans
Civilian noninstitutional population
9,868
9,789
9,551
9,421
318
368
Civilian labor force
3,217
2,922
3,125
2,835
92
87
Participation rate
32.6
29.9
32.7
30.1
29.1
23.7
Employed
3,020
2,727
2,932
2,644
88
84
Employment-population ratio
30.6
27.9
30.7
28.1
27.7
22.7
Unemployed
197
195
193
192
4
4
Unemployment rate
6.1
6.7
6.2
6.8
4.6
4.0
Not in labor force
6,652
6,867
6,426
6,586
225
281
Veterans of other service periods
Civilian noninstitutional population
5,684
5,576
5,074
4,876
610
700
Civilian labor force
3,164
3,133
2,800
2,685
364
448
Participation rate
55.7
56.2
55.2
55.1
59.7
64.0
Employed
2,953
2,933
2,617
2,520
336
413
Employment-population ratio
52.0
52.6
51.6
51.7
55.1
58.9
Unemployed
211
200
183
165
28
36
Unemployment rate
6.7
6.4
6.5
6.1
7.7
7.9
Not in labor force
2,520
2,443
2,274
2,191
246
252
NONVETERANS, 18 years and over
Civilian noninstitutional population
213,366
215,592
93,604
94,951
119,762
120,641
Civilian labor force
142,848
143,519
72,405
73,049
70,443
70,470
Participation rate
66.9
66.6
77.4
76.9
58.8
58.4
Employed
130,997
133,021
66,608
67,722
64,389
65,299
Employment-population ratio
61.4
61.7
71.2
71.3
53.8
54.1
Unemployed
11,850
10,498
5,797
5,327
6,054
5,171
Unemployment rate
8.3
7.3
8.0
7.3
8.6
7.3
Not in labor force
70,518
72,072
21,199
21,902
49,319
50,171
NOTE: Veterans served on active duty in the U.S. Armed Forces and were not on active duty at the time of the survey. Nonveterans never served on active duty in the U.S. Armed Forces. Veterans could have served anywhere in the world during these periods of service: Gulf War era II (September 2001-present), Gulf War era I (August 1990-August 2001), Vietnam era (August 1964-April 1975), Korean War (July 1950-January 1955), World War II (December 1941-December 1946), and other service periods (all other time periods). Veterans who served in more than one wartime period are classified only in the most recent one. Veterans who served during one of the selected wartime periods and another period are classified only in the wartime period. Beginning with data for January 2013, estimates for veterans incorporate population controls derived from the updated Department of Veterans Affairs’ population model.
HOUSEHOLD DATA
Table A-6. Employment status of the civilian population by sex, age, and disability status, not seasonally adjusted
[Numbers in thousands]
Employment status, sex, and age
Persons with a disability
Persons with no disability
July
2012
July
2013
July
2012
July
2013
TOTAL, 16 years and over
Civilian noninstitutional population
28,007
28,406
215,346
217,349
Civilian labor force
5,791
5,778
150,735
151,418
Participation rate
20.7
20.3
70.0
69.7
Employed
5,004
4,926
138,122
140,186
Employment-population ratio
17.9
17.3
64.1
64.5
Unemployed
787
852
12,613
11,231
Unemployment rate
13.6
14.7
8.4
7.4
Not in labor force
22,216
22,628
64,611
65,932
Men, 16 to 64 years
Civilian labor force
2,612
2,638
76,636
76,858
Participation rate
34.4
35.3
83.9
83.6
Employed
2,289
2,240
70,401
71,084
Employment-population ratio
30.2
30.0
77.0
77.3
Unemployed
323
398
6,235
5,774
Unemployment rate
12.4
15.1
8.1
7.5
Not in labor force
4,971
4,841
14,742
15,073
Women, 16 to 64 years
Civilian labor force
2,207
2,188
67,470
67,576
Participation rate
28.7
28.3
71.2
71.0
Employed
1,817
1,778
61,567
62,468
Employment-population ratio
23.6
23.0
64.9
65.7
Unemployed
390
410
5,903
5,108
Unemployment rate
17.7
18.7
8.7
7.6
Not in labor force
5,487
5,556
27,352
27,574
Both sexes, 65 years and over
Civilian labor force
973
953
6,629
6,984
Participation rate
7.6
7.2
22.7
23.1
Employed
898
908
6,155
6,634
Employment-population ratio
7.1
6.9
21.1
21.9
Unemployed
74
44
474
350
Unemployment rate
7.6
4.7
7.2
5.0
Not in labor force
11,758
12,232
22,517
23,285
NOTE: A person with a disability has at least one of the following conditions: is deaf or has serious difficulty hearing; is blind or has serious difficulty seeing even when wearing glasses; has serious difficulty concentrating, remembering, or making decisions because of a physical, mental, or emotional condition; has serious difficulty walking or climbing stairs; has difficulty dressing or bathing; or has difficulty doing errands alone such as visiting a doctor’s office or shopping because of a physical, mental, or emotional condition. Updated population controls are introduced annually with the release of January data.
HOUSEHOLD DATA
Table A-7. Employment status of the civilian population by nativity and sex, not seasonally adjusted
[Numbers in thousands]
Employment status and nativity
Total
Men
Women
July
2012
July
2013
July
2012
July
2013
July
2012
July
2013
Foreign born, 16 years and over
Civilian noninstitutional population
37,627
37,941
18,428
18,391
19,199
19,550
Civilian labor force
25,180
25,382
14,575
14,634
10,606
10,748
Participation rate
66.9
66.9
79.1
79.6
55.2
55.0
Employed
23,211
23,689
13,553
13,767
9,657
9,922
Employment-population ratio
61.7
62.4
73.5
74.9
50.3
50.8
Unemployed
1,970
1,693
1,021
867
948
825
Unemployment rate
7.8
6.7
7.0
5.9
8.9
7.7
Not in labor force
12,446
12,559
3,853
3,757
8,593
8,802
Native born, 16 years and over
Civilian noninstitutional population
205,727
207,815
98,954
100,204
106,774
107,611
Civilian labor force
131,346
131,814
68,979
69,331
62,367
62,483
Participation rate
63.8
63.4
69.7
69.2
58.4
58.1
Employed
119,916
121,424
63,137
63,803
56,778
57,621
Employment-population ratio
58.3
58.4
63.8
63.7
53.2
53.5
Unemployed
11,430
10,390
5,842
5,528
5,589
4,862
Unemployment rate
8.7
7.9
8.5
8.0
9.0
7.8
Not in labor force
74,381
76,001
29,975
30,873
44,407
45,128
NOTE: The foreign born are those residing in the United States who were not U.S. citizens at birth. That is, they were born outside the United States or one of its outlying areas such as Puerto Rico or Guam, to parents neither of whom was a U.S. citizen. The native born are persons who were born in the United States or one of its outlying areas such as Puerto Rico or Guam or who were born abroad of at least one parent who was a U.S. citizen. Updated population controls are introduced annually with the release of January data.
HOUSEHOLD DATA
Table A-8. Employed persons by class of worker and part-time status
Footnotes (1) Includes self-employed workers whose businesses are incorporated. (2) Refers to those who worked 1 to 34 hours during the survey reference week and excludes employed persons who were absent from their jobs for the entire week. (3) Refers to those who worked 1 to 34 hours during the reference week for an economic reason such as slack work or unfavorable business conditions, inability to find full-time work, or seasonal declines in demand. (4) Refers to persons who usually work part time for noneconomic reasons such as childcare problems, family or personal obligations, school or training, retirement or Social Security limits on earnings, and other reasons. This excludes persons who usually work full time but worked only 1 to 34 hours during the reference week for reasons such as vacations, holidays, illness, and bad weather.
– Data not available.
NOTE: Detail for the seasonally adjusted data shown in this table will not necessarily add to totals because of the independent seasonal adjustment of the various series. Updated population controls are introduced annually with the release of January data.
HOUSEHOLD DATA
Table A-9. Selected employment indicators
Footnotes (1) Employed full-time workers are persons who usually work 35 hours or more per week. (2) Employed part-time workers are persons who usually work less than 35 hours per week.
– Data not available.
NOTE: Detail for the seasonally adjusted data shown in this table will not necessarily add to totals because of the independent seasonal adjustment of the various series. Updated population controls are introduced annually with the release of January data.
HOUSEHOLD DATA
Table A-10. Selected unemployment indicators, seasonally adjusted
Footnotes (1) Not seasonally adjusted. (2) Full-time workers are unemployed persons who have expressed a desire to work full time (35 hours or more per week) or are on layoff from full-time jobs. (3) Part-time workers are unemployed persons who have expressed a desire to work part time (less than 35 hours per week) or are on layoff from part-time jobs.
NOTE: Detail for the seasonally adjusted data shown in this table will not necessarily add to totals because of the independent seasonal adjustment of the various series. Updated population controls are introduced annually with the release of January data.
HOUSEHOLD DATA
Table A-11. Unemployed persons by reason for unemployment
[Numbers in thousands]
Reason
Not seasonally adjusted
Seasonally adjusted
July
2012
June
2013
July
2013
July
2012
Mar.
2013
Apr.
2013
May
2013
June
2013
July
2013
NUMBER OF UNEMPLOYED
Job losers and persons who completed temporary jobs
7,151
5,939
5,934
7,106
6,329
6,410
6,147
6,119
5,921
On temporary layoff
1,525
1,139
1,337
1,429
1,107
1,170
997
1,199
1,221
Not on temporary layoff
5,626
4,800
4,597
5,677
5,223
5,240
5,151
4,920
4,700
Permanent job losers
4,377
3,639
3,548
4,368
3,959
3,976
3,822
3,700
3,589
Persons who completed temporary jobs
1,248
1,161
1,049
1,308
1,264
1,264
1,329
1,220
1,111
Job leavers
897
981
996
879
986
864
944
1,030
979
Reentrants
3,579
3,600
3,450
3,374
3,176
3,151
3,333
3,291
3,258
New entrants
1,773
1,728
1,703
1,299
1,316
1,280
1,268
1,259
1,254
PERCENT DISTRIBUTION
Job losers and persons who completed temporary jobs
53.4
48.5
49.1
56.1
53.6
54.8
52.6
52.3
51.9
On temporary layoff
11.4
9.3
11.1
11.3
9.4
10.0
8.5
10.2
10.7
Not on temporary layoff
42.0
39.2
38.0
44.8
44.2
44.8
44.1
42.1
41.2
Job leavers
6.7
8.0
8.2
6.9
8.4
7.4
8.1
8.8
8.6
Reentrants
26.7
29.4
28.6
26.7
26.9
26.9
28.5
28.1
28.5
New entrants
13.2
14.1
14.1
10.3
11.1
10.9
10.8
10.8
11.0
UNEMPLOYED AS A PERCENT OF THE
CIVILIAN LABOR FORCE
Job losers and persons who completed temporary jobs
4.6
3.8
3.8
4.6
4.1
4.1
3.9
3.9
3.8
Job leavers
0.6
0.6
0.6
0.6
0.6
0.6
0.6
0.7
0.6
Reentrants
2.3
2.3
2.2
2.2
2.0
2.0
2.1
2.1
2.1
New entrants
1.1
1.1
1.1
0.8
0.8
0.8
0.8
0.8
0.8
NOTE: Updated population controls are introduced annually with the release of January data.
HOUSEHOLD DATA
Table A-12. Unemployed persons by duration of unemployment
[Numbers in thousands]
Duration
Not seasonally adjusted
Seasonally adjusted
July
2012
June
2013
July
2013
July
2012
Mar.
2013
Apr.
2013
May
2013
June
2013
July
2013
NUMBER OF UNEMPLOYED
Less than 5 weeks
3,021
3,569
2,842
2,697
2,464
2,474
2,706
2,692
2,563
5 to 14 weeks
3,585
2,592
3,348
3,102
2,838
2,848
2,669
2,864
2,869
15 weeks and over
6,794
6,086
5,892
6,923
6,348
6,320
6,306
6,225
6,034
15 to 26 weeks
1,547
1,841
1,570
1,756
1,737
1,967
1,950
1,896
1,788
27 weeks and over
5,247
4,245
4,322
5,167
4,611
4,353
4,357
4,328
4,246
Average (mean) duration, in weeks
37.4
34.1
35.3
38.8
37.1
36.5
36.9
35.6
36.6
Median duration, in weeks
15.2
14.3
13.8
16.8
18.1
17.5
17.3
16.3
15.7
PERCENT DISTRIBUTION
Less than 5 weeks
22.5
29.1
23.5
21.2
21.1
21.3
23.2
22.9
22.4
5 to 14 weeks
26.8
21.2
27.7
24.4
24.4
24.5
22.8
24.3
25.0
15 weeks and over
50.7
49.7
48.8
54.4
54.5
54.3
54.0
52.8
52.6
15 to 26 weeks
11.5
15.0
13.0
13.8
14.9
16.9
16.7
16.1
15.6
27 weeks and over
39.2
34.7
35.8
40.6
39.6
37.4
37.3
36.7
37.0
NOTE: Updated population controls are introduced annually with the release of January data.
HOUSEHOLD DATA
Table A-13. Employed and unemployed persons by occupation, not seasonally adjusted
Agriculture and related private wage and salary workers
131
97
7.9
6.5
Government workers
1,182
1,073
5.7
5.3
Self-employed workers, unincorporated, and unpaid family workers
623
528
5.9
5.0
Footnotes (1) Persons with no previous work experience and persons whose last job was in the U.S. Armed Forces are included in the unemployed total.
NOTE: Updated population controls are introduced annually with the release of January data.
HOUSEHOLD DATA
Table A-15. Alternative measures of labor underutilization
[Percent]
Measure
Not seasonally adjusted
Seasonally adjusted
July
2012
June
2013
July
2013
July
2012
Mar.
2013
Apr.
2013
May
2013
June
2013
July
2013
U-1 Persons unemployed 15 weeks or longer, as a percent of the civilian labor force
4.3
3.9
3.7
4.5
4.1
4.1
4.1
4.0
3.9
U-2 Job losers and persons who completed temporary jobs, as a percent of the civilian labor force
4.6
3.8
3.8
4.6
4.1
4.1
3.9
3.9
3.8
U-3 Total unemployed, as a percent of the civilian labor force (official unemployment rate)
8.6
7.8
7.7
8.2
7.6
7.5
7.6
7.6
7.4
U-4 Total unemployed plus discouraged workers, as a percent of the civilian labor force plus discouraged workers
9.1
8.4
8.3
8.7
8.1
8.0
8.0
8.2
8.0
U-5 Total unemployed, plus discouraged workers, plus all other persons marginally attached to the labor force, as a percent of the civilian labor force plus all persons marginally attached to the labor force
10.0
9.3
9.1
9.7
8.9
8.9
8.8
9.1
8.8
U-6 Total unemployed, plus all persons marginally attached to the labor force, plus total employed part time for economic reasons, as a percent of the civilian labor force plus all persons marginally attached to the labor force
15.2
14.6
14.3
14.9
13.8
13.9
13.8
14.3
14.0
NOTE: Persons marginally attached to the labor force are those who currently are neither working nor looking for work but indicate that they want and are available for a job and have looked for work sometime in the past 12 months. Discouraged workers, a subset of the marginally attached, have given a job-market related reason for not currently looking for work. Persons employed part time for economic reasons are those who want and are available for full-time work but have had to settle for a part-time schedule. Updated population controls are introduced annually with the release of January data.
HOUSEHOLD DATA
Table A-16. Persons not in the labor force and multiple jobholders by sex, not seasonally adjusted
Footnotes (1) Data refer to persons who want a job, have searched for work during the prior 12 months, and were available to take a job during the reference week, but had not looked for work in the past 4 weeks. (2) Includes those who did not actively look for work in the prior 4 weeks for reasons such as thinks no work available, could not find work, lacks schooling or training, employer thinks too young or old, and other types of discrimination. (3) Includes those who did not actively look for work in the prior 4 weeks for such reasons as school or family responsibilities, ill health, and transportation problems, as well as a number for whom reason for nonparticipation was not determined. (4) Includes a small number of persons who work part time on their primary job and full time on their secondary job(s), not shown separately.
NOTE: Updated population controls are introduced annually with the release of January data.
ESTABLISHMENT DATA
Table B-1. Employees on nonfarm payrolls by industry sector and selected industry detail
Museums, historical sites, and similar institutions
148.4
141.8
147.3
147.7
133.5
136.5
135.3
134.0
-1.3
Amusements, gambling, and recreation
1,693.2
1,506.3
1,704.6
1,747.7
1,427.3
1,462.7
1,481.8
1,477.0
-4.8
Accommodation and food services
12,119.3
12,272.3
12,480.8
12,521.2
11,782.3
12,103.9
12,142.5
12,175.6
33.1
Accommodation
1,965.7
1,835.8
1,932.7
1,979.8
1,815.7
1,829.9
1,833.5
1,828.2
-5.3
Food services and drinking places
10,153.6
10,436.5
10,548.1
10,541.4
9,966.6
10,274.0
10,309.0
10,347.4
38.4
Other services
5,507
5,507
5,549
5,549
5,439
5,486
5,483
5,481
-2
Repair and maintenance
1,199.6
1,207.1
1,203.6
1,201.7
1,192.8
1,201.3
1,195.7
1,195.0
-0.7
Personal and laundry services
1,322.7
1,346.7
1,350.7
1,343.5
1,313.2
1,332.4
1,334.1
1,334.5
0.4
Membership associations and organizations
2,985.1
2,953.2
2,994.4
3,003.6
2,933.1
2,952.2
2,952.7
2,951.1
-1.6
Government
20,622
22,242
21,802
20,583
21,891
21,859
21,851
21,852
1
Federal
2,826.0
2,757.0
2,761.0
2,761.0
2,805.0
2,758.0
2,748.0
2,746.0
-2.0
Federal, except U.S. Postal Service
2,213.2
2,168.2
2,171.9
2,170.0
2,194.6
2,166.1
2,156.4
2,157.2
0.8
U.S. Postal Service
612.9
589.0
589.1
591.0
610.0
592.0
591.6
588.6
-3.0
State government
4,740.0
5,070.0
4,802.0
4,716.0
5,042.0
5,037.0
5,028.0
5,025.0
-3.0
State government education
2,058.1
2,408.7
2,126.0
2,046.4
2,377.8
2,383.1
2,376.2
2,372.8
-3.4
State government, excluding education
2,682.3
2,661.7
2,676.1
2,669.6
2,664.4
2,653.7
2,651.9
2,652.3
0.4
Local government
13,056.0
14,415.0
14,239.0
13,106.0
14,044.0
14,064.0
14,075.0
14,081.0
6.0
Local government education
6,550.7
8,139.0
7,766.0
6,573.1
7,765.7
7,776.0
7,774.1
7,784.2
10.1
Local government, excluding education
6,505.3
6,275.5
6,473.3
6,533.1
6,278.3
6,287.9
6,301.0
6,297.0
-4.0
Footnotes (1) Includes other industries, not shown separately. (2) Includes motor vehicles, motor vehicle bodies and trailers, and motor vehicle parts. (3) Includes ambulatory health care services, hospitals, and nursing and residential care facilities. (p) Preliminary
ESTABLISHMENT DATA
Table B-2. Average weekly hours and overtime of all employees on private nonfarm payrolls by industry sector, seasonally adjusted
ESTABLISHMENT DATA
Table B-4. Indexes of aggregate weekly hours and payrolls for all employees on private nonfarm payrolls by industry sector, seasonally adjusted
Footnotes (1) The indexes of aggregate weekly hours are calculated by dividing the current month’s estimates of aggregate hours by the corresponding 2007 annual average aggregate hours. Aggregate hours estimates are the product of estimates of average weekly hours and employment. (2) The indexes of aggregate weekly payrolls are calculated by dividing the current month’s estimates of aggregate weekly payrolls by the corresponding 2007 annual average aggregate weekly payrolls. Aggregate payrolls estimates are the product of estimates of average hourly earnings, average weekly hours, and employment. (p) Preliminary
ESTABLISHMENT DATA
Table B-5. Employment of women on nonfarm payrolls by industry sector, seasonally adjusted
ESTABLISHMENT DATA
Table B-6. Employment of production and nonsupervisory employees on private nonfarm payrolls by industry sector, seasonally adjusted(1)
Footnotes (1) Data relate to production employees in mining and logging and manufacturing, construction employees in construction, and nonsupervisory employees in the service-providing industries. These groups account for approximately four-fifths of the total employment on private nonfarm payrolls. (p) Preliminary
ESTABLISHMENT DATA
Table B-7. Average weekly hours and overtime of production and nonsupervisory employees on private nonfarm payrolls by industry sector, seasonally adjusted(1)
Footnotes (1) Data relate to production employees in mining and logging and manufacturing, construction employees in construction, and nonsupervisory employees in the service-providing industries. These groups account for approximately four-fifths of the total employment on private nonfarm payrolls. (p) Preliminary
ESTABLISHMENT DATA
Table B-8. Average hourly and weekly earnings of production and nonsupervisory employees on private nonfarm payrolls by industry sector, seasonally adjusted(1)
Footnotes (1) Data relate to production employees in mining and logging and manufacturing, construction employees in construction, and nonsupervisory employees in the service-providing industries. These groups account for approximately four-fifths of the total employment on private nonfarm payrolls. (p) Preliminary
ESTABLISHMENT DATA
Table B-9. Indexes of aggregate weekly hours and payrolls for production and nonsupervisory employees on private nonfarm payrolls by industry sector, seasonally adjusted(1)
Footnotes (1) Data relate to production employees in mining and logging and manufacturing, construction employees in construction, and nonsupervisory employees in the service-providing industries. These groups account for approximately four-fifths of the total employment on private nonfarm payrolls. (2) The indexes of aggregate weekly hours are calculated by dividing the current month’s estimates of aggregate hours by the corresponding 2002 annual average aggregate hours. Aggregate hours estimates are the product of estimates of average weekly hours and employment. (3) The indexes of aggregate weekly payrolls are calculated by dividing the current month’s estimates of aggregate weekly payrolls by the corresponding 2002 annual average aggregate weekly payrolls. Aggregate payrolls estimates are the product of estimates of average hourly earnings, average weekly hours, and employment. (p) Preliminary
Series Id:           LNS14000006
Seasonally Adjusted
Series title:        (Seas) Unemployment Rate - Black or African American
Labor force status:  Unemployment rate
Type of data:        Percent or rate
Age:                 16 years and over
Race:                Black or African American
The number of Americans employed when Obama became President in January 2009 was 142,187,000.
The number of Americans employed in July 2012 was 142,220,000.
The net increase in number of Americans employed after 42 months of the Obama Presidency is 33,000!
The U.S. economy needs to create between 130,000 and 140,000 jobs per month to just keep up with population growth according to Commissioner Dr. Keith Hall of the Bureau of Labor Statistics.
Vice Chairman Brady Questions BLS Commissioner at JEC Hearing on the Employment Situation
Between 130,000 to 140,000 need to be created each month to keep up with population growth!
At a Joint Economic Committee Hearing on the Employment Situation, Representative Kevin Brady, Vice Chairman, questions Witness Dr. Keith Hall, Commissioner, Bureau of Labor Statistics about the effect of government spending on private sector job growth.
For the 42 months that Obama has been President, a minimum of 130,000 jobs per month times 42 months or 5,460,000 new jobs needed to be created to just keep up with population growth.
Instead only a net increase in the employment level of 33,000 new jobs was created during the last 42 months.
The U.S. economy and employment level peaked in November 2007 when the number of employed Americans was 146,595,000.
From November 2007 to January 2009, the economy lost 4,408,000 jobs (146,595,000 employed in November 2007 minus 142,187,000 employed in January 2009).
To keep up with population growth during this 14 month period the economy needed to produce another 1,820,000 in new jobs ( 14 months times 130,000 new jobs per month) from December 2007 through January 2009.
Barack Obama became President in January 2009.
For the U.S. economy to reach it previous peak employment level of 146,595,000 plus the growth in the labor force from November 2007 through July 2012, the U.S. economy would need to create a total of ( 5,460,000 + 1,820,000 + 4,408,000) or 11,668,000 new jobs for a total employment level of 153,855,000.
The current employment level is 142,220,000 as of the August 3, 2012 Bureau of Labor Statistics Employment Situation Survey.
Barack Obama’s economic policies have produced in 42 months a net increase of only 33,000 in the employment level or new jobs when 11,668,000 new jobs were needed to reach the previous of peak in the employment level under President Bush plus the growth in the labor force.
Obama on jobs report: Still too many people out of work
In the above speech given on August 3, Barack Obama misleads the American people about his failed economic policies in creating jobs.
By January 2013, the total increase in the Federal national debtunder President Obama will exceed $5,300 billionover a 48 month period due to government deficit spending greater than $1,297 billion per year for four consecutive years.
This is fiscal insanity.
Obama’s economic policies failed to grow the economy and create jobs.
Obama does not deserve another term as president.
Obama is not working.
More Jobs, Higher Unemployment Rate, July Report Says
July Unemployment Rate Rises to 8.3%- More Jobs Lost (195k) Than Gained (163k)
“It’s Been Four Years”
Trapped in Unemployment
Romney’s promise of 12 million jobs
Will Jobs Numbers Determine Election? Not So Far
Unemployment rate UP to 8.3% – REAL rate UP to 15% with Obama focus on jobs
Jobs Added in July but Unemployment Rate Rises
July Jobs Report: 163,000 jobs added
Rep. Kevin Brady Jobs Numbers Interview with CNBC’s Larry Kudlow 07-06-12
Congressman Kevin Brady Questions Fed Chairman Ben Bernanke 6-7-12
Rep. Kevin Brady Repeal Floor Speech 07-10-2012
We Told You They Are Lying about Unemployment
Unemployment Rate Primer
Lew Rockwell Pins the Tail on Ben Bernanke and the Rest of Washington’s Donkeys!
Lew Rockwell: The Government is A Gang of Thieves at Large!
Employment Level–144.2 Million
Series Id: LNS12000000
Seasonally Adjusted Series title: (Seas) Employment Level Labor force status: Employed Type of data: Number in thousands Age: 16 years and over
Year
Jan
Feb
Mar
Apr
May
Jun
Jul
Aug
Sep
Oct
Nov
Dec
Annual
2001
137778
137612
137783
137299
137092
136873
137071
136241
136846
136392
136238
136047
2002
135701
136438
136177
136126
136539
136415
136413
136705
137302
137008
136521
136426
2003
137417(1)
137482
137434
137633
137544
137790
137474
137549
137609
137984
138424
138411
2004
138472(1)
138542
138453
138680
138852
139174
139556
139573
139487
139732
140231
140125
2005
140245(1)
140385
140654
141254
141609
141714
142026
142434
142401
142548
142499
142752
2006
143150(1)
143457
143741
143761
144089
144353
144202
144625
144815
145314
145534
145970
2007
146028(1)
146057
146320
145586
145903
146063
145905
145682
146244
145946
146595
146273
2008
146397(1)
146157
146108
146130
145929
145738
145530
145196
145059
144792
144078
143328
2009
142187(1)
141660
140754
140654
140294
140003
139891
139458
138775
138401
138607
137968
2010
138500(1)
138665
138836
139306
139340
139137
139139
139338
139344
139072
138937
139220
2011
139330(1)
139551
139764
139628
139808
139385
139450
139754
140107
140297
140614
140790
2012
141637(1)
142065
142034
141865
142287
142415
142220
1 : Data affected by changes in population controls.
Civilian Labor Force Level–155 Million
Series Id: LNS11000000
Seasonally Adjusted Series title: (Seas) Civilian Labor Force Level Labor force status: Civilian labor force Type of data: Number in thousands Age: 16 years and over
Year
Jan
Feb
Mar
Apr
May
Jun
Jul
Aug
Sep
Oct
Nov
Dec
Annual
2001
143800
143701
143924
143569
143318
143357
143654
143284
143989
144086
144240
144305
2002
143883
144653
144481
144725
144938
144808
144803
145009
145552
145314
145041
145066
2003
145937(1)
146100
146022
146474
146500
147056
146485
146445
146530
146716
147000
146729
2004
146842(1)
146709
146944
146850
147065
147460
147692
147564
147415
147793
148162
148059
2005
148029(1)
148364
148391
148926
149261
149238
149432
149779
149954
150001
150065
150030
2006
150214(1)
150641
150813
150881
151069
151354
151377
151716
151662
152041
152406
152732
2007
153144(1)
152983
153051
152435
152670
153041
153054
152749
153414
153183
153835
153918
2008
154075(1)
153648
153925
153761
154325
154316
154480
154646
154559
154875
154622
154626
2009
154236(1)
154521
154143
154450
154800
154730
154538
154319
153786
153822
153833
153091
2010
153454(1)
153704
153964
154528
154216
153653
153748
154073
153918
153709
154041
153613
2011
153250(1)
153302
153392
153420
153700
153409
153358
153674
154004
154057
153937
153887
2012
154395(1)
154871
154707
154365
155007
155163
155013
1 : Data affected by changes in population controls.
Labor Force Participation Rate–63.7%
Series Id: LNS11300000
Seasonally Adjusted Series title: (Seas) Labor Force Participation Rate Labor force status: Civilian labor force participation rate Type of data: Percent or rate Age: 16 years and over
Year
Jan
Feb
Mar
Apr
May
Jun
Jul
Aug
Sep
Oct
Nov
Dec
Annual
2001
67.2
67.1
67.2
66.9
66.7
66.7
66.8
66.5
66.8
66.7
66.7
66.7
2002
66.5
66.8
66.6
66.7
66.7
66.6
66.5
66.6
66.7
66.6
66.4
66.3
2003
66.4
66.4
66.3
66.4
66.4
66.5
66.2
66.1
66.1
66.1
66.1
65.9
2004
66.1
66.0
66.0
65.9
66.0
66.1
66.1
66.0
65.8
65.9
66.0
65.9
2005
65.8
65.9
65.9
66.1
66.1
66.1
66.1
66.2
66.1
66.1
66.0
66.0
2006
66.0
66.1
66.2
66.1
66.1
66.2
66.1
66.2
66.1
66.2
66.3
66.4
2007
66.4
66.3
66.2
65.9
66.0
66.0
66.0
65.8
66.0
65.8
66.0
66.0
2008
66.2
66.0
66.1
65.9
66.1
66.1
66.1
66.1
65.9
66.0
65.8
65.8
2009
65.7
65.8
65.6
65.6
65.7
65.7
65.5
65.4
65.1
65.0
65.0
64.6
2010
64.8
64.9
64.9
65.1
64.9
64.6
64.6
64.7
64.6
64.4
64.5
64.3
2011
64.2
64.2
64.2
64.2
64.2
64.1
64.0
64.1
64.1
64.1
64.0
64.0
2012
63.7
63.9
63.8
63.6
63.8
63.8
63.7
Unemployment Level–12.8 Million
Series Id: LNS13000000
Seasonally Adjusted Series title: (Seas) Unemployment Level Labor force status: Unemployed Type of data: Number in thousands Age: 16 years and over
Year
Jan
Feb
Mar
Apr
May
Jun
Jul
Aug
Sep
Oct
Nov
Dec
Annual
2001
6023
6089
6141
6271
6226
6484
6583
7042
7142
7694
8003
8258
2002
8182
8215
8304
8599
8399
8393
8390
8304
8251
8307
8520
8640
2003
8520
8618
8588
8842
8957
9266
9011
8896
8921
8732
8576
8317
2004
8370
8167
8491
8170
8212
8286
8136
7990
7927
8061
7932
7934
2005
7784
7980
7737
7672
7651
7524
7406
7345
7553
7453
7566
7279
2006
7064
7184
7072
7120
6980
7001
7175
7091
6847
6727
6872
6762
2007
7116
6927
6731
6850
6766
6979
7149
7067
7170
7237
7240
7645
2008
7678
7491
7816
7631
8395
8578
8950
9450
9501
10083
10544
11299
2009
12049
12860
13389
13796
14505
14727
14646
14861
15012
15421
15227
15124
2010
14953
15039
15128
15221
14876
14517
14609
14735
14574
14636
15104
14393
2011
13919
13751
13628
13792
13892
14024
13908
13920
13897
13759
13323
13097
2012
12758
12806
12673
12500
12720
12749
12794
Unemployment Rate U-3–8.3%
Year
Jan
Feb
Mar
Apr
May
Jun
Jul
Aug
Sep
Oct
Nov
Dec
Annual
2001
4.2
4.2
4.3
4.4
4.3
4.5
4.6
4.9
5.0
5.3
5.5
5.7
2002
5.7
5.7
5.7
5.9
5.8
5.8
5.8
5.7
5.7
5.7
5.9
6.0
2003
5.8
5.9
5.9
6.0
6.1
6.3
6.2
6.1
6.1
6.0
5.8
5.7
2004
5.7
5.6
5.8
5.6
5.6
5.6
5.5
5.4
5.4
5.5
5.4
5.4
2005
5.3
5.4
5.2
5.2
5.1
5.0
5.0
4.9
5.0
5.0
5.0
4.9
2006
4.7
4.8
4.7
4.7
4.6
4.6
4.7
4.7
4.5
4.4
4.5
4.4
2007
4.6
4.5
4.4
4.5
4.4
4.6
4.7
4.6
4.7
4.7
4.7
5.0
2008
5.0
4.9
5.1
5.0
5.4
5.6
5.8
6.1
6.1
6.5
6.8
7.3
2009
7.8
8.3
8.7
8.9
9.4
9.5
9.5
9.6
9.8
10.0
9.9
9.9
2010
9.7
9.8
9.8
9.9
9.6
9.4
9.5
9.6
9.5
9.5
9.8
9.4
2011
9.1
9.0
8.9
9.0
9.0
9.1
9.1
9.1
9.0
8.9
8.7
8.5
2012
8.3
8.3
8.2
8.1
8.2
8.2
8.3
Total Unemployment Rate U-6–15%
Year
Jan
Feb
Mar
Apr
May
Jun
Jul
Aug
Sep
Oct
Nov
Dec
Annual
2001
7.3
7.4
7.3
7.4
7.5
7.9
7.8
8.1
8.7
9.3
9.4
9.6
2002
9.5
9.5
9.4
9.7
9.5
9.5
9.6
9.6
9.6
9.6
9.7
9.8
2003
10.0
10.2
10.0
10.2
10.1
10.3
10.3
10.1
10.4
10.2
10.0
9.8
2004
9.9
9.7
10.0
9.6
9.6
9.5
9.5
9.4
9.4
9.7
9.4
9.2
2005
9.3
9.3
9.1
8.9
8.9
9.0
8.8
8.9
9.0
8.7
8.7
8.6
2006
8.4
8.4
8.2
8.1
8.2
8.4
8.5
8.4
8.0
8.2
8.1
7.9
2007
8.4
8.2
8.0
8.2
8.2
8.3
8.4
8.4
8.4
8.4
8.4
8.8
2008
9.2
9.0
9.1
9.2
9.7
10.1
10.5
10.8
11.1
11.8
12.7
13.5
2009
14.2
15.1
15.7
15.8
16.4
16.5
16.5
16.7
16.8
17.2
17.1
17.1
2010
16.7
16.9
16.9
17.0
16.6
16.5
16.5
16.6
16.9
16.8
16.9
16.6
2011
16.1
15.9
15.7
15.9
15.8
16.2
16.1
16.2
16.4
16.0
15.6
15.2
2012
15.1
14.9
14.5
14.5
14.8
14.9
15.0
Comparison of U.S. Recoveries from Recession
1949-2007
Real Gross Domest Product (GDP) Growth Rates
Background Articles and Videos
Did Mitt Romney Call President Obama A Liar?
Romney Aid: Obama’s Ad Is a Lie
Current Population Survey
August 3, 2012
Employment from the BLS household and payroll surveys:
Transmission of material in this release is embargoed USDL-12-1531
until 8:30 a.m. (EDT) Friday, August 3, 2012
Technical information:
Household data: (202) 691-6378 * cpsinfo@bls.gov * www.bls.gov/cps
Establishment data: (202) 691-6555 * cesinfo@bls.gov * www.bls.gov/ces
Media contact: (202) 691-5902 * PressOffice@bls.gov
THE EMPLOYMENT SITUATION -- JULY 2012
Total nonfarm payroll employment rose by 163,000 in July, and the unemployment rate
was essentially unchanged at 8.3 percent, the U.S. Bureau of Labor Statistics reported
today. Employment rose in professional and business services, food services and drinking
places, and manufacturing.
Household Survey Data
Both the number of unemployed persons (12.8 million)and the unemployment rate (8.3
percent) were essentially unchanged in July. Both measures have shown little movement
thus far in 2012. (See table A-1.)
Among the major worker groups, the unemployment rate for Hispanics (10.3 percent) edged
down in July, while the rates for adult men (7.7 percent), adult women (7.5 percent),
teenagers (23.8 percent), whites (7.4 percent), and blacks (14.1 percent)showed little
or no change. The jobless rate for Asians was 6.2 percent in July (not seasonally
adjusted), little changed from a year earlier. (See tables A-1, A-2, and A-3.)
In July, the number of long-term unemployed (those jobless for 27 weeks and over) was
little changed at 5.2 million. These individuals accounted for 40.7 percent of the
unemployed. (See table A-12.)
Both the civilian labor force participation rate, at 63.7 percent, and the employment-
population ratio, at 58.4 percent, changed little in July. (See table A-1.)
The number of persons employed part time for economic reasons (sometimes referred to as
involuntary part-time workers) was essentially unchanged at 8.2 million in July. These
individuals were working part time because their hours had been cut back or because
they were unable to find a full-time job. (See table A-8.)
In July, 2.5 million persons were marginally attached to the labor force, down from 2.8
million a year earlier. (These data are not seasonally adjusted.) These individuals were
not in the labor force, wanted and were available for work, and had looked for a job
sometime in the prior 12 months. They were not counted as unemployed because they had
not searched for work in the 4 weeks preceding the survey. (See table A-16.)
Among the marginally attached, there were 852,000 discouraged workers in July, a decline
of 267,000 from a year earlier. (These data are not seasonally adjusted.) Discouraged
workers are persons not currently looking for work because they believe no jobs are
available for them. The remaining 1.7 million persons marginally attached to the labor
force in July had not searched for work in the 4 weeks preceding the survey for reasons
such as school attendance or family responsibilities.
Establishment Survey Data
Total nonfarm payroll employment rose by 163,000 in July. Since the beginning of this
year, employment growth has averaged 151,000 per month, about the same as the average
monthly gain of 153,000 in 2011. In July, employment rose in professional and business
services, food services and drinking places, and manufacturing. (See table B-1.)
Employment in professional and business services increased by 49,000 in July. Computer
systems design added 7,000 jobs, and employment in temporary help services continued
to trend up (+14,000).
Within leisure and hospitality, employment in food services and drinking places rose by
29,000 over the month and by 292,000 over the past 12 months.
Manufacturing employment rose in July (+25,000), with nearly all of the increase in durable
goods manufacturing. Within durable goods, the motor vehicles and parts industry had fewer
seasonal layoffs than is typical for July, contributing to a seasonally adjusted employment
increase of 13,000. Employment continued to trend up in fabricated metal products (+5,000).
Employment continued to trend up in health care in July (+12,000), with over-the-month
gains in outpatient care centers (+4,000) and in hospitals (+5,000). Employment also
continued to trend up in wholesale trade.
Utilities employment declined in July (-8,000). The decrease reflects 8,500 utility workers
who were off payrolls due to a labor-management dispute.
Employment in other major industries, including mining and logging, construction, retail
trade, transportation and warehousing, financial activities, and government, showed little
or no change over the month.
The average workweek for all employees on private nonfarm payrolls was unchanged at
34.5 hours in July. Both the manufacturing workweek, at 40.7 hours, and factory overtime,
at 3.2 hours, were unchanged over the month. The average workweek for production and
nonsupervisory employees on private nonfarm payrolls was unchanged at 33.7 hours. (See
tables B-2 and B-7.)
In July, average hourly earnings for all employees on private nonfarm payrolls edged up
by 2 cents to $23.52. Over the year, average hourly earnings rose by 1.7 percent. In July,
average hourly earnings of private-sector production and nonsupervisory employees increased
by 2 cents to $19.77. (See tables B-3 and B-8.)
The change in total nonfarm payroll employment for May was revised from +77,000 to +87,000,
and the change for June was revised from +80,000 to +64,000.
_____________
The Employment Situation for August is scheduled to be released on Friday, September 7, 2012,
at 8:30 a.m. (EDT).
Glenn Hubbard: The Romney Plan for Economic Recovery
Tax cuts, spending restraint and repeal of Obama’s regulatory excesses would
mean 12 million new jobs in his first term alone
By Glenn Hubbard
“…We are currently in the most anemic economic recovery in the memory of most Americans. Declining consumer sentiment and business concerns over policy uncertainty weigh on the minds of all of us. We must fix our economy’s growth and jobs machine.
We can do this. The U.S. economy has the talent, ideas, energy and capital for the robust economic growth that has characterized much of America’s experience in our lifetimes. Our standard of living and the nation’s standing as a world power depend on restoring that growth.
But to do so we must have vastly different policies aimed at stopping runaway federal spending and debt, reforming our tax code and entitlement programs, and scaling back costly regulations. Those policies cannot be found in the president’s proposals. They are, however, the core of Gov. Mitt Romney’s plan for economic recovery and renewal.
In response to the recession, the Obama administration chose to emphasize costly, short-term fixes—ineffective stimulus programs, myriad housing programs that went nowhere, and a rush to invest in “green” companies.
As a consequence, uncertainty over policy—particularly over tax and regulatory policy—slowed the recovery and limited job creation. One recent study by Scott Baker and Nicholas Bloom of Stanford University and Steven Davis of the University of Chicago found that this uncertainty reduced GDP by 1.4% in 2011 alone, and that returning to pre-crisis levels of uncertainty would add about 2.3 million jobs in just 18 months.
The Obama administration’s attempted short-term fixes, even with unprecedented monetary easing by the Federal Reserve, produced average GDP growth of just 2.2% over the past three years, and the consensus outlook appears no better for the year ahead.
Moreover, the Obama administration’s large and sustained increases in debt raise the specter of another financial crisis and large future tax increases, further chilling business investment and job creation. A recent study by Ernst & Young finds that the administration’s proposal to increase marginal tax rates on the wage, dividend and capital-gain income of upper-income Americans would reduce GDP by 1.3% (or $200 billion per year), kill 710,000 jobs, depress investment by 2.4%, and reduce wages and living standards by 1.8%. And according to the Congressional Budget Office, the large deficits codified in the president’s budget would reduce GDP during 2018-2022 by between 0.5% and 2.2% compared to what would occur under current law.
President Obama has ignored or dismissed proposals that would address our anti-competitive tax code and unsustainable trajectory of federal debt—including his own bipartisan National Commission on Fiscal Responsibility and Reform—and submitted no plan for entitlement reform. In February, Treasury Secretary Tim Geithner famously told congressional Republicans that this administration was putting forth no plan, but “we know we don’t like yours.”
Other needed reforms would emphasize opening global markets for U.S. goods and services—but the president has made no contribution to the global trade agenda, while being dragged to the support of individual trade agreements only recently.
The president’s choices cannot be ascribed to a political tug of war with Republicans in Congress. He and Democratic congressional majorities had two years to tackle any priority they chose. They chose not growth and jobs but regulatory expansion. The Patient Protection and Affordable Care Act raised taxes, unleashed significant new spending, and raised hiring costs for workers. The Dodd-Frank Act missed the mark on housing and “too-big-to-fail” financial institutions but raised financing costs for households and small and mid-size businesses.
These economic errors and policy choices have consequences—record high long-term unemployment and growing ranks of discouraged workers. Sadly, at the present rate of job creation and projected labor-force growth, the nation will never return to full employment.
It doesn’t have to be this way. The Romney economic plan would fundamentally change the direction of policy to increase GDP and job creation now and going forward. The governor’s plan puts growth and recovery first, and it stands on four main pillars:
• Stop runaway federal spending and debt. The governor’s plan would reduce federal spending as a share of GDP to 20%—its pre-crisis average—by 2016. This would dramatically reduce policy uncertainty over the need for future tax increases, thus increasing business and consumer confidence.
• Reform the nation’s tax code to increase growth and job creation. The Romney plan would reduce individual marginal income tax rates across the board by 20%, while keeping current low tax rates on dividends and capital gains. The governor would also reduce the corporate income tax rate—the highest in the world—to 25%. In addition, he would broaden the tax base to ensure that tax reform is revenue-neutral.
• Reform entitlement programs to ensure their viability. The Romney plan would gradually reduce growth in Social Security and Medicare benefits for more affluent seniors and give more choice in Medicare programs and benefits to improve value in health-care spending. It would also block grant the Medicaid program to states to enable experimentation that might better serve recipients.
• Make growth and cost-benefit analysis important features of regulation. The governor’s plan would remove regulatory impediments to energy production and innovation that raise costs to consumers and limit new job creation. He would also work with Congress toward repealing and replacing the costly and burdensome Dodd–Frank legislation and the Patient Protection and Affordable Care Act. The Romney alternatives will emphasize better financial regulation and market-oriented, patient-centered health-care reform.
In contrast to the sclerosis and joblessness of the past three years, the Romney plan offers an economic U-turn in ideas and choices. When bolstered by sound trade, education, energy and monetary policy, the Romney reform program is expected by the governor’s economic advisers to increase GDP growth by between 0.5% and 1% per year over the next decade. It should also speed up the current recovery, enabling the private sector to create 200,000 to 300,000 jobs per month, or about 12 million new jobs in a Romney first term, and millions more after that due to the plan’s long-run growth effects.
But these gains aren’t just about numbers, as important as those numbers are. The Romney approach will restore confidence in America’s economic future and make America once again a place to invest and grow.
Mr. Hubbard, dean of Columbia Business School, was chairman of the Council of Economic Advisers under President George W. Bush. He is an economic adviser to Gov. Romney. …”


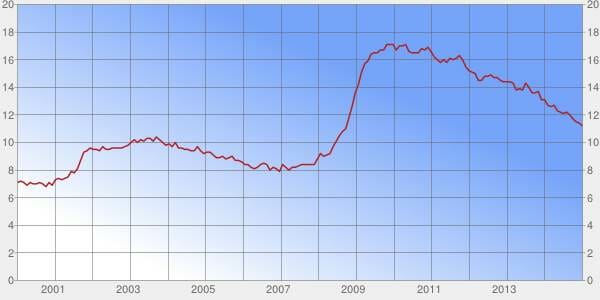


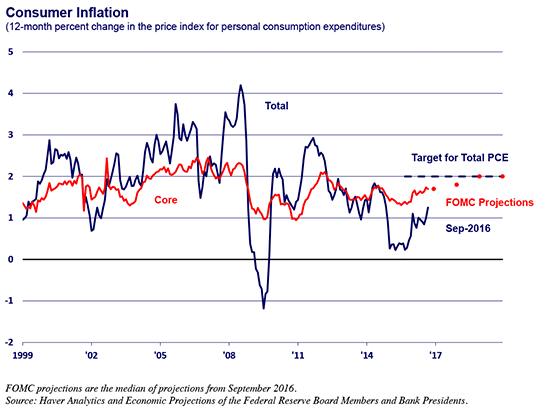
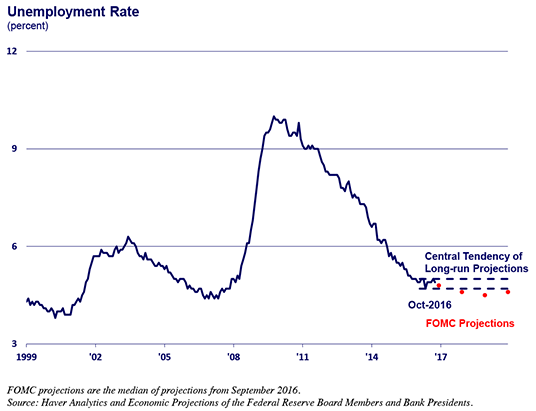
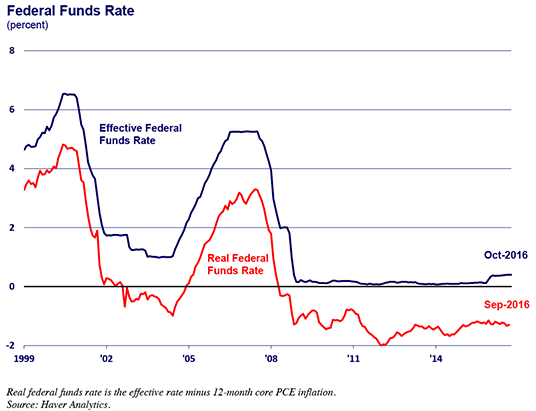
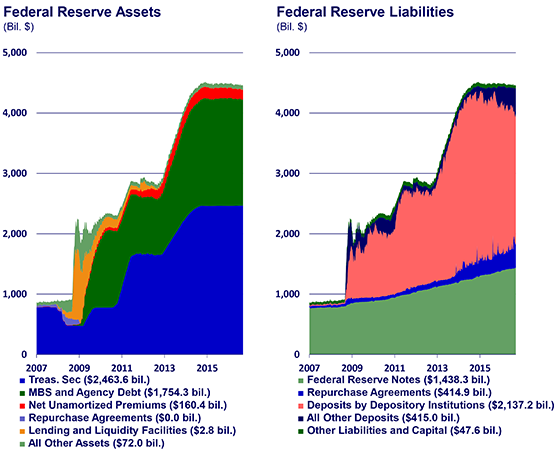 During the financial crisis and in the period since the fed funds rate neared the zero lower bound, the FOMC has employed unconventional tools to improve the functioning of financial markets and to provide additional policy accommodation.
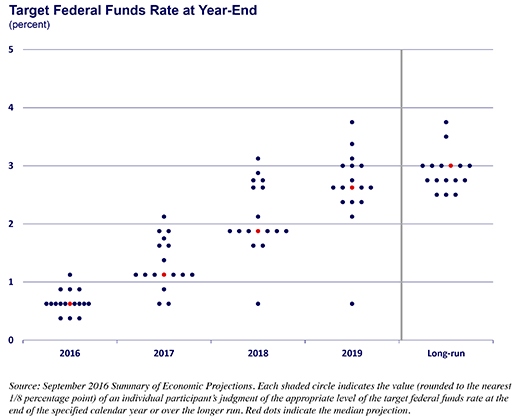


Global Economy Goes Into Recession — Today’s 62.7% U.S. Labor Participation Rate Same As February 1978 — 158,000 Jobs Created in January 2016 — Unemployment Rates U-3: 4.9% and U-6: 9.9% — Videos
Posted on February 20, 2016. Filed under: American History, Banking, Blogroll, Business, College, Crisis, Demographics, Economics, Education, Elections, Employment, Entertainment, Family, Federal Government, Federal Government Budget, Fiscal Policy, history, Inflation, Investments, Law, liberty, Life, Macroeconomics, media, Microeconomics, Monetary Policy, Money, People, Philosophy, Politics, Press, Radio, Radio, Rants, Raves, Regulations, Talk Radio, Tax Policy, Taxation, Taxes, Television, Television, Unemployment, Video, Wealth, Welfare, Wisdom, Work, Writing | Tags: 4.9 % Unemployment Rate U-3, 5 February 2016, 62.7% U.S. Labor Participation Rate, America, articles, Audio, Breaking News, Broadcasting, capitalism, Cartoons, Charity, Citizenship, Clarity, Classical Liberalism, Collectivism, Commentary, Commitment, Communicate, Communication, Concise, Convincing, Courage, Culture, Current Affairs, Current Events, economic growth, economic policy, Economics, Education, Evil, Experience, Faith, Family, First, fiscal policy, free enterprise, freedom, freedom of speech, Friends, Give It A Listen, Global Recession, God, Good, Goodwill, Growth, Hope, Individualism, Jobs Report, Knowledge, Labor Participation Rate, liberty, Life, Love, Lovers of Liberty, monetary policy, MPEG3, News, Opinions, Peace, Photos, Podcasts, Political Philosophy, Politics, prosperity, Radio, Raymond Thomas Pronk, Representative Republic, Republic, Resources, Respect, rule of law, Rule of Men, Show Notes, Talk Radio, The Pronk Pops Show, The Pronk Pops Show 618, Truth, Tyranny, U-6: 9.9%, U.S. Constitution, United States of America, Videos, Virtue, War, Wisdom |
The Pronk Pops Show Podcasts
Pronk Pops Show 618: February 5, 2016
Pronk Pops Show 617: February 4, 2016
Pronk Pops Show 616: February 3, 2016
Pronk Pops Show 615: February 1, 2016
Pronk Pops Show 614: January 29, 2016
Pronk Pops Show 613: January 28, 2016
Pronk Pops Show 612: January 27, 2016
Pronk Pops Show 611: January 26, 2016
Pronk Pops Show 610: January 25, 2016
Pronk Pops Show 609: January 22, 2016
Pronk Pops Show 608: January 21, 2016
Pronk Pops Show 607: January 20, 2016
Pronk Pops Show 606: January 19, 2016
Pronk Pops Show 605: January 15, 2015
Pronk Pops Show 604: January 14, 2016
Pronk Pops Show 603: January 13, 2016
Pronk Pops Show 602: January 12, 2016
Pronk Pops Show 601: January 11, 2015
Pronk Pops Show 600: January 8, 2016
Pronk Pops Show 599: January 6, 2016
Pronk Pops Show 598: January 5, 2016
Pronk Pops Show 597: December 21, 2015
Pronk Pops Show 596: December 18, 2015
Pronk Pops Show 595: December 17, 2015
Pronk Pops Show 594: December 16, 2015
Pronk Pops Show 593: December 15, 2015
Pronk Pops Show 592: December 14, 2015
Pronk Pops Show 591: December 11, 2015
Pronk Pops Show 590: December 10, 2015
Pronk Pops Show 589: December 9, 2015
Pronk Pops Show 588: December 7, 2015
Pronk Pops Show 587: December 4, 2015
Pronk Pops Show 586: December 3, 2015
Pronk Pops Show 585: December 2, 2015
Pronk Pops Show 584: December 1, 2015
Pronk Pops Show 583: November 30, 2015
Pronk Pops Show 582: November 25, 2015
Pronk Pops Show 581: November 24, 2015
Pronk Pops Show 580: November 23, 2015
Pronk Pops Show 579: November 20, 2015
Pronk Pops Show 578: November 19, 2015
Pronk Pops Show 577: November 18, 2015
Pronk Pops Show 576: November 17, 2015
Pronk Pops Show 575: November 16, 2015 (more…)
Read Full Post | Make a Comment ( None so far )