US jobs numbers disappoint but ‘underlying tone is bullish’
Data extracted on: August 2, 2013 (2:01:21 PM)
Labor Force Statistics from the Current Population Survey
Employment Level
144,285,000
Series Id:           LNS12000000
Seasonally Adjusted
Series title:        (Seas) Employment Level
Labor force status:  Employed
Type of data:        Number in thousands
Age:                 16 years and over
Year
Jan
Feb
Mar
Apr
May
Jun
Jul
Aug
Sep
Oct
Nov
Dec
Annual
2000
136559(1)
136598
136701
137270
136630
136940
136531
136662
136893
137088
137322
137614
2001
137778
137612
137783
137299
137092
136873
137071
136241
136846
136392
136238
136047
2002
135701
136438
136177
136126
136539
136415
136413
136705
137302
137008
136521
136426
2003
137417(1)
137482
137434
137633
137544
137790
137474
137549
137609
137984
138424
138411
2004
138472(1)
138542
138453
138680
138852
139174
139556
139573
139487
139732
140231
140125
2005
140245(1)
140385
140654
141254
141609
141714
142026
142434
142401
142548
142499
142752
2006
143150(1)
143457
143741
143761
144089
144353
144202
144625
144815
145314
145534
145970
2007
146028(1)
146057
146320
145586
145903
146063
145905
145682
146244
145946
146595
146273
2008
146378(1)
146156
146086
146132
145908
145737
145532
145203
145076
144802
144100
143369
2009
142153(1)
141644
140721
140652
140250
140005
139898
139481
138810
138421
138665
138025
2010
138439(1)
138624
138767
139296
139255
139148
139167
139405
139388
139097
139046
139295
2011
139253(1)
139471
139643
139606
139681
139405
139509
139870
140164
140314
140771
140896
2012
141608(1)
142019
142020
141934
142302
142448
142250
142164
142974
143328
143277
143305
2013
143322(1)
143492
143286
143579
143898
144058
144285
1 : Data affected by changes in population controls.
Civilian Labor Force
155,798,000
Series Id:           LNS11000000
Seasonally Adjusted
Series title:        (Seas) Civilian Labor Force Level
Labor force status:  Civilian labor force
Type of data:        Number in thousands
Age:                 16 years and over
Year
Jan
Feb
Mar
Apr
May
Jun
Jul
Aug
Sep
Oct
Nov
Dec
Annual
2000
142267(1)
142456
142434
142751
142388
142591
142278
142514
142518
142622
142962
143248
2001
143800
143701
143924
143569
143318
143357
143654
143284
143989
144086
144240
144305
2002
143883
144653
144481
144725
144938
144808
144803
145009
145552
145314
145041
145066
2003
145937(1)
146100
146022
146474
146500
147056
146485
146445
146530
146716
147000
146729
2004
146842(1)
146709
146944
146850
147065
147460
147692
147564
147415
147793
148162
148059
2005
148029(1)
148364
148391
148926
149261
149238
149432
149779
149954
150001
150065
150030
2006
150214(1)
150641
150813
150881
151069
151354
151377
151716
151662
152041
152406
152732
2007
153144(1)
152983
153051
152435
152670
153041
153054
152749
153414
153183
153835
153918
2008
154063(1)
153653
153908
153769
154303
154313
154469
154641
154570
154876
154639
154655
2009
154232(1)
154526
154142
154479
154742
154710
154505
154300
153815
153804
153887
153120
2010
153455(1)
153702
153960
154577
154110
153623
153709
154078
153966
153681
154140
153649
2011
153244(1)
153269
153358
153478
153552
153369
153325
153707
154074
154010
154096
153945
2012
154356(1)
154825
154707
154451
154998
155149
154995
154647
155056
155576
155319
155511
2013
155654(1)
155524
155028
155238
155658
155835
155798
Labor Force Participation Rate
63.4%
Series Id:           LNS11300000
Seasonally Adjusted
Series title:        (Seas) Labor Force Participation Rate
Labor force status:  Civilian labor force participation rate
Type of data:        Percent or rate
Age:                 16 years and over
Year
Jan
Feb
Mar
Apr
May
Jun
Jul
Aug
Sep
Oct
Nov
Dec
Annual
2000
67.3
67.3
67.3
67.3
67.1
67.1
66.9
66.9
66.9
66.8
66.9
67.0
2001
67.2
67.1
67.2
66.9
66.7
66.7
66.8
66.5
66.8
66.7
66.7
66.7
2002
66.5
66.8
66.6
66.7
66.7
66.6
66.5
66.6
66.7
66.6
66.4
66.3
2003
66.4
66.4
66.3
66.4
66.4
66.5
66.2
66.1
66.1
66.1
66.1
65.9
2004
66.1
66.0
66.0
65.9
66.0
66.1
66.1
66.0
65.8
65.9
66.0
65.9
2005
65.8
65.9
65.9
66.1
66.1
66.1
66.1
66.2
66.1
66.1
66.0
66.0
2006
66.0
66.1
66.2
66.1
66.1
66.2
66.1
66.2
66.1
66.2
66.3
66.4
2007
66.4
66.3
66.2
65.9
66.0
66.0
66.0
65.8
66.0
65.8
66.0
66.0
2008
66.2
66.0
66.1
65.9
66.1
66.1
66.1
66.1
66.0
66.0
65.9
65.8
2009
65.7
65.8
65.6
65.7
65.7
65.7
65.5
65.4
65.1
65.0
65.0
64.6
2010
64.8
64.9
64.9
65.1
64.9
64.6
64.6
64.7
64.6
64.4
64.6
64.3
2011
64.2
64.2
64.2
64.2
64.2
64.0
64.0
64.1
64.2
64.1
64.1
64.0
2012
63.7
63.9
63.8
63.6
63.8
63.8
63.7
63.5
63.6
63.8
63.6
63.6
2013
63.6
63.5
63.3
63.3
63.4
63.5
63.4
Unemployment Level
11,514,000
Series Id:           LNS13000000
Seasonally Adjusted
Series title:        (Seas) Unemployment Level
Labor force status:  Unemployed
Type of data:        Number in thousands
Age:                 16 years and over
Year
Jan
Feb
Mar
Apr
May
Jun
Jul
Aug
Sep
Oct
Nov
Dec
Annual
2000
5708
5858
5733
5481
5758
5651
5747
5853
5625
5534
5639
5634
2001
6023
6089
6141
6271
6226
6484
6583
7042
7142
7694
8003
8258
2002
8182
8215
8304
8599
8399
8393
8390
8304
8251
8307
8520
8640
2003
8520
8618
8588
8842
8957
9266
9011
8896
8921
8732
8576
8317
2004
8370
8167
8491
8170
8212
8286
8136
7990
7927
8061
7932
7934
2005
7784
7980
7737
7672
7651
7524
7406
7345
7553
7453
7566
7279
2006
7064
7184
7072
7120
6980
7001
7175
7091
6847
6727
6872
6762
2007
7116
6927
6731
6850
6766
6979
7149
7067
7170
7237
7240
7645
2008
7685
7497
7822
7637
8395
8575
8937
9438
9494
10074
10538
11286
2009
12079
12881
13421
13826
14492
14705
14607
14819
15005
15382
15223
15095
2010
15016
15078
15192
15281
14856
14475
14542
14673
14577
14584
15094
14354
2011
13992
13798
13716
13872
13871
13964
13817
13837
13910
13696
13325
13049
2012
12748
12806
12686
12518
12695
12701
12745
12483
12082
12248
12042
12206
2013
12332
12032
11742
11659
11760
11777
11514
Unemployment Rate U-3
7.4%
Series Id:           LNS14000000
Seasonally Adjusted
Series title:        (Seas) Unemployment Rate
Labor force status:  Unemployment rate
Type of data:        Percent or rate
Age:                 16 years and over
Year
Jan
Feb
Mar
Apr
May
Jun
Jul
Aug
Sep
Oct
Nov
Dec
Annual
2000
4.0
4.1
4.0
3.8
4.0
4.0
4.0
4.1
3.9
3.9
3.9
3.9
2001
4.2
4.2
4.3
4.4
4.3
4.5
4.6
4.9
5.0
5.3
5.5
5.7
2002
5.7
5.7
5.7
5.9
5.8
5.8
5.8
5.7
5.7
5.7
5.9
6.0
2003
5.8
5.9
5.9
6.0
6.1
6.3
6.2
6.1
6.1
6.0
5.8
5.7
2004
5.7
5.6
5.8
5.6
5.6
5.6
5.5
5.4
5.4
5.5
5.4
5.4
2005
5.3
5.4
5.2
5.2
5.1
5.0
5.0
4.9
5.0
5.0
5.0
4.9
2006
4.7
4.8
4.7
4.7
4.6
4.6
4.7
4.7
4.5
4.4
4.5
4.4
2007
4.6
4.5
4.4
4.5
4.4
4.6
4.7
4.6
4.7
4.7
4.7
5.0
2008
5.0
4.9
5.1
5.0
5.4
5.6
5.8
6.1
6.1
6.5
6.8
7.3
2009
7.8
8.3
8.7
9.0
9.4
9.5
9.5
9.6
9.8
10.0
9.9
9.9
2010
9.8
9.8
9.9
9.9
9.6
9.4
9.5
9.5
9.5
9.5
9.8
9.3
2011
9.1
9.0
8.9
9.0
9.0
9.1
9.0
9.0
9.0
8.9
8.6
8.5
2012
8.3
8.3
8.2
8.1
8.2
8.2
8.2
8.1
7.8
7.9
7.8
7.8
2013
7.9
7.7
7.6
7.5
7.6
7.6
7.4
Employment-Population Ratio
58.7%
Series Id:           LNS12300000
Seasonally Adjusted
Series title:        (Seas) Employment-Population Ratio
Labor force status:  Employment-population ratio
Type of data:        Percent or rate
Age:                 16 years and over
Year
Jan
Feb
Mar
Apr
May
Jun
Jul
Aug
Sep
Oct
Nov
Dec
Annual
2000
64.6
64.6
64.6
64.7
64.4
64.5
64.2
64.2
64.2
64.2
64.3
64.4
2001
64.4
64.3
64.3
64.0
63.8
63.7
63.7
63.2
63.5
63.2
63.0
62.9
2002
62.7
63.0
62.8
62.7
62.9
62.7
62.7
62.7
63.0
62.7
62.5
62.4
2003
62.5
62.5
62.4
62.4
62.3
62.3
62.1
62.1
62.0
62.1
62.3
62.2
2004
62.3
62.3
62.2
62.3
62.3
62.4
62.5
62.4
62.3
62.3
62.5
62.4
2005
62.4
62.4
62.4
62.7
62.8
62.7
62.8
62.9
62.8
62.8
62.7
62.8
2006
62.9
63.0
63.1
63.0
63.1
63.1
63.0
63.1
63.1
63.3
63.3
63.4
2007
63.3
63.3
63.3
63.0
63.0
63.0
62.9
62.7
62.9
62.7
62.9
62.7
2008
62.9
62.8
62.7
62.7
62.5
62.4
62.2
62.0
61.9
61.7
61.4
61.0
2009
60.6
60.3
59.9
59.8
59.6
59.4
59.3
59.1
58.7
58.5
58.6
58.3
2010
58.5
58.5
58.5
58.7
58.6
58.5
58.5
58.5
58.5
58.3
58.2
58.3
2011
58.3
58.4
58.4
58.4
58.4
58.2
58.2
58.3
58.4
58.4
58.5
58.6
2012
58.5
58.6
58.5
58.5
58.6
58.6
58.5
58.4
58.7
58.7
58.7
58.6
2013
58.6
58.6
58.5
58.6
58.6
58.7
58.7
Unemployment Rate 16-19 Years Old
23.7%
Series Id:           LNS14000012
Seasonally Adjusted
Series title:        (Seas) Unemployment Rate - 16-19 yrs.
Labor force status:  Unemployment rate
Type of data:        Percent or rate
Age:                 16 to 19 years
Year
Jan
Feb
Mar
Apr
May
Jun
Jul
Aug
Sep
Oct
Nov
Dec
Annual
2000
12.7
13.8
13.3
12.6
12.8
12.3
13.4
14.0
13.0
12.8
13.0
13.2
2001
13.8
13.7
13.8
13.9
13.4
14.2
14.4
15.6
15.2
16.0
15.9
17.0
2002
16.5
16.0
16.6
16.7
16.6
16.7
16.8
17.0
16.3
15.1
17.1
16.9
2003
17.2
17.2
17.8
17.7
17.9
19.0
18.2
16.6
17.6
17.2
15.7
16.2
2004
17.0
16.5
16.8
16.6
17.1
17.0
17.8
16.7
16.6
17.4
16.4
17.6
2005
16.2
17.5
17.1
17.8
17.8
16.3
16.1
16.1
15.5
16.1
17.0
14.9
2006
15.1
15.3
16.1
14.6
14.0
15.8
15.9
16.0
16.3
15.2
14.8
14.6
2007
14.8
14.9
14.9
15.9
15.9
16.3
15.3
15.9
15.9
15.4
16.2
16.8
2008
17.8
16.6
16.1
15.9
19.0
19.2
20.7
18.6
19.1
20.0
20.3
20.5
2009
20.7
22.2
22.2
22.2
23.4
24.7
24.3
25.0
25.9
27.1
26.9
26.6
2010
26.0
25.4
26.2
25.5
26.6
26.0
26.0
25.7
25.8
27.2
24.6
25.1
2011
25.5
24.0
24.4
24.7
24.0
24.7
24.9
25.2
24.4
24.1
23.9
22.9
2012
23.4
23.7
25.0
24.9
24.4
23.7
23.9
24.5
23.7
23.7
23.6
23.5
2013
23.4
25.1
24.2
24.1
24.5
24.0
23.7
White Unemployment Rate
6.6%
Series Id:           LNS14000003
Seasonally Adjusted
Series title:        (Seas) Unemployment Rate - White
Labor force status:  Unemployment rate
Type of data:        Percent or rate
Age:                 16 years and over
Race:                White
Year
Jan
Feb
Mar
Apr
May
Jun
Jul
Aug
Sep
Oct
Nov
Dec
Annual
2000
3.4
3.6
3.5
3.4
3.5
3.4
3.5
3.6
3.5
3.4
3.5
3.5
2001
3.6
3.7
3.7
3.9
3.8
4.0
4.0
4.3
4.3
4.7
4.9
5.1
2002
5.1
5.0
5.0
5.2
5.1
5.1
5.2
5.1
5.1
5.1
5.1
5.1
2003
5.2
5.1
5.1
5.3
5.4
5.5
5.4
5.4
5.3
5.1
5.2
5.0
2004
5.0
4.9
5.1
5.0
4.9
5.0
4.7
4.7
4.6
4.6
4.6
4.5
2005
4.5
4.6
4.5
4.4
4.4
4.3
4.2
4.2
4.4
4.4
4.3
4.2
2006
4.1
4.1
4.0
4.1
4.1
4.1
4.1
4.1
3.9
3.9
4.0
3.9
2007
4.2
4.1
3.8
4.0
3.9
4.1
4.2
4.2
4.2
4.1
4.2
4.4
2008
4.4
4.4
4.5
4.4
4.8
5.0
5.2
5.4
5.4
5.9
6.2
6.7
2009
7.1
7.6
8.0
8.1
8.6
8.7
8.7
8.9
9.0
9.2
9.2
9.0
2010
8.8
8.9
8.9
9.0
8.7
8.6
8.5
8.6
8.6
8.6
8.9
8.5
2011
8.1
8.1
8.0
8.1
8.0
8.1
8.0
7.9
7.9
8.0
7.7
7.5
2012
7.4
7.4
7.3
7.4
7.4
7.3
7.4
7.2
7.0
6.9
6.8
6.9
2013
7.0
6.8
6.7
6.7
6.7
6.6
6.6
Black Unemployment Rate
Series Id:           LNS14000006
Seasonally Adjusted
Series title:        (Seas) Unemployment Rate - Black or African American
Labor force status:  Unemployment rate
Type of data:        Percent or rate
Age:                 16 years and over
Race:                Black or African American
Employment Situation News Release
Transmission of material in this release is embargoed                                  USDL-13-1527
until 8:30 a.m. (EDT) Friday, August 2, 2013

Technical information:
 Household data:       (202) 691-6378  *  cpsinfo@bls.gov  *  www.bls.gov/cps
 Establishment data:   (202) 691-6555  *  cesinfo@bls.gov  *  www.bls.gov/ces

Media contact:         (202) 691-5902  *  PressOffice@bls.gov

                         THE EMPLOYMENT SITUATION -- JULY 2013

Total nonfarm payroll employment increased by 162,000 in July, and the unemployment rate edged
down to 7.4 percent, the U.S. Bureau of Labor Statistics reported today. Employment rose in
retail trade, food services and drinking places, financial activities, and wholesale trade.

Household Survey Data

Both the number of unemployed persons, at 11.5 million, and the unemployment rate, at 7.4 percent,
edged down in July. Over the year, these measures were down by 1.2 million and 0.8 percentage
point, respectively. (See table A-1.)

Among the major worker groups, the unemployment rates for adult women (6.5 percent) and blacks
(12.6 percent) declined in July. The rates for adult men (7.0 percent), teenagers (23.7 percent),
whites (6.6 percent), and Hispanics (9.4 percent) showed little or no change. The jobless rate
for Asians was 5.7 percent (not seasonally adjusted), little changed from a year earlier. (See
tables A-1, A-2, and A-3.)

In July, the number of long-term unemployed (those jobless for 27 weeks or more) was little
changed at 4.2 million. These individuals accounted for 37.0 percent of the unemployed. The
number of long-term unemployed has declined by 921,000 over the past year. (See table A-12.)

The civilian labor force participation rate was 63.4 percent in July, little changed over the
month. The employment-population ratio was unchanged at 58.7 percent. (See table A-1.)

The number of persons employed part time for economic reasons (sometimes referred to as involuntary
part-time workers) was essentially unchanged at 8.2 million in July. These individuals were working
part time because their hours had been cut back or because they were unable to find a full-time
job. (See table A-8.)

In July, 2.4 million persons were marginally attached to the labor force, little changed from a
year earlier. (The data are not seasonally adjusted.) These individuals were not in the labor
force, wanted and were available for work, and had looked for a job sometime in the prior 12
months. They were not counted as unemployed because they had not searched for work in the 4 weeks
preceding the survey. (See table A-16.)

Among the marginally attached, there were 988,000 discouraged workers in July, up by 136,000 from
a year earlier. (The data are not seasonally adjusted.) Discouraged workers are persons not
currently looking for work because they believe no jobs are available for them. The remaining
1.4 million persons marginally attached to the labor force in July had not searched for work for
reasons such as school attendance or family responsibilities. (See table A-16.)

Establishment Survey Data

Total nonfarm payroll employment increased by 162,000 in July, with gains in retail trade, food
services and drinking places, financial activities, and wholesale trade. Over the prior 12 months,
nonfarm employment growth averaged 189,000 per month. (See table B-1.)

Retail trade added 47,000 jobs in July and has added 352,000 over the past 12 months. In July, job
growth occurred in general merchandise stores (+9,000), motor vehicle and parts dealers (+6,000),
building material and garden supply stores (+6,000), and health and personal care stores (+5,000).

Within leisure and hospitality, employment in food services and drinking places increased by 38,000
in July and by 381,000 over the year.

Financial activities employment increased by 15,000 in July, with a gain of 6,000 in securities,
commodity contracts, and investments. Over the year, financial activities has added 120,000 jobs.

Employment increased in wholesale trade (+14,000) in July. Over the past 12 months, this industry
has added 83,000 jobs.

Employment in professional and business services continued to trend up in July (+36,000). Within
the industry, job growth continued in management of companies and enterprises (+7,000) and in
management and technical consulting services (+7,000). Employment in temporary help services
changed little over the month.

Manufacturing employment was essentially unchanged in July and has changed little, on net, over
the past 12 months. Within the industry, employment in motor vehicles and parts rose by 9,000
in July.

Employment in health care was essentially unchanged over the month. Thus far in 2013, health
care has added an average of 16,000 jobs per month, compared with an average monthly increase
of 27,000 in 2012.

Employment in other major industries, including mining and logging, construction, transportation
and warehousing, and government, showed little change in July.

The average workweek for all employees on private nonfarm payrolls decreased by 0.1 hour in July
to 34.4 hours. In manufacturing, the workweek decreased by 0.2 hour to 40.6 hours, and overtime
declined by 0.2 hour to 3.2 hours. The average workweek for production and nonsupervisory employees
on private nonfarm payrolls decreased by 0.1 hour to 33.6 hours. (See tables B-2 and B-7.)

In July, average hourly earnings for all employees on private nonfarm payrolls edged down by 2 cents
to $23.98, following a 10-cent increase in June. Over the year, average hourly earnings have risen
by 44 cents, or 1.9 percent. In July, average hourly earnings of private-sector production and
nonsupervisory employees were unchanged at $20.14. (See tables B-3 and B-8.)

The change in total nonfarm payroll employment for May was revised from +195,000 to +176,000, and
the change for June was revised from +195,000 to +188,000. With these revisions, employment gains
in May and June combined were 26,000 less than previously reported.

_____________
The Employment Situation for August is scheduled to be released on Friday, September 6, 2013, at
8:30 a.m. (EDT).
HOUSEHOLD DATA
Summary table A. Household data, seasonally adjusted
[Numbers in thousands]
Category
July
2012
May
2013
June
2013
July
2013
Change from:
June
2013-
July
2013
Employment status
Civilian noninstitutional population
243,354
245,363
245,552
245,756
204
Civilian labor force
154,995
155,658
155,835
155,798
-37
Participation rate
63.7
63.4
63.5
63.4
-0.1
Employed
142,250
143,898
144,058
144,285
227
Employment-population ratio
58.5
58.6
58.7
58.7
0.0
Unemployed
12,745
11,760
11,777
11,514
-263
Unemployment rate
8.2
7.6
7.6
7.4
-0.2
Not in labor force
88,359
89,705
89,717
89,957
240
Unemployment rates
Total, 16 years and over
8.2
7.6
7.6
7.4
-0.2
Adult men (20 years and over)
7.7
7.2
7.0
7.0
0.0
Adult women (20 years and over)
7.5
6.5
6.8
6.5
-0.3
Teenagers (16 to 19 years)
23.9
24.5
24.0
23.7
-0.3
White
7.4
6.7
6.6
6.6
0.0
Black or African American
14.1
13.5
13.7
12.6
-1.1
Asian (not seasonally adjusted)
6.2
4.3
5.0
5.7
–
Hispanic or Latino ethnicity
10.3
9.1
9.1
9.4
0.3
Total, 25 years and over
6.9
6.1
6.2
6.1
-0.1
Less than a high school diploma
12.7
11.1
10.7
11.0
0.3
High school graduates, no college
8.6
7.4
7.6
7.6
0.0
Some college or associate degree
7.1
6.5
6.4
6.0
-0.4
Bachelor’s degree and higher
4.1
3.8
3.9
3.8
-0.1
Reason for unemployment
Job losers and persons who completed temporary jobs
7,106
6,147
6,119
5,921
-198
Job leavers
879
944
1,030
979
-51
Reentrants
3,374
3,333
3,291
3,258
-33
New entrants
1,299
1,268
1,259
1,254
-5
Duration of unemployment
Less than 5 weeks
2,697
2,706
2,692
2,563
-129
5 to 14 weeks
3,102
2,669
2,864
2,869
5
15 to 26 weeks
1,756
1,950
1,896
1,788
-108
27 weeks and over
5,167
4,357
4,328
4,246
-82
Employed persons at work part time
Part time for economic reasons
8,245
7,904
8,226
8,245
19
Slack work or business conditions
5,319
4,841
5,193
5,177
-16
Could only find part-time work
2,568
2,721
2,652
2,665
13
Part time for noneconomic reasons
18,846
18,934
19,044
19,128
84
Persons not in the labor force (not seasonally adjusted)
Marginally attached to the labor force
2,529
2,164
2,582
2,414
–
Discouraged workers
852
780
1,027
988
–
– Over-the-month changes are not displayed for not seasonally adjusted data.
NOTE: Persons whose ethnicity is identified as Hispanic or Latino may be of any race. Detail for the seasonally adjusted data shown in this table will not necessarily add to totals because of the independent seasonal adjustment of the various series. Updated population controls are introduced annually with the release of January data.
ESTABLISHMENT DATA
Summary table B. Establishment data, seasonally adjusted
Footnotes (1) Includes other industries, not shown separately. (2) Data relate to production employees in mining and logging and manufacturing, construction employees in construction, and nonsupervisory employees in the service-providing industries. (3) The indexes of aggregate weekly hours are calculated by dividing the current month’s estimates of aggregate hours by the corresponding annual average aggregate hours. (4) The indexes of aggregate weekly payrolls are calculated by dividing the current month’s estimates of aggregate weekly payrolls by the corresponding annual average aggregate weekly payrolls. (5) Figures are the percent of industries with employment increasing plus one-half of the industries with unchanged employment, where 50 percent indicates an equal balance between industries with increasing and decreasing employment. (p) Preliminary
Frequently Asked Questions about Employment and Unemployment Estimates

1. Why are there two monthly measures of employment?

   The household survey and establishment survey both produce sample-based estimates
   of   employment, and both have strengths and limitations. The establishment survey
   employment series has a   smaller margin of error on the measurement of month-to-
   month change   than the household survey because of its much larger sample size. An
   over-the-month employment change of about 100,000 is statistically significant in
   the establishment survey, while the threshold for a statistically significant change
   in the household survey is about 400,000. However, the household survey has a more
   expansive scope than the establishment survey because it includes self-employed
   workers whose businesses are unincorporated, unpaid family workers, agricultural
   workers, and private household workers, who are excluded by the establishment survey.
   The household survey also provides estimates of employment for demographic groups.
   For more information on the differences between the two surveys, please visit
   www.bls.gov/web/empsit/ces_cps_trends.pdf.

2. Are undocumented immigrants counted in the surveys?

   It is likely that both surveys include at least some undocumented immigrants. However,
   neither the establishment nor the household survey is designed to identify the legal
   status of workers. Therefore, it is not possible to determine how many are counted in
   either survey. The establishment survey does not collect data on the legal status of
   workers. The household survey does include questions which identify the foreign and
   native born, but it does not include questions about the legal status of the foreign
   born. Data on the foreign and native born are published each month in table A-7 of
   The Employment Situation news release.

3. Why does the establishment survey have revisions?

   The establishment survey revises published estimates to improve its data series by
   incorporating additional information that was not available at the time of the
   initial publication of the estimates. The establishment survey revises its initial
   monthly estimates twice, in the immediately succeeding 2 months, to incorporate
   additional sample receipts from respondents in the survey and recalculated seasonal
   adjustment factors. For more information on the monthly revisions, please visit
   www.bls.gov/ces/cesrevinfo.htm.

   On an annual basis, the establishment survey incorporates a benchmark revision that
   re-anchors estimates to nearly complete employment counts available from unemployment
   insurance tax records. The benchmark helps to control for sampling and modeling errors
   in the estimates. For more information on the annual benchmark revision, please visit
   www.bls.gov/web/empsit/cesbmart.htm.

4. Does the establishment survey sample include small firms?

   Yes; about 40 percent of the establishment survey sample is comprised of business
   establishments with fewer than 20 employees. The establishment survey sample is
   designed to maximize the reliability of the statewide total nonfarm employment
   estimate; firms from all states, size classes, and industries are appropriately
   sampled to achieve that goal.

5. Does the establishment survey account for employment from new businesses?

   Yes; monthly establishment survey estimates include an adjustment to account for
   the net employment change generated by business births and deaths. The adjustment
   comes from an econometric model that forecasts the monthly net jobs impact of
   business births and deaths based on the actual past values of the net impact that
   can be observed with a lag from the Quarterly Census of Employment and Wages. The
   establishment survey uses modeling rather than sampling for this purpose because
   the survey is not immediately able to bring new businesses into the sample. There
   is an unavoidable lag between the birth of a new firm and its appearance on the
   sampling frame and availability for selection. BLS adds new businesses to the survey
   twice a year.

6. Is the count of unemployed persons limited to just those people receiving unemployment
   insurance benefits?

   No; the estimate of unemployment is based on a monthly sample survey of households.
   All persons who are without jobs and are actively seeking and available to work are
   included among the unemployed. (People on temporary layoff are included even if
   they do not actively seek work.) There is no requirement or question relating to
   unemployment insurance benefits in the monthly survey.

7. Does the official unemployment rate exclude people who want a job but are not currently
   looking for work?

   Yes; however, there are separate estimates of persons outside the labor force who
   want a job, including those who are not currently looking because they believe no
   jobs are available (discouraged workers). In addition, alternative measures of labor
   underutilization (some of which include discouraged workers and other groups not
   officially counted as unemployed) are published each month in table A-15 of The
   Employment Situation news release. For more information about these alternative
   measures, please visit www.bls.gov/cps/lfcharacteristics.htm#altmeasures.

8. How can unusually severe weather affect employment and hours estimates?

   In the establishment survey, the reference period is the pay period that includes
   the 12th of the month. Unusually severe weather is more likely to have an impact on
   average weekly hours than on employment. Average weekly hours are estimated for paid
   time during the pay period, including pay for holidays, sick leave, or other time off.
   The impact of severe weather on hours estimates typically, but not always, results in
   a reduction in average weekly hours. For example, some employees may be off work for
   part of the pay period and not receive pay for the time missed, while some workers,
   such as those dealing with cleanup or repair, may work extra hours.

   In order for severe weather conditions to reduce the estimate of payroll employment,
   employees have to be off work without pay for the entire pay period. Slightly more
   than 20 percent of all employees in the payroll survey sample have a weekly pay
   period. Employees who receive pay for any part of the pay period, even 1 hour, are
   counted in the payroll employment figures. It is not possible to quantify the effect
   of extreme weather on estimates of over-the-month change in employment.

   In the household survey, the reference period is generally the calendar week that
   includes the 12th of the month. Persons who miss the entire week's work for weather-
   related events are counted as employed whether or not they are paid for the time
   off. The household survey collects data on the number of persons who had a job but
   were not at work due to bad weather. It also provides a measure of the number of
   persons who usually work full time but had reduced hours. Current and historical
   data are available on the  household survey's most requested statistics page at
   http://data.bls.gov/cgi-bin/surveymost?ln.
Technical Note

   This news release presents statistics from two major surveys, the Current
Population Survey (CPS; household survey) and the Current Employment Statistics
survey (CES; establishment survey). The household survey provides information
on the labor force, employment, and unemployment that appears in the "A" tables,
marked HOUSEHOLD DATA. It is a sample survey of about 60,000 eligible households
conducted by the U.S. Census Bureau for the U.S. Bureau of Labor Statistics (BLS).

   The establishment survey provides information on employment, hours, and
earnings of employees on nonfarm payrolls; the data appear in the "B" tables,
marked ESTABLISHMENT DATA. BLS collects these data each month from the payroll
records of a sample of nonagricultural business establishments. Each month
the CES program surveys about 145,000 businesses and government agencies,
representing approximately 557,000 individual worksites, in order to provide
detailed industry data on employment, hours, and earnings of workers on nonfarm
payrolls. The active sample includes approximately one-third of all nonfarm
payroll employees.

   For both surveys, the data for a given month relate to a particular week or
pay period. In the household survey, the reference period is generally the
calendar week that contains the 12th day of the month. In the establishment
survey, the reference period is the pay period including the 12th, which may or
may not correspond directly to the calendar week.

Coverage, definitions, and differences between surveys

   Household survey. The sample is selected to reflect the entire civilian
noninstitutional population. Based on responses to a series of questions on
work and job search activities, each person 16 years and over in a sample
household is classified as employed, unemployed, or not in the labor force.

   People are classified as employed if they did any work at all as paid employees
during the reference week; worked in their own business, profession, or on their
own farm; or worked without pay at least 15 hours in a family business or farm.
People are also counted as employed if they were temporarily absent from their jobs
because of illness, bad weather, vacation, labor-management disputes, or personal
reasons.

   People are classified as unemployed if they meet all of the following criteria:
they had no employment during the reference week; they were available for work at
that time; and they made specific efforts to find employment sometime during the
4-week period ending with the reference week. Persons laid off from a job and
expecting recall need not be looking for work to be counted as unemployed. The
unemployment data derived from the household survey in no way depend upon the
eligibility for or receipt of unemployment insurance benefits.

   The civilian labor force is the sum of employed and unemployed persons.
Those persons not classified as employed or unemployed are not in the labor
force. The unemployment rate is the number unemployed as a percent of the
labor force. The labor force participation rate is the labor force as a
percent of the population, and the employment-population ratio is the
employed as a percent of the population. Additional information about the
household survey can be found at www.bls.gov/cps/documentation.htm.

   Establishment survey. The sample establishments are drawn from private
nonfarm businesses such as factories, offices, and stores, as well as
from federal, state, and local government entities. Employees on nonfarm
payrolls are those who received pay for any part of the reference pay
period, including persons on paid leave. Persons are counted in each job
they hold. Hours and earnings data are produced for the private sector for
all employees and for production and nonsupervisory employees. Production
and nonsupervisory employees are defined as production and related employees
in manufacturing and mining and logging, construction workers in construction,
and nonsupervisory employees in private service-providing industries.

   Industries are classified on the basis of an establishment’s principal
activity in accordance with the 2012 version of the North American Industry
Classification System. Additional information about the establishment survey
can be found at www.bls.gov/ces/.

   Differences in employment estimates. The numerous conceptual and methodological
differences between the household and establishment  surveys result in important
distinctions in the employment estimates derived from the surveys. Among these are:

   --The household survey includes agricultural workers, self-employed workers
     whose businesses are unincorporated, unpaid family workers, and private
     household workers among the employed. These groups are excluded from the
     establishment survey.

   --The household survey includes people on unpaid leave among the employed.
     The establishment survey does not.

   --The household survey is limited to workers 16 years of age and older.
     The establishment survey is not limited by age.

   --The household survey has no duplication of individuals, because
     individuals are counted only once, even if they hold more than one
     job. In the establishment survey, employees working at more than one
     job and thus appearing on more than one payroll are counted separately
     for each appearance.

Seasonal adjustment

   Over the course of a year, the size of the nation's labor force and the levels
of employment and unemployment undergo regularly occurring fluctuations. These
events may result from seasonal changes in weather, major holidays, and the opening
and closing of schools. The effect of such seasonal variation can be very large.

   Because these seasonal events follow a more or less regular pattern each year,
their influence on the level of a series can be tempered by adjusting for regular
seasonal variation. These adjustments make nonseasonal developments, such as
declines in employment or increases in the participation of women in the labor
force, easier to spot. For example, in the household survey, the large number of
youth entering the labor force each June is likely to obscure any other changes
that have taken place relative to May, making it difficult to determine if the
level of economic activity has risen or declined. Similarly, in the establishment
survey, payroll employment in education declines by about 20 percent at the end
of the spring term and later rises with the start of the fall term, obscuring the
underlying employment trends in the industry. Because seasonal employment changes
at the end and beginning of the school year can be estimated, the statistics can be
adjusted to make underlying employment patterns more discernable.  The seasonally
adjusted figures provide a more useful tool with which to analyze changes in
month-to-month economic activity.

   Many seasonally adjusted series are independently adjusted in both the household
and establishment surveys. However, the adjusted series for many major estimates,
such as total payroll employment, employment in most major sectors, total employment,
and unemployment are computed by aggregating independently adjusted component series.
For example, total unemployment is derived by summing the adjusted series for four
major age-sex components; this differs from the unemployment estimate that would be
obtained by directly adjusting the total or by combining
the duration, reasons, or more detailed age categories.

   For both the household and establishment surveys, a concurrent seasonal adjustment
methodology is used in which new seasonal factors are calculated each month using all
relevant data, up to and including the data for the current month. In the household
survey, new seasonal factors are used to adjust only the current month's data. In the
establishment survey, however, new seasonal factors are used each month to adjust the
three most recent monthly estimates. The prior 2 months are routinely revised to
incorporate additional sample reports and recalculated seasonal adjustment factors.
In both surveys, 5-year revisions to historical data are made once a year.

Reliability of the estimates

   Statistics based on the household and establishment surveys are subject to both
sampling and nonsampling error. When a sample, rather than the entire population,
is surveyed, there is a chance that the sample estimates may differ from the true
population values they represent. The component of this difference that occurs
because samples differ by chance is known as sampling error, and its variability
is measured by the standard error of the estimate. There is about a 90-percent
chance, or level of confidence, that an estimate based on a sample will differ by
no more than 1.6 standard errors from the true population value because of sampling
error. BLS analyses are generally conducted at the 90-percent level of confidence.

   For example, the confidence interval for the monthly change in total nonfarm
employment from the establishment survey is on the order of plus or minus 90,000.
Suppose the estimate of nonfarm employment increases by 50,000 from one month to
the next. The 90-percent confidence interval on the monthly change would range from
-40,000 to +140,000 (50,000 +/- 90,000). These figures do not mean that the sample
results are off by these magnitudes, but rather that there is about a 90-percent
chance that the true over-the-month change lies within this interval. Since this
range includes values of less than zero, we could not say with confidence that
nonfarm employment had, in fact, increased that month. If, however, the reported
nonfarm employment rise was 250,000, then all of the values within the 90- percent
confidence interval would be greater than zero. In this case, it is likely (at
least a 90-percent chance) that nonfarm employment had, in fact, risen that month.
At an unemployment rate of around 6.0 percent, the 90-percent confidence interval
for the monthly change in unemployment as measured by the household survey is
about +/- 300,000, and for the monthly change in the unemployment rate it is about
+/- 0.2 percentage point.

   In general, estimates involving many individuals or establishments have lower
standard errors (relative to the size of the estimate) than estimates which are based
on a small number of observations. The precision of estimates also is improved when
the data are cumulated over time, such as for quarterly and annual averages.

   The household and establishment surveys are also affected by nonsampling error,
which can occur for many reasons, including the failure to sample a segment of the
population, inability to obtain information for all respondents in the sample,
inability or unwillingness of respondents to provide correct information on a
timely basis, mistakes made by respondents, and errors made in the collection or
processing of the data.

   For example, in the establishment survey, estimates for the most recent 2 months
are based on incomplete returns; for this reason, these estimates are labeled
preliminary in the tables. It is only after two successive revisions to a monthly
estimate, when nearly all sample reports have been received, that the estimate is
considered final.

   Another major source of nonsampling error in the establishment survey is the
inability to capture, on a timely basis, employment generated by new firms. To
correct for this systematic underestimation of employment growth, an estimation
procedure with two components is used to account for business births. The first
component excludes employment losses from business deaths from sample-based
estimation in order to offset the missing employment gains from business births.
This is incorporated into the sample-based estimation procedure by simply not
reflecting sample units going out of business, but imputing to them the same
employment trend as the other firms in the sample. This procedure accounts for
most of the net birth/death employment.

   The second component is an ARIMA time series model designed to estimate the
residual net birth/death employment not accounted for by the imputation. The
historical time series used to create and test the ARIMA model was derived from
the unemployment insurance universe micro- level database, and reflects the actual
residual net of births and deaths over the past 5 years.

   The sample-based estimates from the establishment survey are adjusted once a
year (on a lagged basis) to universe counts of payroll employment obtained from
administrative records of the unemployment insurance program. The difference
between the March sample-based employment estimates and the March universe counts
is known as a benchmark revision, and serves as a rough proxy for total survey
error. The new benchmarks also incorporate changes in the classification of
industries. Over the past decade, absolute benchmark revisions for total nonfarm
employment have averaged 0.3 percent, with a range from -0.7 to 0.6 percent.

Other information

   Information in this release will be made available to sensory impaired
individuals upon request. Voice phone: (202) 691-5200; Federal Relay
Service: (800) 877-8339.
HOUSEHOLD DATA
Table A-1. Employment status of the civilian population by sex and age
Footnotes (1) The population figures are not adjusted for seasonal variation; therefore, identical numbers appear in the unadjusted and seasonally adjusted columns.
NOTE: Updated population controls are introduced annually with the release of January data.
HOUSEHOLD DATA
Table A-2. Employment status of the civilian population by race, sex, and age
Footnotes (1) The population figures are not adjusted for seasonal variation; therefore, identical numbers appear in the unadjusted and seasonally adjusted columns.
– Data not available.
NOTE: Estimates for the above race groups will not sum to totals shown in table A-1 because data are not presented for all races. Updated population controls are introduced annually with the release of January data.
HOUSEHOLD DATA
Table A-3. Employment status of the Hispanic or Latino population by sex and age
Footnotes (1) The population figures are not adjusted for seasonal variation; therefore, identical numbers appear in the unadjusted and seasonally adjusted columns.
– Data not available.
NOTE: Persons whose ethnicity is identified as Hispanic or Latino may be of any race. Updated population controls are introduced annually with the release of January data.
HOUSEHOLD DATA
Table A-4. Employment status of the civilian population 25 years and over by educational attainment
Footnotes (1) Includes persons with a high school diploma or equivalent. (2) Includes persons with bachelor’s, master’s, professional, and doctoral degrees.
NOTE: Updated population controls are introduced annually with the release of January data.
HOUSEHOLD DATA
Table A-5. Employment status of the civilian population 18 years and over by veteran status, period of service, and sex, not seasonally adjusted
[Numbers in thousands]
Employment status, veteran status, and period of service
Total
Men
Women
July
2012
July
2013
July
2012
July
2013
July
2012
July
2013
VETERANS, 18 years and over
Civilian noninstitutional population
21,163
21,384
19,349
19,159
1,814
2,225
Civilian labor force
10,925
10,923
9,845
9,529
1,080
1,395
Participation rate
51.6
51.1
50.9
49.7
59.5
62.7
Employed
10,173
10,221
9,171
8,918
1,002
1,303
Employment-population ratio
48.1
47.8
47.4
46.5
55.2
58.6
Unemployed
752
702
674
610
79
92
Unemployment rate
6.9
6.4
6.8
6.4
7.3
6.6
Not in labor force
10,238
10,461
9,504
9,630
734
830
Gulf War-era II veterans
Civilian noninstitutional population
2,453
2,728
2,056
2,197
397
530
Civilian labor force
1,945
2,155
1,683
1,800
263
355
Participation rate
79.3
79.0
81.9
81.9
66.1
67.0
Employed
1,771
1,989
1,524
1,661
247
328
Employment-population ratio
72.2
72.9
74.2
75.6
62.2
61.8
Unemployed
174
166
159
138
15
27
Unemployment rate
8.9
7.7
9.4
7.7
5.9
7.7
Not in labor force
507
573
373
397
135
175
Gulf War-era I veterans
Civilian noninstitutional population
3,158
3,291
2,668
2,664
489
627
Civilian labor force
2,599
2,713
2,237
2,208
361
504
Participation rate
82.3
82.4
83.8
82.9
73.8
80.5
Employed
2,428
2,572
2,098
2,093
330
479
Employment-population ratio
76.9
78.1
78.6
78.6
67.5
76.4
Unemployed
170
141
139
115
31
26
Unemployment rate
6.5
5.2
6.2
5.2
8.5
5.1
Not in labor force
559
578
431
456
128
122
World War II, Korean War, and Vietnam-era veterans
Civilian noninstitutional population
9,868
9,789
9,551
9,421
318
368
Civilian labor force
3,217
2,922
3,125
2,835
92
87
Participation rate
32.6
29.9
32.7
30.1
29.1
23.7
Employed
3,020
2,727
2,932
2,644
88
84
Employment-population ratio
30.6
27.9
30.7
28.1
27.7
22.7
Unemployed
197
195
193
192
4
4
Unemployment rate
6.1
6.7
6.2
6.8
4.6
4.0
Not in labor force
6,652
6,867
6,426
6,586
225
281
Veterans of other service periods
Civilian noninstitutional population
5,684
5,576
5,074
4,876
610
700
Civilian labor force
3,164
3,133
2,800
2,685
364
448
Participation rate
55.7
56.2
55.2
55.1
59.7
64.0
Employed
2,953
2,933
2,617
2,520
336
413
Employment-population ratio
52.0
52.6
51.6
51.7
55.1
58.9
Unemployed
211
200
183
165
28
36
Unemployment rate
6.7
6.4
6.5
6.1
7.7
7.9
Not in labor force
2,520
2,443
2,274
2,191
246
252
NONVETERANS, 18 years and over
Civilian noninstitutional population
213,366
215,592
93,604
94,951
119,762
120,641
Civilian labor force
142,848
143,519
72,405
73,049
70,443
70,470
Participation rate
66.9
66.6
77.4
76.9
58.8
58.4
Employed
130,997
133,021
66,608
67,722
64,389
65,299
Employment-population ratio
61.4
61.7
71.2
71.3
53.8
54.1
Unemployed
11,850
10,498
5,797
5,327
6,054
5,171
Unemployment rate
8.3
7.3
8.0
7.3
8.6
7.3
Not in labor force
70,518
72,072
21,199
21,902
49,319
50,171
NOTE: Veterans served on active duty in the U.S. Armed Forces and were not on active duty at the time of the survey. Nonveterans never served on active duty in the U.S. Armed Forces. Veterans could have served anywhere in the world during these periods of service: Gulf War era II (September 2001-present), Gulf War era I (August 1990-August 2001), Vietnam era (August 1964-April 1975), Korean War (July 1950-January 1955), World War II (December 1941-December 1946), and other service periods (all other time periods). Veterans who served in more than one wartime period are classified only in the most recent one. Veterans who served during one of the selected wartime periods and another period are classified only in the wartime period. Beginning with data for January 2013, estimates for veterans incorporate population controls derived from the updated Department of Veterans Affairs’ population model.
HOUSEHOLD DATA
Table A-6. Employment status of the civilian population by sex, age, and disability status, not seasonally adjusted
[Numbers in thousands]
Employment status, sex, and age
Persons with a disability
Persons with no disability
July
2012
July
2013
July
2012
July
2013
TOTAL, 16 years and over
Civilian noninstitutional population
28,007
28,406
215,346
217,349
Civilian labor force
5,791
5,778
150,735
151,418
Participation rate
20.7
20.3
70.0
69.7
Employed
5,004
4,926
138,122
140,186
Employment-population ratio
17.9
17.3
64.1
64.5
Unemployed
787
852
12,613
11,231
Unemployment rate
13.6
14.7
8.4
7.4
Not in labor force
22,216
22,628
64,611
65,932
Men, 16 to 64 years
Civilian labor force
2,612
2,638
76,636
76,858
Participation rate
34.4
35.3
83.9
83.6
Employed
2,289
2,240
70,401
71,084
Employment-population ratio
30.2
30.0
77.0
77.3
Unemployed
323
398
6,235
5,774
Unemployment rate
12.4
15.1
8.1
7.5
Not in labor force
4,971
4,841
14,742
15,073
Women, 16 to 64 years
Civilian labor force
2,207
2,188
67,470
67,576
Participation rate
28.7
28.3
71.2
71.0
Employed
1,817
1,778
61,567
62,468
Employment-population ratio
23.6
23.0
64.9
65.7
Unemployed
390
410
5,903
5,108
Unemployment rate
17.7
18.7
8.7
7.6
Not in labor force
5,487
5,556
27,352
27,574
Both sexes, 65 years and over
Civilian labor force
973
953
6,629
6,984
Participation rate
7.6
7.2
22.7
23.1
Employed
898
908
6,155
6,634
Employment-population ratio
7.1
6.9
21.1
21.9
Unemployed
74
44
474
350
Unemployment rate
7.6
4.7
7.2
5.0
Not in labor force
11,758
12,232
22,517
23,285
NOTE: A person with a disability has at least one of the following conditions: is deaf or has serious difficulty hearing; is blind or has serious difficulty seeing even when wearing glasses; has serious difficulty concentrating, remembering, or making decisions because of a physical, mental, or emotional condition; has serious difficulty walking or climbing stairs; has difficulty dressing or bathing; or has difficulty doing errands alone such as visiting a doctor’s office or shopping because of a physical, mental, or emotional condition. Updated population controls are introduced annually with the release of January data.
HOUSEHOLD DATA
Table A-7. Employment status of the civilian population by nativity and sex, not seasonally adjusted
[Numbers in thousands]
Employment status and nativity
Total
Men
Women
July
2012
July
2013
July
2012
July
2013
July
2012
July
2013
Foreign born, 16 years and over
Civilian noninstitutional population
37,627
37,941
18,428
18,391
19,199
19,550
Civilian labor force
25,180
25,382
14,575
14,634
10,606
10,748
Participation rate
66.9
66.9
79.1
79.6
55.2
55.0
Employed
23,211
23,689
13,553
13,767
9,657
9,922
Employment-population ratio
61.7
62.4
73.5
74.9
50.3
50.8
Unemployed
1,970
1,693
1,021
867
948
825
Unemployment rate
7.8
6.7
7.0
5.9
8.9
7.7
Not in labor force
12,446
12,559
3,853
3,757
8,593
8,802
Native born, 16 years and over
Civilian noninstitutional population
205,727
207,815
98,954
100,204
106,774
107,611
Civilian labor force
131,346
131,814
68,979
69,331
62,367
62,483
Participation rate
63.8
63.4
69.7
69.2
58.4
58.1
Employed
119,916
121,424
63,137
63,803
56,778
57,621
Employment-population ratio
58.3
58.4
63.8
63.7
53.2
53.5
Unemployed
11,430
10,390
5,842
5,528
5,589
4,862
Unemployment rate
8.7
7.9
8.5
8.0
9.0
7.8
Not in labor force
74,381
76,001
29,975
30,873
44,407
45,128
NOTE: The foreign born are those residing in the United States who were not U.S. citizens at birth. That is, they were born outside the United States or one of its outlying areas such as Puerto Rico or Guam, to parents neither of whom was a U.S. citizen. The native born are persons who were born in the United States or one of its outlying areas such as Puerto Rico or Guam or who were born abroad of at least one parent who was a U.S. citizen. Updated population controls are introduced annually with the release of January data.
HOUSEHOLD DATA
Table A-8. Employed persons by class of worker and part-time status
Footnotes (1) Includes self-employed workers whose businesses are incorporated. (2) Refers to those who worked 1 to 34 hours during the survey reference week and excludes employed persons who were absent from their jobs for the entire week. (3) Refers to those who worked 1 to 34 hours during the reference week for an economic reason such as slack work or unfavorable business conditions, inability to find full-time work, or seasonal declines in demand. (4) Refers to persons who usually work part time for noneconomic reasons such as childcare problems, family or personal obligations, school or training, retirement or Social Security limits on earnings, and other reasons. This excludes persons who usually work full time but worked only 1 to 34 hours during the reference week for reasons such as vacations, holidays, illness, and bad weather.
– Data not available.
NOTE: Detail for the seasonally adjusted data shown in this table will not necessarily add to totals because of the independent seasonal adjustment of the various series. Updated population controls are introduced annually with the release of January data.
HOUSEHOLD DATA
Table A-9. Selected employment indicators
Footnotes (1) Employed full-time workers are persons who usually work 35 hours or more per week. (2) Employed part-time workers are persons who usually work less than 35 hours per week.
– Data not available.
NOTE: Detail for the seasonally adjusted data shown in this table will not necessarily add to totals because of the independent seasonal adjustment of the various series. Updated population controls are introduced annually with the release of January data.
HOUSEHOLD DATA
Table A-10. Selected unemployment indicators, seasonally adjusted
Footnotes (1) Not seasonally adjusted. (2) Full-time workers are unemployed persons who have expressed a desire to work full time (35 hours or more per week) or are on layoff from full-time jobs. (3) Part-time workers are unemployed persons who have expressed a desire to work part time (less than 35 hours per week) or are on layoff from part-time jobs.
NOTE: Detail for the seasonally adjusted data shown in this table will not necessarily add to totals because of the independent seasonal adjustment of the various series. Updated population controls are introduced annually with the release of January data.
HOUSEHOLD DATA
Table A-11. Unemployed persons by reason for unemployment
[Numbers in thousands]
Reason
Not seasonally adjusted
Seasonally adjusted
July
2012
June
2013
July
2013
July
2012
Mar.
2013
Apr.
2013
May
2013
June
2013
July
2013
NUMBER OF UNEMPLOYED
Job losers and persons who completed temporary jobs
7,151
5,939
5,934
7,106
6,329
6,410
6,147
6,119
5,921
On temporary layoff
1,525
1,139
1,337
1,429
1,107
1,170
997
1,199
1,221
Not on temporary layoff
5,626
4,800
4,597
5,677
5,223
5,240
5,151
4,920
4,700
Permanent job losers
4,377
3,639
3,548
4,368
3,959
3,976
3,822
3,700
3,589
Persons who completed temporary jobs
1,248
1,161
1,049
1,308
1,264
1,264
1,329
1,220
1,111
Job leavers
897
981
996
879
986
864
944
1,030
979
Reentrants
3,579
3,600
3,450
3,374
3,176
3,151
3,333
3,291
3,258
New entrants
1,773
1,728
1,703
1,299
1,316
1,280
1,268
1,259
1,254
PERCENT DISTRIBUTION
Job losers and persons who completed temporary jobs
53.4
48.5
49.1
56.1
53.6
54.8
52.6
52.3
51.9
On temporary layoff
11.4
9.3
11.1
11.3
9.4
10.0
8.5
10.2
10.7
Not on temporary layoff
42.0
39.2
38.0
44.8
44.2
44.8
44.1
42.1
41.2
Job leavers
6.7
8.0
8.2
6.9
8.4
7.4
8.1
8.8
8.6
Reentrants
26.7
29.4
28.6
26.7
26.9
26.9
28.5
28.1
28.5
New entrants
13.2
14.1
14.1
10.3
11.1
10.9
10.8
10.8
11.0
UNEMPLOYED AS A PERCENT OF THE
CIVILIAN LABOR FORCE
Job losers and persons who completed temporary jobs
4.6
3.8
3.8
4.6
4.1
4.1
3.9
3.9
3.8
Job leavers
0.6
0.6
0.6
0.6
0.6
0.6
0.6
0.7
0.6
Reentrants
2.3
2.3
2.2
2.2
2.0
2.0
2.1
2.1
2.1
New entrants
1.1
1.1
1.1
0.8
0.8
0.8
0.8
0.8
0.8
NOTE: Updated population controls are introduced annually with the release of January data.
HOUSEHOLD DATA
Table A-12. Unemployed persons by duration of unemployment
[Numbers in thousands]
Duration
Not seasonally adjusted
Seasonally adjusted
July
2012
June
2013
July
2013
July
2012
Mar.
2013
Apr.
2013
May
2013
June
2013
July
2013
NUMBER OF UNEMPLOYED
Less than 5 weeks
3,021
3,569
2,842
2,697
2,464
2,474
2,706
2,692
2,563
5 to 14 weeks
3,585
2,592
3,348
3,102
2,838
2,848
2,669
2,864
2,869
15 weeks and over
6,794
6,086
5,892
6,923
6,348
6,320
6,306
6,225
6,034
15 to 26 weeks
1,547
1,841
1,570
1,756
1,737
1,967
1,950
1,896
1,788
27 weeks and over
5,247
4,245
4,322
5,167
4,611
4,353
4,357
4,328
4,246
Average (mean) duration, in weeks
37.4
34.1
35.3
38.8
37.1
36.5
36.9
35.6
36.6
Median duration, in weeks
15.2
14.3
13.8
16.8
18.1
17.5
17.3
16.3
15.7
PERCENT DISTRIBUTION
Less than 5 weeks
22.5
29.1
23.5
21.2
21.1
21.3
23.2
22.9
22.4
5 to 14 weeks
26.8
21.2
27.7
24.4
24.4
24.5
22.8
24.3
25.0
15 weeks and over
50.7
49.7
48.8
54.4
54.5
54.3
54.0
52.8
52.6
15 to 26 weeks
11.5
15.0
13.0
13.8
14.9
16.9
16.7
16.1
15.6
27 weeks and over
39.2
34.7
35.8
40.6
39.6
37.4
37.3
36.7
37.0
NOTE: Updated population controls are introduced annually with the release of January data.
HOUSEHOLD DATA
Table A-13. Employed and unemployed persons by occupation, not seasonally adjusted
Agriculture and related private wage and salary workers
131
97
7.9
6.5
Government workers
1,182
1,073
5.7
5.3
Self-employed workers, unincorporated, and unpaid family workers
623
528
5.9
5.0
Footnotes (1) Persons with no previous work experience and persons whose last job was in the U.S. Armed Forces are included in the unemployed total.
NOTE: Updated population controls are introduced annually with the release of January data.
HOUSEHOLD DATA
Table A-15. Alternative measures of labor underutilization
[Percent]
Measure
Not seasonally adjusted
Seasonally adjusted
July
2012
June
2013
July
2013
July
2012
Mar.
2013
Apr.
2013
May
2013
June
2013
July
2013
U-1 Persons unemployed 15 weeks or longer, as a percent of the civilian labor force
4.3
3.9
3.7
4.5
4.1
4.1
4.1
4.0
3.9
U-2 Job losers and persons who completed temporary jobs, as a percent of the civilian labor force
4.6
3.8
3.8
4.6
4.1
4.1
3.9
3.9
3.8
U-3 Total unemployed, as a percent of the civilian labor force (official unemployment rate)
8.6
7.8
7.7
8.2
7.6
7.5
7.6
7.6
7.4
U-4 Total unemployed plus discouraged workers, as a percent of the civilian labor force plus discouraged workers
9.1
8.4
8.3
8.7
8.1
8.0
8.0
8.2
8.0
U-5 Total unemployed, plus discouraged workers, plus all other persons marginally attached to the labor force, as a percent of the civilian labor force plus all persons marginally attached to the labor force
10.0
9.3
9.1
9.7
8.9
8.9
8.8
9.1
8.8
U-6 Total unemployed, plus all persons marginally attached to the labor force, plus total employed part time for economic reasons, as a percent of the civilian labor force plus all persons marginally attached to the labor force
15.2
14.6
14.3
14.9
13.8
13.9
13.8
14.3
14.0
NOTE: Persons marginally attached to the labor force are those who currently are neither working nor looking for work but indicate that they want and are available for a job and have looked for work sometime in the past 12 months. Discouraged workers, a subset of the marginally attached, have given a job-market related reason for not currently looking for work. Persons employed part time for economic reasons are those who want and are available for full-time work but have had to settle for a part-time schedule. Updated population controls are introduced annually with the release of January data.
HOUSEHOLD DATA
Table A-16. Persons not in the labor force and multiple jobholders by sex, not seasonally adjusted
Footnotes (1) Data refer to persons who want a job, have searched for work during the prior 12 months, and were available to take a job during the reference week, but had not looked for work in the past 4 weeks. (2) Includes those who did not actively look for work in the prior 4 weeks for reasons such as thinks no work available, could not find work, lacks schooling or training, employer thinks too young or old, and other types of discrimination. (3) Includes those who did not actively look for work in the prior 4 weeks for such reasons as school or family responsibilities, ill health, and transportation problems, as well as a number for whom reason for nonparticipation was not determined. (4) Includes a small number of persons who work part time on their primary job and full time on their secondary job(s), not shown separately.
NOTE: Updated population controls are introduced annually with the release of January data.
ESTABLISHMENT DATA
Table B-1. Employees on nonfarm payrolls by industry sector and selected industry detail
Museums, historical sites, and similar institutions
148.4
141.8
147.3
147.7
133.5
136.5
135.3
134.0
-1.3
Amusements, gambling, and recreation
1,693.2
1,506.3
1,704.6
1,747.7
1,427.3
1,462.7
1,481.8
1,477.0
-4.8
Accommodation and food services
12,119.3
12,272.3
12,480.8
12,521.2
11,782.3
12,103.9
12,142.5
12,175.6
33.1
Accommodation
1,965.7
1,835.8
1,932.7
1,979.8
1,815.7
1,829.9
1,833.5
1,828.2
-5.3
Food services and drinking places
10,153.6
10,436.5
10,548.1
10,541.4
9,966.6
10,274.0
10,309.0
10,347.4
38.4
Other services
5,507
5,507
5,549
5,549
5,439
5,486
5,483
5,481
-2
Repair and maintenance
1,199.6
1,207.1
1,203.6
1,201.7
1,192.8
1,201.3
1,195.7
1,195.0
-0.7
Personal and laundry services
1,322.7
1,346.7
1,350.7
1,343.5
1,313.2
1,332.4
1,334.1
1,334.5
0.4
Membership associations and organizations
2,985.1
2,953.2
2,994.4
3,003.6
2,933.1
2,952.2
2,952.7
2,951.1
-1.6
Government
20,622
22,242
21,802
20,583
21,891
21,859
21,851
21,852
1
Federal
2,826.0
2,757.0
2,761.0
2,761.0
2,805.0
2,758.0
2,748.0
2,746.0
-2.0
Federal, except U.S. Postal Service
2,213.2
2,168.2
2,171.9
2,170.0
2,194.6
2,166.1
2,156.4
2,157.2
0.8
U.S. Postal Service
612.9
589.0
589.1
591.0
610.0
592.0
591.6
588.6
-3.0
State government
4,740.0
5,070.0
4,802.0
4,716.0
5,042.0
5,037.0
5,028.0
5,025.0
-3.0
State government education
2,058.1
2,408.7
2,126.0
2,046.4
2,377.8
2,383.1
2,376.2
2,372.8
-3.4
State government, excluding education
2,682.3
2,661.7
2,676.1
2,669.6
2,664.4
2,653.7
2,651.9
2,652.3
0.4
Local government
13,056.0
14,415.0
14,239.0
13,106.0
14,044.0
14,064.0
14,075.0
14,081.0
6.0
Local government education
6,550.7
8,139.0
7,766.0
6,573.1
7,765.7
7,776.0
7,774.1
7,784.2
10.1
Local government, excluding education
6,505.3
6,275.5
6,473.3
6,533.1
6,278.3
6,287.9
6,301.0
6,297.0
-4.0
Footnotes (1) Includes other industries, not shown separately. (2) Includes motor vehicles, motor vehicle bodies and trailers, and motor vehicle parts. (3) Includes ambulatory health care services, hospitals, and nursing and residential care facilities. (p) Preliminary
ESTABLISHMENT DATA
Table B-2. Average weekly hours and overtime of all employees on private nonfarm payrolls by industry sector, seasonally adjusted
ESTABLISHMENT DATA
Table B-4. Indexes of aggregate weekly hours and payrolls for all employees on private nonfarm payrolls by industry sector, seasonally adjusted
Footnotes (1) The indexes of aggregate weekly hours are calculated by dividing the current month’s estimates of aggregate hours by the corresponding 2007 annual average aggregate hours. Aggregate hours estimates are the product of estimates of average weekly hours and employment. (2) The indexes of aggregate weekly payrolls are calculated by dividing the current month’s estimates of aggregate weekly payrolls by the corresponding 2007 annual average aggregate weekly payrolls. Aggregate payrolls estimates are the product of estimates of average hourly earnings, average weekly hours, and employment. (p) Preliminary
ESTABLISHMENT DATA
Table B-5. Employment of women on nonfarm payrolls by industry sector, seasonally adjusted
ESTABLISHMENT DATA
Table B-6. Employment of production and nonsupervisory employees on private nonfarm payrolls by industry sector, seasonally adjusted(1)
Footnotes (1) Data relate to production employees in mining and logging and manufacturing, construction employees in construction, and nonsupervisory employees in the service-providing industries. These groups account for approximately four-fifths of the total employment on private nonfarm payrolls. (p) Preliminary
ESTABLISHMENT DATA
Table B-7. Average weekly hours and overtime of production and nonsupervisory employees on private nonfarm payrolls by industry sector, seasonally adjusted(1)
Footnotes (1) Data relate to production employees in mining and logging and manufacturing, construction employees in construction, and nonsupervisory employees in the service-providing industries. These groups account for approximately four-fifths of the total employment on private nonfarm payrolls. (p) Preliminary
ESTABLISHMENT DATA
Table B-8. Average hourly and weekly earnings of production and nonsupervisory employees on private nonfarm payrolls by industry sector, seasonally adjusted(1)
Footnotes (1) Data relate to production employees in mining and logging and manufacturing, construction employees in construction, and nonsupervisory employees in the service-providing industries. These groups account for approximately four-fifths of the total employment on private nonfarm payrolls. (p) Preliminary
ESTABLISHMENT DATA
Table B-9. Indexes of aggregate weekly hours and payrolls for production and nonsupervisory employees on private nonfarm payrolls by industry sector, seasonally adjusted(1)
Footnotes (1) Data relate to production employees in mining and logging and manufacturing, construction employees in construction, and nonsupervisory employees in the service-providing industries. These groups account for approximately four-fifths of the total employment on private nonfarm payrolls. (2) The indexes of aggregate weekly hours are calculated by dividing the current month’s estimates of aggregate hours by the corresponding 2002 annual average aggregate hours. Aggregate hours estimates are the product of estimates of average weekly hours and employment. (3) The indexes of aggregate weekly payrolls are calculated by dividing the current month’s estimates of aggregate weekly payrolls by the corresponding 2002 annual average aggregate weekly payrolls. Aggregate payrolls estimates are the product of estimates of average hourly earnings, average weekly hours, and employment. (p) Preliminary
Series Id:           LNS14000006
Seasonally Adjusted
Series title:        (Seas) Unemployment Rate - Black or African American
Labor force status:  Unemployment rate
Type of data:        Percent or rate
Age:                 16 years and over
Race:                Black or African American
Segment 0: How Much Did The Piers Morgan Show Pay Rachel Jeantel For Exclusive Interview? $100,000 — New Theory — Trayvon Martin Thought George Zimmerman Gay Rapist Cop or Security Guard — Creepy Ass Cracka? — Videos
It’s a Great Day For ME to whoop somebody’s ASS !!!
Rachel Jeantel explains pounding Zimmerman’s head on the ground as no biggie & was just ‘whoop-ass’
Teach the children well ( with lyrics) – Crosby Stills
Teach the children well ( with lyrics) – Crosby Stills
You who are on the road
Must have a code that you can live by
And so become yourself
Because the past is just a good bye.
Teach your children well,
Their father’s hell did slowly go by,
And feed them on your dreams
The one they picked, the one you’ll know by.
Don’t you ever ask them why, if they told you, you would cry,
So just look at them and sigh and know they love you.
And you, of tender years,
Can’t know the fears that your elders grew by,
And so please help them with your youth,
They seek the truth before they can die.
Counter Melody To Above Verse:
Can you hear and do you care and
Cant you see we must be free to
Teach your children what you believe in.
Make a world that we can live in.
Teach your parents well,
Their children’s hell will slowly go by,
And feed them on your dreams
The one they picked, the one you’ll know by.
Don’t you ever ask them why, if they told you, you would cry,
So just look at them and sigh and know they love you.
Rachel Jeantel: Zimmerman Might Have Been A Gay “Rapist”
Rachel Jeantel Tells Piers She And Trayvon Feared Zimmerman Might Be Gay Rapist
RACHEL JEANTEL, FRIEND OF TRAYVON: Well, the jury, they see their facts. My thoughts of the jury, they old, that’s old school people. We in a new school, our generation, my generation. So —
PIERS MORGAN: Let’s talk about ‘creepy ass cracka.’ People have said that that is a phrase used by black people, cracka, to describe a white person. Is that true?
JEANTEL: No! Like I said —
MORGAN: How do you spell it, first of all?
JEANTEL: Cracka.
MORGAN: There’s no ‘e-r,’ right?
JEANTEL: No, it’s an ‘a’ at the end.
MORGAN: C-r-a-c-k-a.
JEANTEL: Yeah. And that’s a person who act like they’re a police [officer], who, like a security guard who acting like — that’s what I said to them. Trayvon said creepy ass cracka.
MORGAN: It means he thought it was a police or a security guard?
JEANTEL: Yeah, he acting like the police. And then he keep telling me that the man is still watching him. So, if it was a security guard or a policeman, they would come up to Trayvon and say, ‘Do you have a problem? Do you need help?’ You know, like normal people.
Rachel Jeantel Piers Morgan Inteview Part 1 Weed Made Trayvon hungry
Rachel Jeantel Piers Morgan Interview Part 2
Piers on what Rachel Jeantel didn’t say
Jeantel, who created a media firestorm with her highly-polarizing testimony towards the beginning of the trial, appeared on Piers Morgan Live alongside her attorney. She described her reaction to Zimmerman’s acquittal as “disappointed, upset and angry” and called the jury’s assessment of what happened “just B.S.”
Asked about what Trayvon Martin was like as a friend, Jeantel described him as a “calm, chill, loving person” and said she never saw him get “aggressive” or “lose his temper.” She said that the defense’s attempts to portray Martin as a “thug” were unfounded and defended his relatively mild drug use. “Weed don’t make him go crazy,” she said, “it just makes him go hungry.”
Jeantel also responded to the massive mockery she received in social media for the way she speaks, explaining that she was born with an under-bite that has made it difficult for her to speak clearly. When Morgan asked if she’d been bullied for her condition, she simply responded, “Look at me,” to laughter from the studio audience.
Morgan attempted to get Jeantel to offer her opinion of defense attorney Don West, who many claimed was condescending towards her when she was on the stand. Jeantel shook her head, declining to say anything bad about the man given her “Christian” upbringing.
EPIC!! Rachel Jeantel Explains The Difference Between ‘N*gga’ And ‘N*gger’ To Piers Morgan HAHA!!
Rush Limbaugh: Thanks To Rachel Jeantel I Can Say ‘N*gga With An A’ Now Because ‘It’s Not Racist’
Michael Savage Attacks Eric Holder and Stupid Rachel Jeantel Interview with Piers Morgan
The Five Rips Rachel Jeantel For Creepy-A** Cracker Comment: If This Is Their Star Witness Good Luck
N*gger! Cracker!! Explosive CNN Panel Dedicates Whole Show To Discuss These Racist Words
Rachel Jeantel Caught in LIES and Speaking Confusing Ebonics Trayvon Martin Friend
NOT GUILTY George Zimmerman
George Zimmerman’s story in his own words
Crosby, Stills & Nash (Live) – Love The One You’re With
When you’re down and confused
And you don’t remember who you’re talking to
Concentration slip away
Because your baby, is so far away
Well there’s a road and a distant love
And the eagle flies with the dove
And if you cant be with the one you love.. honey
Love the one you’re with Love the one you’re with
Love the one you’re with Love the one you’re with
Don’t be angry don’t be sad
Don’t sit cryin’ over good times you had
There’s a girl right next to you
And she’s just waiting for something to do
And there’s a road and a distant love
And the eagle flies with the dove
And if you cant be with the one you love honey
Find more similar lyrics on http://mp3lyrics.com/dDDLove the one you’re with Love the one you’re with
Love the one you’re with
Do it do it do it
(Instrumental)
Love the one you’re with love the one you’re with
Love the one you’re with love the one you’re with
Turn your heartache right into joy
She’s a girl and you’re a boy
Get it together, make it tonight,
You ain’t gonna need any more advice
And there’s a road and a distant love
And the eagle flies with the dove
And if you cant be with the one you love honey
Love the one you’re with Love the one you’re with
Love the one you’re with Love the one you’re with
Segment 4: No Such Agency — NSA — National Security Agency — Threat To The Liberty and Privacy of The American People — None Of Their Damn Business — Still Trust The Federal Government? — Videos
“Those who would give up essential liberty to purchase a little temporary safety deserve neither liberty nor safety.”
~ Benjamin Franklin, Historical Review of Pennsylvania, 1759
National Security Agency
Obama the Hypocrite on NSA, FISA, Patriot Act
Pres. Obama’s response to the 2013 NSA PRISM spying scandal
Do Politicians All Agree Wiretapping Is In the Peoples Interest?
Glenn Becks “SURVEILLANCE STATE” (Must Viewing)
Glenn Greenwald Details ‘Menacing’ Reach Of NSA’s Invasion Of Google, Facebook, Apple Servers
6/6/13 Krauthammer on the NSA-Verizon scandal
NSA tracking Verizon phone calls
Reporter who broke the story tells CNN’s Jake Tapper the government is engaged in ‘unthinkable types of surveillance.’
A Massive Surveillance State: Glenn Greenwald Exposes Massive NSA Program Collecting Calls, Emails
Judge Napolitano On NSA Spying: Most Extraordinarily Broad Search Warrant Ever Issued In US History
US admits monitoring internet firms’ servers [1]
US admits monitoring internet firms’ servers [2]
NSA Admits Tapping Google And Facebook Servers
Ted Cruz Fires At Obama Administration ‘They View Constitution As A Pesky Obstruction’
NSA Spying on All Americans Part 1
NSA spying on All Americans Part 2
Dershowitz: Don’t overreact to NSA acts
NSA Secretly Collected Millions of Phone Records
he National Security Agency has secretly collected data about millions of domestic and international calls by Verizon customers. Jeffrey Brown gets debate on the privacy and civil liberty concerns from Kate Martin of the Center for National Security Studies and former NSA official Col. Cedric Leighton.
NSA Whistleblowers: “All U.S. Citizens” Targeted By Surveillance Program, Not Just Verizon Customers
Chocking Revelation!!! – Chaos In The Federal Government – NSA, Can You Hear Me Now? – O’Reilly
Government Data Mining: Impossible to Escape?
Big Brother & Your Money – Obama Admin Plans To Give Full Access To Intel, To American’s Finance
NSA Secretly Storing Verizon Calls: Report – White House Calls Program ‘Critcal’
Complete News – NSA Collects Phone Records on Millions
NSA Spying: Sweeping US data-mining program revealed
NSA Spying On Americans Verizon – Obama House Scandals- Newt Gingrich – Hannity
Shep Smith And Judge Napolitano Rail Against NSA Abuse: ‘We’re Not Letting This Go.’
Obama Orders Verizon to Spy on Americans
BREAKING! Obama’s NSA Collecting Phone Records Of Millions Of Americans Daily
“The NSA Is Lying”: U.S. Government Has Copies of Most of Your Emails Says NSA Whistleblower
Inside NSA – The National Security Agency – Documentary
James Bamford: Inside the NSA’s Largest Secret Domestic Spy Center
Whistle Blower Threatened with 35 Years in Prison, Warns of Developing Tyranny
NSA Whistleblower Thomas Drake speaks at National Press Club – March 15, 2013
Jon Stewart Tears Apart Obama, DOJ For Prosecuting Whistleblowers And Potheads But Not Bankers
National Security Agency Whistleblower William Binney on Growing State Surveillance
NSA whistleblower William Binney Keynote at HOPE Number Nine
NSA whistleblower exposes Obama’s secrets
NSA Whistleblower Thomas Drake Prevails in Unprecedented Obama Admin Crackdown
Obama’s NSA: Close to Knowing All About Us
What You Should Know About The New NSA Utah Data Center
The Utah Data Center
NSA Building Colossal New Data Center: Spying on Americans
NSA Utah Data Spy Center Revealed
DEA pushes for warrantless access to your medical records.
Glenn Greenwald on the High Cost of Government Secrecy
Glenn Greenwald on Domestic Surveillance: NSA Warrantless Wiretapping Controversy (2006)
Glenn Greenwald (born March 6, 1967) is an American political journalist, lawyer, columnist, blogger, and author. In August 2012, he left Salon.com, where he was a columnist, to become a columnist at the US edition of The Guardian newspaper, to which he has contributed since June 2011. Politically, Greenwald described himself as independent when he first began writing about politics in 2005,[6] though others now see him as a liberal or progressive.
Greenwald worked as a constitutional and civil rights litigator before becoming a contributor (columnist and blogger) to Salon.com, where he focused on political and legal topics.[12] He has also contributed to other newspapers and political news magazines, including The New York Times,[13][14][15] the Los Angeles Times,[16] The American Conservative,[17] The National Interest,[18] and In These Times.[19][20]
Greenwald has written four books, three of which have been New York Times bestsellers: How Would a Patriot Act? (2006); A Tragic Legacy (2007), and With Liberty and Justice for Some: How the Law Is Used to Destroy Equality and Protect the Powerful, released in October 2011. He also wrote Great American Hypocrites (2008).
Greenwald has received awards including the first Izzy Award for independent journalism, in 2009,[21] and the 2010 Online Journalism Award for Best Commentary.[22] Greenwald is a frequent speaker on college campuses, including Harvard Law School, Yale Law School, the University of Pennsylvania, Brown University, UCLA School of Law, the University of Wisconsin, the University of Maryland and others. He also appears on various radio and television programs as a guest political pundit.
Challenging the Surveillance State – Glenn Greenwald
122712 – Sen. Rand Paul Discusses FISA Amendment
Rand Paul: ‘Appalled’ At NSA’s Violation Of The Bill Of Rights – Yahoo News 6/6/2013
NSA taps in to internet giants’ systems to mine user data, secret files reveal
• Top secret PRISM program claims direct access to servers of firms including Google, Facebook and Apple
• Companies deny any knowledge of program in operation since 2007
Glenn Greenwald and Ewen MacAskill
The National Security Agency has obtained direct access to the systems of Google, Facebook, Apple and other US internet giants, according to a top secret document obtained by the Guardian.
The NSA access is part of a previously undisclosed program called PRISM, which allows officials to collect material including search history, the content of emails, file transfers and live chats, the document says.
The Guardian has verified the authenticity of the document, a 41-slide PowerPoint presentation – classified as top secret with no distribution to foreign allies – which was apparently used to train intelligence operatives on the capabilities of the program. The document claims “collection directly from the servers” of major US service providers.
Although the presentation claims the program is run with the assistance of the companies, all those who responded to a Guardian request for comment on Thursday denied knowledge of any such program.
In a statement, Google said: “Google cares deeply about the security of our users’ data. We disclose user data to government in accordance with the law, and we review all such requests carefully. From time to time, people allege that we have created a government ‘back door’ into our systems, but Google does not have a back door for the government to access private user data.”
Several senior tech executives insisted that they had no knowledge of PRISM or of any similar scheme. They said they would never have been involved in such a program. “If they are doing this, they are doing it without our knowledge,” one said.
An Apple spokesman said it had “never heard” of PRISM.
The NSA access was enabled by changes to US surveillance law introduced under President Bush and renewed under Obama in December 2012.
The program facilitates extensive, in-depth surveillance on live communications and stored information. The law allows for the targeting of any customers of participating firms who live outside the US, or those Americans whose communications include people outside the US.
It also opens the possibility of communications made entirely within the US being collected without warrants.
Disclosure of the PRISM program follows a leak to the Guardian on Wednesday of a top-secret court order compelling telecoms provider Verizon to turn over the telephone records of millions of US customers.
The participation of the internet companies in PRISM will add to the debate, ignited by the Verizon revelation, about the scale of surveillance by the intelligence services. Unlike the collection of those call records, this surveillance can include the content of communications and not just the metadata.
Some of the world’s largest internet brands are claimed to be part of the information-sharing program since its introduction in 2007. Microsoft – which is currently running an advertising campaign with the slogan “Your privacy is our priority” – was the first, with collection beginning in December 2007.
It was followed by Yahoo in 2008; Google, Facebook and PalTalk in 2009; YouTube in 2010; Skype and AOL in 2011; and finally Apple, which joined the program in 2012. The program is continuing to expand, with other providers due to come online.
Collectively, the companies cover the vast majority of online email, search, video and communications networks.
The extent and nature of the data collected from each company varies.
Companies are legally obliged to comply with requests for users’ communications under US law, but the PRISM program allows the intelligence services direct access to the companies’ servers. The NSA document notes the operations have “assistance of communications providers in the US”.
The revelation also supports concerns raised by several US senators during the renewal of the Fisa Amendments Act in December 2012, who warned about the scale of surveillance the law might enable, and shortcomings in the safeguards it introduces.
When the FAA was first enacted, defenders of the statute argued that a significant check on abuse would be the NSA’s inability to obtain electronic communications without the consent of the telecom and internet companies that control the data. But the PRISM program renders that consent unnecessary, as it allows the agency to directly and unilaterally seize the communications off the companies’ servers.
A chart prepared by the NSA, contained within the top-secret document obtained by the Guardian, underscores the breadth of the data it is able to obtain: email, video and voice chat, videos, photos, voice-over-IP (Skype, for example) chats, file transfers, social networking details, and more.
The document is recent, dating to April 2013. Such a leak is extremely rare in the history of the NSA, which prides itself on maintaining a high level of secrecy.
The PRISM program allows the NSA, the world’s largest surveillance organisation, to obtain targeted communications without having to request them from the service providers and without having to obtain individual court orders.
With this program, the NSA is able to reach directly into the servers of the participating companies and obtain both stored communications as well as perform real-time collection on targeted users.
The presentation claims PRISM was introduced to overcome what the NSA regarded as shortcomings of Fisa warrants in tracking suspected foreign terrorists. It noted that the US has a “home-field advantage” due to housing much of the internet’s architecture. But the presentation claimed “Fisa constraints restricted our home-field advantage” because Fisa required individual warrants and confirmations that both the sender and receiver of a communication were outside the US.
“Fisa was broken because it provided privacy protections to people who were not entitled to them,” the presentation claimed. “It took a Fisa court order to collect on foreigners overseas who were communicating with other foreigners overseas simply because the government was collecting off a wire in the United States. There were too many email accounts to be practical to seek Fisas for all.”
The new measures introduced in the FAA redefines “electronic surveillance” to exclude anyone “reasonably believed” to be outside the USA – a technical change which reduces the bar to initiating surveillance.
The act also gives the director of national intelligence and the attorney general power to permit obtaining intelligence information, and indemnifies internet companies against any actions arising as a result of co-operating with authorities’ requests.
In short, where previously the NSA needed individual authorisations, and confirmation that all parties were outside the USA, they now need only reasonable suspicion that one of the parties was outside the country at the time of the records were collected by the NSA.
The document also shows the FBI acts as an intermediary between other agencies and the tech companies, and stresses its reliance on the participation of US internet firms, claiming “access is 100% dependent on ISP provisioning”.
In the document, the NSA hails the PRISM program as “one of the most valuable, unique and productive accesses for NSA”.
It boasts of what it calls “strong growth” in its use of the PRISM program to obtain communications. The document highlights the number of obtained communications increased in 2012 by 248% for Skype – leading the notes to remark there was “exponential growth in Skype reporting; looks like the word is getting out about our capability against Skype”. There was also a 131% increase in requests for Facebook data, and 63% for Google.
The NSA document indicates that it is planning to add Dropbox as a PRISM provider. The agency also seeks, in its words, to “expand collection services from existing providers”.
The revelations echo fears raised on the Senate floor last year during the expedited debate on the renewal of the FAA powers which underpin the PRISM program, which occurred just days before the act expired.
Senator Christopher Coons of Delaware specifically warned that the secrecy surrounding the various surveillance programs meant there was no way to know if safeguards within the act were working.
“The problem is: we here in the Senate and the citizens we represent don’t know how well any of these safeguards actually work,” he said.
“The law doesn’t forbid purely domestic information from being collected. We know that at least one Fisa court has ruled that the surveillance program violated the law. Why? Those who know can’t say and average Americans can’t know.”
Other senators also raised concerns. Senator Ron Wyden of Oregon attempted, without success, to find out any information on how many phone calls or emails had been intercepted under the program.
When the law was enacted, defenders of the FAA argued that a significant check on abuse would be the NSA’s inability to obtain electronic communications without the consent of the telecom and internet companies that control the data. But the PRISM program renders that consent unnecessary, as it allows the agency to directly and unilaterally seize the communications off the companies’ servers.
When the NSA reviews a communication it believes merits further investigation, it issues what it calls a “report”. According to the NSA, “over 2,000 PRISM-based reports” are now issued every month. There were 24,005 in 2012, a 27% increase on the previous year.
In total, more than 77,000 intelligence reports have cited the PRISM program.
Jameel Jaffer, director of the ACLU’s Center for Democracy, that it was astonishing the NSA would even ask technology companies to grant direct access to user data.
“It’s shocking enough just that the NSA is asking companies to do this,” he said. “The NSA is part of the military. The military has been granted unprecedented access to civilian communications.
“This is unprecedented militarisation of domestic communications infrastructure. That’s profoundly troubling to anyone who is concerned about that separation.”
A senior administration official said in a statement: “The Guardian and Washington Post articles refer to collection of communications pursuant to Section 702 of the Foreign Intelligence Surveillance Act. This law does not allow the targeting of any US citizen or of any person located within the United States.
“The program is subject to oversight by the Foreign Intelligence Surveillance Court, the Executive Branch, and Congress. It involves extensive procedures, specifically approved by the court, to ensure that only non-US persons outside the US are targeted, and that minimize the acquisition, retention and dissemination of incidentally acquired information about US persons.
“This program was recently reauthorized by Congress after extensive hearings and debate.
“Information collected under this program is among the most important and valuable intelligence information we collect, and is used to protect our nation from a wide variety of threats.
“The Government may only use Section 702 to acquire foreign intelligence information, which is specifically, and narrowly, defined in the Foreign Intelligence Surveillance Act. This requirement applies across the board, regardless of the nationality of the target.”
Additional reporting by James Ball and Dominic Rushe
NSA collecting phone records of millions of Verizon customers daily
Glenn Greenwald
Exclusive: Top secret court order requiring Verizon to hand over all call data shows scale of domestic surveillance under Obama
The National Security Agency is currently collecting the telephone records of millions of US customers of Verizon, one of America’s largest telecoms providers, under a top secret court order issued in April.
The document shows for the first time that under the Obama administration the communication records of millions of US citizens are being collected indiscriminately and in bulk – regardless of whether they are suspected of any wrongdoing.
The secret Foreign Intelligence Surveillance Court (Fisa) granted the order to the FBI on April 25, giving the government unlimited authority to obtain the data for a specified three-month period ending on July 19.
Under the terms of the blanket order, the numbers of both parties on a call are handed over, as is location data, call duration, unique identifiers, and the time and duration of all calls. The contents of the conversation itself are not covered.
The disclosure is likely to reignite longstanding debates in the US over the proper extent of the government’s domestic spying powers.
Under the Bush administration, officials in security agencies had disclosed to reporters the large-scale collection of call records data by the NSA, but this is the first time significant and top-secret documents have revealed the continuation of the practice on a massive scale under President Obama.
The unlimited nature of the records being handed over to the NSA is extremely unusual. Fisa court orders typically direct the production of records pertaining to a specific named target who is suspected of being an agent of a terrorist group or foreign state, or a finite set of individually named targets.
The Guardian approached the National Security Agency, the White House and the Department of Justice for comment in advance of publication on Wednesday. All declined. The agencies were also offered the opportunity to raise specific security concerns regarding the publication of the court order.
The court order expressly bars Verizon from disclosing to the public either the existence of the FBI’s request for its customers’ records, or the court order itself.
“We decline comment,” said Ed McFadden, a Washington-based Verizon spokesman.
The order, signed by Judge Roger Vinson, compels Verizon to produce to the NSA electronic copies of “all call detail records or ‘telephony metadata’ created by Verizon for communications between the United States and abroad” or “wholly within the United States, including local telephone calls”.
The order directs Verizon to “continue production on an ongoing daily basis thereafter for the duration of this order”. It specifies that the records to be produced include “session identifying information”, such as “originating and terminating number”, the duration of each call, telephone calling card numbers, trunk identifiers, International Mobile Subscriber Identity (IMSI) number, and “comprehensive communication routing information”.
The information is classed as “metadata”, or transactional information, rather than communications, and so does not require individual warrants to access. The document also specifies that such “metadata” is not limited to the aforementioned items. A 2005 court ruling judged that cell site location data – the nearest cell tower a phone was connected to – was also transactional data, and so could potentially fall under the scope of the order.
While the order itself does not include either the contents of messages or the personal information of the subscriber of any particular cell number, its collection would allow the NSA to build easily a comprehensive picture of who any individual contacted, how and when, and possibly from where, retrospectively.
It is not known whether Verizon is the only cell-phone provider to be targeted with such an order, although previous reporting has suggested the NSA has collected cell records from all major mobile networks. It is also unclear from the leaked document whether the three-month order was a one-off, or the latest in a series of similar orders.
The court order appears to explain the numerous cryptic public warnings by two US senators, Ron Wyden and Mark Udall, about the scope of the Obama administration’s surveillance activities.
For roughly two years, the two Democrats have been stridently advising the public that the US government is relying on “secret legal interpretations” to claim surveillance powers so broad that the American public would be “stunned” to learn of the kind of domestic spying being conducted.
Because those activities are classified, the senators, both members of the Senate intelligence committee, have been prevented from specifying which domestic surveillance programs they find so alarming. But the information they have been able to disclose in their public warnings perfectly tracks both the specific law cited by the April 25 court order as well as the vast scope of record-gathering it authorized.
Julian Sanchez, a surveillance expert with the Cato Institute, explained: “We’ve certainly seen the government increasingly strain the bounds of ‘relevance’ to collect large numbers of records at once — everyone at one or two degrees of separation from a target — but vacuuming all metadata up indiscriminately would be an extraordinary repudiation of any pretence of constraint or particularized suspicion.” The April order requested by the FBI and NSA does precisely that.
The law on which the order explicitly relies is the so-called “business records” provision of the Patriot Act, 50 USC section 1861. That is the provision which Wyden and Udall have repeatedly cited when warning the public of what they believe is the Obama administration’s extreme interpretation of the law to engage in excessive domestic surveillance.
In a letter to attorney general Eric Holder last year, they argued that “there is now a significant gap between what most Americans think the law allows and what the government secretly claims the law allows.”
“We believe,” they wrote, “that most Americans would be stunned to learn the details of how these secret court opinions have interpreted” the “business records” provision of the Patriot Act.
Privacy advocates have long warned that allowing the government to collect and store unlimited “metadata” is a highly invasive form of surveillance of citizens’ communications activities. Those records enable the government to know the identity of every person with whom an individual communicates electronically, how long they spoke, and their location at the time of the communication.
Such metadata is what the US government has long attempted to obtain in order to discover an individual’s network of associations and communication patterns. The request for the bulk collection of all Verizon domestic telephone records indicates that the agency is continuing some version of the data-mining program begun by the Bush administration in the immediate aftermath of the 9/11 attack.
The NSA, as part of a program secretly authorized by President Bush on 4 October 2001, implemented a bulk collection program of domestic telephone, internet and email records. A furore erupted in 2006 when USA Today reported that the NSA had “been secretly collecting the phone call records of tens of millions of Americans, using data provided by AT&T, Verizon and BellSouth” and was “using the data to analyze calling patterns in an effort to detect terrorist activity.” Until now, there has been no indication that the Obama administration implemented a similar program.
These recent events reflect how profoundly the NSA’s mission has transformed from an agency exclusively devoted to foreign intelligence gathering, into one that focuses increasingly on domestic communications. A 30-year employee of the NSA, William Binney, resigned from the agency shortly after 9/11 in protest at the agency’s focus on domestic activities.
In the mid-1970s, Congress, for the first time, investigated the surveillance activities of the US government. Back then, the mandate of the NSA was that it would never direct its surveillance apparatus domestically.
At the conclusion of that investigation, Frank Church, the Democratic senator from Idaho who chaired the investigative committee, warned: “The NSA’s capability at any time could be turned around on the American people, and no American would have any privacy left, such is the capability to monitor everything: telephone conversations, telegrams, it doesn’t matter.”
Additional reporting by Ewen MacAskill and Spencer Ackerman
Verizon forced to hand over telephone data – full court ruling
The US government is collecting the phone records of millions of US customers of Verizon under a top secret court order. Read the Foreign Intelligence Surveillance Court order
DNI Statement on Recent Unauthorized Disclosures of Classified Information
Thursday, June 06, 2013
June 6, 2013
DNI Statement on Recent Unauthorized Disclosures of Classified Information
The highest priority of the Intelligence Community is to work within the constraints of law to collect, analyze and understand information related to potential threats to our national security.
The unauthorized disclosure of a top secret U.S. court document threatens potentially long-lasting and irreversible harm to our ability to identify and respond to the many threats facing our nation.
The article omits key information regarding how a classified intelligence collection program is used to prevent terrorist attacks and the numerous safeguards that protect privacy and civil liberties.
I believe it is important for the American people to understand the limits of this targeted counterterrorism program and the principles that govern its use. In order to provide a more thorough understanding of the program, I have directed that certain information related to the “business records” provision of the Foreign Intelligence Surveillance Act be declassified and immediately released to the public.
The following important facts explain the purpose and limitations of the program:
The judicial order that was disclosed in the press is used to support a sensitive intelligence collection operation, on which members of Congress have been fully and repeatedly briefed. The classified program has been authorized by all three branches of the Government.
Although this program has been properly classified, the leak of one order, without any context, has created a misleading impression of how it operates. Accordingly, we have determined to declassify certain limited information about this program.
The program does not allow the Government to listen in on anyone’s phone calls. The information acquired does not include the content of any communications or the identity of any subscriber. The only type of information acquired under the Court’s order is telephony metadata, such as telephone numbers dialed and length of calls.
The collection is broad in scope because more narrow collection would limit our ability to screen for and identify terrorism-related communications. Acquiring this information allows us to make connections related to terrorist activities over time. The FISA Court specifically approved this method of collection as lawful, subject to stringent restrictions.
The information acquired has been part of an overall strategy to protect the nation from terrorist threats to the United States, as it may assist counterterrorism personnel to discover whether known or suspected terrorists have been in contact with other persons who may be engaged in terrorist activities.
There is a robust legal regime in place governing all activities conducted pursuant to the Foreign Intelligence Surveillance Act, which ensures that those activities comply with the Constitution and laws and appropriately protect privacy and civil liberties. The program at issue here is conducted under authority granted by Congress and is authorized by the Foreign Intelligence Surveillance Court (FISC). By statute, the Court is empowered to determine the legality of the program.
By order of the FISC, the Government is prohibited from indiscriminately sifting through the telephony metadata acquired under the program. All information that is acquired under this program is subject to strict, court-imposed restrictions on review and handling. The court only allows the data to be queried when there is a reasonable suspicion, based on specific facts, that the particular basis for the query is associated with a foreign terrorist organization. Only specially cleared counterterrorism personnel specifically trained in the Court-approved procedures may even access the records.
All information that is acquired under this order is subject to strict restrictions on handling and is overseen by the Department of Justice and the FISA Court. Only a very small fraction of the records are ever reviewed because the vast majority of the data is not responsive to any terrorism-related query.
The Court reviews the program approximately every 90 days. DOJ conducts rigorous oversight of the handling of the data received to ensure the applicable restrictions are followed. In addition, DOJ and ODNI regularly review the program implementation to ensure it continues to comply with the law.
The Patriot Act was signed into law in October 2001 and included authority to compel production of business records and other tangible things relevant to an authorized national security investigation with the approval of the FISC. This provision has subsequently been reauthorized over the course of two Administrations – in 2006 and in 2011. It has been an important investigative tool that has been used over the course of two Administrations, with the authorization and oversight of the FISC and the Congress.
Discussing programs like this publicly will have an impact on the behavior of our adversaries and make it more difficult for us to understand their intentions. Surveillance programs like this one are consistently subject to safeguards that are designed to strike the appropriate balance between national security interests and civil liberties and privacy concerns. I believe it is important to address the misleading impression left by the article and to reassure the American people that the Intelligence Community is committed to respecting the civil liberties and privacy of all American citizens.
James R. Clapper, Director of National Intelligence
US intelligence chief denounces release of information
Spencer Ackerman
Revealing huge surveillance programme risks damaging US national security, James Clapper says
Disclosure of the massive surveillance of phone records and internet communications risks “long-lasting and irreversible harm” to US national security, the director of national intelligence says.
Late on Thursday night US time James Clapper issued a bullet-point defence of the surveillance programs disclosed by the Guardian and the Washington Post, saying they contained “numerous safeguards that protect privacy and civil liberties”. To correct the “misleading impression left in the article” – apparently a reference to the Guardian’s original story – Clapper said he approved the declassification of his defence of the National Security Agency’s collection of every phone record from millions of Verizon customers.
“There is a robust legal regime in place governing all activities conducted pursuant to the Foreign Intelligence Surveillance Act,” Clapper wrote, “which ensures that those activities comply with the Constitution and laws and appropriately protect privacy and civil liberties. The program at issue here is conducted under authority granted by Congress and is authorized by the Foreign Intelligence Surveillance Court (FISC). By statute, the Court is empowered to determine the legality of the program.”
Clapper attacked the disclosures by the Guardian and the Washington Post as “reprehensible” for risking “important protections for the security of Americans”.
A judge for Fisa Court, as the surveillance body is known, reviewed and approved the surveillance. But critics have pointed out that the Fisa Court has almost never, in its 35-year history, rejected a US surveillance request – a perception of docility that prompted its presiding judge, Reggie Walton, to defend the court’s integrity in a statement to the Guardian on Thursday.
Clapper said the Fisa Court had established procedures preventing the government “indiscriminately sifting” through the collected phone records. “The court only allows the data to be queried when there is a reasonable suspicion, based on specific facts, that the particular basis for the query is associated with a foreign terrorist organisation,” Clapper said. “Only a small fraction of the records are ever reviewed” by “specifically cleared counterterrorism personnel”.
At the same time, Clapper said national security required the NSA to collect all the Verizon subscriber data, even if not all the data would be analysed, and regardless of any evidence to link the phone records to crime, foreign espionage or terrorism. On Thursday, the Wall Street Journal reported that other telecoms received similar orders from the government for the subscriber data.
“The collection is broad in scope,” Clapper wrote, “because more narrow collection would limit our ability to protect the nation from terrorist threats to the United States, as it may assist counterterrorism personnel to discover whether known or suspected terrorists have been in contact with other persons who may be engaged in terrorist activities.”
Yet the collection does not need to be tied to terrorism to occur – something that alarmed one Democrat senator, Jeff Merkley. He told the Guardian on Thursday that the sweeping “barn-door” collection appeared to violate the provision of the Patriot Act purportedly authorising it.
“We can’t really propose changes to the law unless we know what the words mean as interpreted by the court,” Merkley said.
Clapper reiterated a point the Obama administration made on Thursday in its response to the Guardian’s story: the NSA’s dragnet of Verizon phone records, which the Fisa Court authorised until 19 July, does not include the “content of any communications or the identity of any subscriber”. Yet the so-called “metadata” – phone numbers, duration of calls – can be combined with publicly available information to easily determine subscriber identity. And a second NSA surveillance effort, disclosed by the Guardian on Thursday and codenamed PRISM, collects the content of communications provided through Google, Facebook, Microsoft, Apple and five other large internet companies.
Clapper came under criticism on Thursday for statements to Democrat senator Ron Wyden that appeared to be contradicted by the revelations of the surveillance programs. Asked in March whether “millions” of Americans had “any kind of [their] data” collected by the US government, Clapper replied: “Not wittingly. There are cases where they could inadvertently perhaps collect, but not wittingly.”
He has denied misleading Congress, but Clapper’s statement on Thursday suggested the collection of Americans’ phone records was deliberate, methodical and institutionalised.
“Discussing programs like this publicly,” Clapper concluded, “will have an impact on the behavior of our adversaries and make it more difficult for us to understand their intentions.”
Within hours of the disclosure that federal authorities routinely collect data on phone calls Americans make, regardless of whether they have any bearing on a counterterrorism investigation, the Obama administration issued the same platitude it has offered every time President Obama has been caught overreaching in the use of his powers: Terrorists are a real menace and you should just trust us to deal with them because we have internal mechanisms (that we are not going to tell you about) to make sure we do not violate your rights.
Those reassurances have never been persuasive — whether on secret warrants to scoop up a news agency’s phone records or secret orders to kill an American suspected of terrorism — especially coming from a president who once promised transparency and accountability.
The administration has now lost all credibility on this issue. Mr. Obama is proving the truism that the executive branch will use any power it is given and very likely abuse it. That is one reason we have long argued that the Patriot Act, enacted in the heat of fear after the Sept. 11, 2001, attacks by members of Congress who mostly had not even read it, was reckless in its assignment of unnecessary and overbroad surveillance powers.
Based on an article in The Guardian published Wednesday night, we now know that the Federal Bureau of Investigation and the National Security Agency used the Patriot Act to obtain a secret warrant to compel Verizon’s business services division to turn over data on every single call that went through its system. We know that this particular order was a routine extension of surveillance that has been going on for years, and it seems very likely that it extends beyond Verizon’s business division. There is every reason to believe the federal government has been collecting every bit of information about every American’s phone calls except the words actually exchanged in those calls.
Articles in The Washington Post and The Guardian described a process by which the N.S.A. is also able to capture Internet communications directly from the servers of nine leading American companies. The articles raised questions about whether the N.S.A. separated foreign communications from domestic ones.
A senior administration official quoted in The Times online Thursday afternoon about the Verizon order offered the lame observation that the information does not include the name of any caller, as though there would be the slightest difficulty in matching numbers to names. He said the information “has been a critical tool in protecting the nation from terrorist threats,” because it allows the government “to discover whether known or suspected terrorists have been in contact with other persons who may be engaged in terrorist activities, particularly people located inside the United States.”
That is a vital goal, but how is it served by collecting everyone’s call data? The government can easily collect phone records (including the actual content of those calls) on “known or suspected terrorists” without logging every call made. In fact, the Foreign Intelligence Surveillance Act was expanded in 2008 for that very purpose.
Essentially, the administration is saying that without any individual suspicion of wrongdoing, the government is allowed to know whom Americans are calling every time they make a phone call, for how long they talk and from where.
This sort of tracking can reveal a lot of personal and intimate information about an individual. To casually permit this surveillance — with the American public having no idea that the executive branch is now exercising this power — fundamentally shifts power between the individual and the state, and it repudiates constitutional principles governing search, seizure and privacy.
The defense of this practice offered by Senator Dianne Feinstein of California, who as chairwoman of the Senate Intelligence Committee is supposed to be preventing this sort of overreaching, was absurd. She said on Thursday that the authorities need this information in case someone might become a terrorist in the future. Senator Saxby Chambliss of Georgia, the vice chairman of the committee, said the surveillance has “proved meritorious, because we have gathered significant information on bad guys and only on bad guys over the years.”But what assurance do we have of that, especially since Ms. Feinstein went on to say that she actually did not know how the data being collected was used?
The senior administration official quoted in The Times said the executive branch internally reviews surveillance programs to ensure that they “comply with the Constitution and laws of the United States and appropriately protect privacy and civil liberties.”
That’s no longer good enough. Mr. Obama clearly had no intention of revealing this eavesdropping, just as he would not have acknowledged the killing of Anwar al-Awlaki, an American citizen, had it not been reported in the press. Even then, it took him more than a year and a half to acknowledge the killing, and he is still keeping secret the protocol by which he makes such decisions.
We are not questioning the legality under the Patriot Act of the court order disclosed by The Guardian. But we strongly object to using that power in this manner. It is the very sort of thing against which Mr. Obama once railed, when he said in 2007 that the surveillance policy of the George W. Bush administration “puts forward a false choice between the liberties we cherish and the security we provide.”
Two Democrats on the Senate Intelligence Committee, Ron Wyden of Oregon and Mark Udall of Colorado, have raised warnings about the government’s overbroad interpretation of its surveillance powers. “We believe most Americans would be stunned to learn the details of how these secret court opinions have interpreted Section 215 of the Patriot Act,” they wrote last year in a letter to Attorney General Eric Holder Jr. “As we see it, there is now a significant gap between what most Americans think the law allows and what the government secretly claims the law allows. This is a problem, because it is impossible to have an informed public debate about what the law should say when the public doesn’t know what its government thinks the law says.”
On Thursday, Representative Jim Sensenbrenner, Republican of Wisconsin, who introduced the Patriot Act in 2001, said that the National Security Agency overstepped its bounds by obtaining a secret order to collect phone log records from millions of Americans.
“As the author of the Patriot Act, I am extremely troubled by the F.B.I.’s interpretation of this legislation,” he said in a statement. “While I believe the Patriot Act appropriately balanced national security concerns and civil rights, I have always worried about potential abuses.” He added: “Seizing phone records of millions of innocent people is excessive and un-American.”
Stunning use of the act shows, once again, why it needs to be sharply curtailed if not repealed.
To find the legal authority underpinning the top-secret Prism surveillance program, we once again turn to the Foreign Intelligence Surveillance Act.
Law Blog on Thursday wrote about the statute allowing the government to compel the production of “business records” relevant to a foreign intelligence probe.
Another statute, Section 702 of FISA, provides procedures for spying on the online communication of foreigners or groups located outside our borders.
In a statement Thursday, Director of National Intelligence James R. Clapper said Section 702 “cannot be used to intentionally target any U.S. citizen, any other U.S. person, or anyone located within the United States.”
But the statute passed by Congress in 2008 leaves quite a bit of wiggle room, according to legal experts. Here are some potential loopholes:
‘Reasonably believed’: The Attorney General and the intelligence director must certify to a special surveillance judge that targets are “reasonably believed to be located outside the United States.” How certain is that? According to the Washington Post, that means a 51% confidence, similar to the preponderance of evidence standard.
“Given the scale of collection here, even if [the error rate] were only a few percent, we’d still be talking about a huge number of American communications,” Julian Sanchez, a research fellow at the Cato Institute, told Law Blog.
Also, the government doesn’t have to be 51% sure that the target isn’t an American citizen nor a legal resident. The government just has to assert that it’s not intentionally targeting a citizen or legal resident.
Who’s the target? There’s another ambiguity around the notion of a target. It’s unclear whether NSA interprets the law to allow the government to tap into accounts belonging to Americans as long as the surveillance is broadly directed at a foreign group, like Al Qaeda, according to Mr. Sanchez.
Optional verifying: The targeting procedures are subject to judicial review by the Foreign Intelligence Surveillance Court, but “the court is not required to look behind the assertions made in the certifications” submitted by the attorney and the national intelligence director, according to an analysis of the law prepared by the Congressional Research Service, a nonpartisan and independent group that advises Congress on legal matters.
Exigent circumstances: In the absence of a court order, the attorney general and intelligence director may also authorize targeting if they determine that “exigent circumstances exist which would cause the loss or delay of important national security intelligence, according to the Congressional Research Service. The government has seven days to submit the “certification” paperwork to the court, but it can move forward with the spying during that week.
“They’re assuring us that there are secret procedures in place to protect privacy, but there’s never been a public evaluation of them,” Michelle Richardson, legislative counsel for the American Civil Liberties Union’s Washington Legislative Office, told Law Blog. “We’re disinclined to take their word for it knowing that they are doing things like collecting everybody’s telephone records.”
Mr. Clapper in his statement said that information collected under Prism “is among the most important and valuable foreign intelligence information we collect, and is used to protect our nation from a wide variety of threats.”
Mr. Clapper also said in his statement that “activities authorized” by the law “involve extensive procedures . . . to ensure that only non-U.S. persons outside the U.S. are targeted . . . ”
A spokesperson for Mr. Clapper’s office did not immediately respond to a request seeking comment.
The Foreign Intelligence Surveillance Act of 1978 (“FISA” Pub.L. 95–511, 92 Stat. 1783, 50 U.S.C.ch. 36) is a United States law which prescribes procedures for the physical and electronic surveillance and collection of “foreign intelligence information” between “foreign powers” and “agents of foreign powers” (which may include American citizens and permanent residents suspected of espionage or terrorism).[1] The law does not apply outside the United States. The law has been repeatedly amended since the September 11 attacks.
Subsequent amendments
The Act was amended in 2001 by the USA PATRIOT Act, primarily to include terrorism on behalf of groups that are not specifically backed by a foreign government.
An overhaul of the bill, the Protect America Act of 2007 was signed into law on August 5, 2007.[2] It expired on February 17, 2008.
The FISA resulted from extensive investigations by Senate Committees into the legality of domestic intelligence activities. These investigations were led separately by Sam Ervin and Frank Church in 1978 as a response to President Richard Nixon’s usage of federal resources to spy on political and activist groups, which violates the Fourth Amendment.[4] The act was created to provide Judicial and congressional oversight of the government’s covert surveillance activities of foreign entities and individuals in the United States, while maintaining the secrecy needed to protect national security. It allowed surveillance, without court order, within the United States for up to one year unless the “surveillance will acquire the contents of any communication to which a United States person is a party”. If a United States person is involved, judicial authorization was required within 72 hours after surveillance begins.
Bush administration warrantless domestic wiretapping program
The Act came into public prominence in December 2005 following publication by the New York Times of an article[5] that described a program of warrantless domestic wiretapping ordered by the Bush administration and carried out by the National Security Agency since 2002; a subsequent Bloomberg article[6] suggested that this may have already begun by June 2000.
Scope and limits
For most purposes, including electronic surveillance and physical searches, “foreign powers” means a foreign government, any faction(s) or foreign governments not substantially composed of U.S. persons, and any entity directed or controlled by a foreign government. §§1801(a)(1)-(3) The definition also includes groups engaged in international terrorism and foreign political organizations. §§1801(a)(4) and (5). The sections of FISA authorizing electronic surveillance and physical searches without a court order specifically exclude their application to groups engaged in international terrorism. See §1802(a)(1) (referring specifically to §1801(a)(1), (2), and (3)).
The statute includes limits on how it may be applied to U.S. persons. A “U.S. person” includes citizens, lawfully admitted permanent resident aliens, and corporations incorporated in the United States.
The code defines “foreign intelligence information” to mean information necessary to protect the United States against actual or potential grave attack, sabotage or international terrorism.[7]
In sum, a significant purpose of the electronic surveillance must be to obtain intelligence in the United States on foreign powers (such as enemy agents or spies) or individuals connected to international terrorist groups. To use FISA, the government must show probable cause that the “target of the surveillance is a foreign power or agent of a foreign power.”[4][8]
The act created a court which meets in secret, and approves or denies requests for search warrants. Only the number of warrants applied for, issued and denied, is reported. In 1980 (the first full year after its inception), it approved 322 warrants.[9] This number has steadily grown to 2,224 warrants in 2006.[10] In the period 1979-2006 a total of 22,990 applications for warrants were made to the Court of which 22,985 were approved (sometimes with modifications; or with the splitting up, or combining together, of warrants for legal purposes), and only 5 were definitively rejected.[11]
Electronic surveillance
Generally, the statute permits electronic surveillance in two scenarios.
Without a court order
The President may authorize, through the Attorney General, electronic surveillance without a court order for the period of one year provided it is only for foreign intelligence information;[7] targeting foreign powers as defined by 50 U.S.C.§ 1801(a)(1),(2),(3)[12] or their agents; and there is no substantial likelihood that the surveillance will acquire the contents of any communication to which a United States person is a party.[13]
Since 50 U.S.C.§ 1802(a)(1)(A) of this act specifically limits warrantless surveillance to foreign powers as defined by 50 U.S.C. §1801(a) (1),(2), (3) and omits the definitions contained in 50 U.S.C. §1801(a) (4),(5),(6) the act does not authorize the use of warrantless surveillance on: groups engaged in international terrorism or activities in preparation therefore; foreign-based political organizations, not substantially composed of United States persons; or entities that are directed and controlled by a foreign government or governments.[16] Under the FISA act, anyone who engages in electronic surveillance except as authorized by statute is subject to both criminal penalties[17] and civil liabilities.[18]
Under 50 U.S.C. § 1811, the President may also authorize warrantless surveillance at the beginning of a war. Specifically, he may authorize such surveillance “for a period not to exceed fifteen calendar days following a declaration of war by the Congress”.[19]
With a court order
Alternatively, the government may seek a court order permitting the surveillance using the FISA court.[20] Approval of a FISA application requires the court find probable cause that the target of the surveillance be a “foreign power” or an “agent of a foreign power”, and that the places at which surveillance is requested is used or will be used by that foreign power or its agent. In addition, the court must find that the proposed surveillance meet certain “minimization requirements” for information pertaining to U.S. persons.[21]
Physical searches
In addition to electronic surveillance, FISA permits the “physical search” of the “premises, information, material, or property used exclusively by” a foreign power. The requirements and procedures are nearly identical to those for electronic surveillance.
The Act created the Foreign Intelligence Surveillance Court (FISC) and enabled it to oversee requests for surveillance warrants by federal police agencies (primarily the F.B.I.) against suspected foreign intelligence agents inside the U.S. The court is located within the Department of Justice headquarters building. The court is staffed by eleven judges appointed by the Chief Justice of the United States to serve seven year terms.
Proceedings before the FISA court are ex parte and non-adversarial. The court hears evidence presented solely by the Department of Justice. There is no provision for a release of information regarding such hearings, or for the record of information actually collected.
Denials of FISA applications by the FISC may be appealed to the Foreign Intelligence Surveillance Court of Review. The Court of Review is a three judge panel. Since its creation, the court has come into session twice: in 2002 and 2008.
Remedies for violations
Both the subchapters covering physical searches and electronic surveillance provide for criminal and civil liability for violations of FISA.
Criminal sanctions follows violations of electronic surveillance by intentionally engaging in electronic surveillance under the color of law or through disclosing information known to have been obtained through unauthorized surveillance. The penalties for either act are fines up to $10,000, up to five years in jail, or both.[17]
In addition, the statute creates a cause of action for private individuals whose communications were unlawfully monitored. The statute permits actual damages of not less than $1,000 or $100 per day. In addition, that statute authorizes punitive damages and an award of attorney’s fees.[18] Similar liability is found under the subchapter pertaining to physical searches. In both cases, the statute creates an affirmative defense for a law enforcement agent acting within their official duties and pursuant to a valid court order. Presumably, such a defense is not available to those operating exclusively under presidential authorization.
Lone wolf amendment
In 2004 FISA was amended to include a “lone wolf” provision. 50 U.S.C.§ 1801(b)(1)(C). A “lone wolf” is a non-U.S. person who engages in or prepares for international terrorism. The provision amended the definition of “foreign power” to permit the FISA courts to issue surveillance and physical search orders without having to find a connection between the “lone wolf” and a foreign government or terrorist group. However, “if the court authorizes such a surveillance or physical search using this new definition of ‘agent of a foreign power’, the FISC judge has to find, in pertinent part, that, based upon the information provided by the applicant for the order, the target had engaged in or was engaging in international terrorism or activities in preparation therefor”.[22]
Constitutionality
Before FISA
In 1967 the Supreme Court of the United States held that the requirements of the Fourth Amendment applied equally to electronic surveillance and to physical searches. Katz v. United States, 389 U.S. 347 (1967). The Court did not address whether such requirements apply to issues of national security. Shortly after, in 1972, the Court took up the issue again in United States v. United States District Court, Plamondon, where the court held that court approval was required in order for the domestic surveillance to satisfy the Fourth Amendment. 407 U.S. 297 (1972). Justice Powell wrote that the decision did not address this issue that “may be involved with respect to activities of foreign powers or their agents”.
In the time immediately preceding FISA, a number of courts squarely addressed the issue of “warrantless wiretaps”. In both United States v. Brown, 484 F.2d 418 (5th Cir. 1973), and United States v. Butenko, 494 F.2d 593 (3rd Cir. 1974), the courts upheld warrantless wiretaps. In Brown, a U.S. citizen’s conversation was captured by a wiretap authorized by the Attorney General for foreign intelligence purposes. In Butenko, the court held a wiretap valid if the primary purpose was for gathering foreign intelligence information.
A plurality opinion in Zweibon v. Mitchell, 516 F.2d 594 (D.C. Cir. 1975), held that a warrant was required for the domestic surveillance of a domestic organization. In this case, the court found that the domestic organization was not a “foreign power or their agent”, and “absent exigent circumstances, all warrantless electronic surveillance is unreasonable and therefore unconstitutional.”
Post-FISA
There have been very few cases involving the constitutionality of FISA. In two lower court decisions, the courts found FISA constitutional. In the United States v. Duggan, the defendants were members of the Irish Republican Army. 743 F.2d 59 (2nd Cir., 1984). They were convicted for various violations regarding the shipment of explosives and firearms. The court held that there were compelling considerations of national security in the distinction between the treatment of U.S. citizens and non-resident aliens.
However, in a third case, the special review court for FISA, the equivalent of a Circuit Court Of Appeals, opined differently should FISA limit the President’s inherent authority for warrantless searches in the foreign intelligence area. In In re Sealed Case, 310 F.3d 717, 742 (Foreign Intel. Surv. Ct. of Rev. 2002) the special court stated “[A]ll the other courts to have decided the issue [have] held that the President did have inherent authority to conduct warrantless searches to obtain foreign intelligence information . . . . We take for granted that the President does have that authority and, assuming that is so, FISA could not encroach on the President’s constitutional power.”
Criticisms
K. A. Taipale of the World Policy Institute, James Jay Carafano of the Heritage Foundation,[23] and Philip Bobbitt of Columbia Law School,[24] among others,[25] have argued that FISA may need to be amended (to include, among other things, procedures for programmatic approvals) as it may no longer be adequate to address certain foreign intelligence needs and technology developments, including: the transition from circuit-based communications to packet-based communications; the globalization of communications infrastructure; and the development of automated monitoring techniques, including data mining and traffic analysis.[26]
The need for programmatic approval of technology-enabled surveillance programs is particularly crucial in foreign intelligence. See, for example, John R. Schmidt, the associate attorney general (1994–1997) in the Justice Department under President Bill Clinton,[27] recalling early arguments made by then-Attorney General Edward Levi to the Church Committee that foreign intelligence surveillance legislation should include provisions for programmatically authorizing surveillance programs because of the particular needs of foreign intelligence where “virtually continuous surveillance, which by its nature does not have specifically predetermined targets” may be required. In these situations, “the efficiency of a warrant requirement would be minimal.”
And, in a recent essay, Judge Richard A. Posner opined that FISA “retains value as a framework for monitoring the communications of known terrorists, but it is hopeless as a framework for detecting terrorists. [FISA] requires that surveillance be conducted pursuant to warrants based on probable cause to believe that the target of surveillance is a terrorist, when the desperate need is to find out who is a terrorist.”[28]
Amendments
Terrorist Surveillance Act of 2006
On March 16, 2006, Senators Mike DeWine (R-OH), Lindsey Graham (R-SC), Chuck Hagel (R-NE), and Olympia Snowe (R-ME) introduced the Terrorist Surveillance Act of 2006 (S.2455),[29][30] under which the President would be given certain additional limited statutory authority to conduct electronic surveillance of suspected terrorists in the United States subject to enhanced Congressional oversight. Also on March 16, 2006, Senator Arlen Specter (R-PA) introduced the National Security Surveillance Act of 2006 (S. 2453),[31][32] which would amend FISA to grant retroactive amnesty[33] for warrantless surveillance conducted under presidential authority and provide FISA court (FISC) jurisdiction to review, authorize, and oversight “electronic surveillance programs”. On May 24, 2006, Senator Specter and Senator Dianne Feinstein (D-CA) introduced the Foreign Intelligence Surveillance Improvement and Enhancement Act of 2006 (S. 3001) asserting FISA as the exclusive means to conduct foreign intelligence surveillance.
All three competing bills were the subject of Judiciary Committee hearings throughout the summer.[34] On September 13, 2006, the Senate Judiciary Committee voted to approve all three mutually exclusive bills, thus, leaving it to the full Senate to resolve.[35]
On July 18, 2006, U.S. Representative Heather Wilson (R-NM) introduced the Electronic Surveillance Modernization Act (H.R. 5825). Wilson’s bill would give the President the authority to authorize electronic surveillance of international phone calls and e-mail linked specifically to identified terrorist groups immediately following or in anticipation of an armed or terrorist attack on the United States. Surveillance beyond the initial authorized period would require a FISA warrant or a presidential certification to Congress. On September 28, 2006 the House of Representatives passed Wilson’s bill and it was referred to the Senate.[36]
Protect America Act of 2007
On July 28, 2007, President Bush called on Congress to pass legislation to reform the FISA in order to ease restrictions on surveillance of terrorist suspects where one party (or both parties) to the communication are located overseas. He asked that Congress pass the legislation before its August 2007 recess. On August 3, 2007, the Senate passed a Republican-sponsored version of FISA (S. 1927) in a vote of 60 to 28. The House followed by passing the bill, 227–183. The Protect America Act of 2007 (Pub.L. 110–55, S. 1927) was then signed into law by George W. Bush on 2007-08-05.[37]
Under the Protect America Act of 2007, communications that begin or end in a foreign country may be wiretapped by the U.S. government without supervision by the FISA Court. The Act removes from the definition of “electronic surveillance” in FISA any surveillance directed at a person reasonably believed to be located outside the United States. As such, surveillance of these communications no longer requires a government application to, and order issuing from, the FISA Court.
The Act provides procedures for the government to “certify” the legality of an acquisition program, for the government to issue directives to providers to provide data or assistance under a particular program, and for the government and recipient of a directive to seek from the FISA Court, respectively, an order to compel provider compliance or relief from an unlawful directive. Providers receive costs and full immunity from civil suits for compliance with any directives issued pursuant to the Act.
A summary of key provisions follows. The Act empowers the Attorney General or Director of National Intelligence (“DNI”) to authorize, for up to one year, the acquisition of communications concerning “persons reasonably believed to be outside the United States” if the Attorney General and DNI determine that each of five criteria has been met:
There are reasonable procedures in place for determining that the acquisition concerns persons reasonably believed to be located outside the United States;
The acquisition does not constitute electronic surveillance (meaning it does not involve solely domestic communications);
The acquisition involves obtaining the communications data from or with the assistance of a communications service provider who has access to communications;
A significant purpose of the acquisition is to obtain foreign intelligence information; and
Minimization procedures outlined in the FISA will be used.
This determination by the Attorney General and DNI must be certified in writing, under oath, and supported by appropriate affidavit(s). If immediate action by the government is required and time does not permit the preparation of a certification, the Attorney General or DNI can direct the acquisition orally, with a certification to follow within 72 hours. The certification is then filed with the FISA Court.
Once the certification is filed with the FISA Court, the Attorney General or DNI can direct a provider to undertake or assist in the undertaking of the acquisition.
If a provider fails to comply with a directive issued by the Attorney General or DNI, the Attorney General may seek an order from the FISA Court compelling compliance with the directive. Failure to obey an order of the FISA Court may be punished as a contempt of court.
Likewise, a person receiving a directive may challenge the legality of that directive by filing a petition with the FISA Court. An initial review must be conducted within 48 hours of the filing to determine whether the petition is frivolous, and a final determination concerning any non-frivolous petitions must be made – in writing – within 72 hours of receipt of the petition.
Determinations of the FISA Court may be appealed to the Foreign Intelligence Court of Appeals, and a petition for a writ of certiorari of a decision from the FICA can be made to the U.S. Supreme Court.
All petitions must be filed under seal.
The Act allows providers to be compensated, at the prevailing rate, for providing assistance as directed by the Attorney General or DNI.
The Act provides explicit immunity from civil suit in any federal or state court for providing any information, facilities, or assistance in accordance with a directive under the Act.
Within 120 days, the Attorney General must submit to the FISA Court for its approval the procedures by which the government will determine that acquisitions authorized by the Act conform with the Act and do not involve purely domestic communications. The FISA Court then will determine whether the procedures comply with the Act. The FISA Court thereafter will enter an order either approving the procedures or directing the government to submit new procedures within 30 days or cease any acquisitions under the government procedures. The government may appeal a ruling of the FISA Court to the FICA and ultimately the Supreme Court.
On a semiannual basis, the Attorney General shall inform the Intelligence and Judiciary Committees of the House and Senate of incidents of noncompliance with a directive issued by the Attorney General or the DNI, incidents of noncompliance with FISA Court-approved procedures by the Intelligence Community, and the number of certifications and directives issued during the reporting period.
The amendments to FISA made by the Act expire 180 days after enactment, except that any order in effect on the date of enactment remains in effect until the date of expiration of such order and such orders can be reauthorized by the FISA Court.”[38] The Act expired on February 17, 2008.
Subsequent developments
Legal experts experienced in national security issues are divided on how broadly the new law could be interpreted or applied. Some believe that due to subtle changes in the definitions of terms such as “electronic surveillance”, it could empower the government to conduct warrantless physical searches and even seizures of communications and computer devices and their data which belong to U.S. citizens while they are in the United States, if the government contended that those searches and potential seizures were related to its surveillance of parties outside the United States. Intelligence officials, while declining to comment directly on such possibilities, respond that such interpretations are overly broad readings of the act, and unlikely to actually occur. Democratic lawmakers have nonetheless indicated that they are planning to introduce a revised version of the legislation for consideration as early as September 2007.[39]
Also on September 10, DNI Mike McConnell testified before the Senate Committee on Homeland Security and Governmental Affairs that the Protect America Act had helped foil a major terror plot in Germany. U.S. intelligence-community officials questioned the accuracy of McConnell’s testimony and urged his office to correct it, which he did in a statement issued September 12, 2007. Critics cited the incident as an example of the Bush administration’s exaggerated claims and contradictory statements about surveillance activities. Counterterrorism officials familiar with the background of McConnell’s testimony said they did not believe he made inaccurate statements intentionally as part of any strategy by the administration to persuade Congress to make the new eavesdropping law permanent. Those officials said they believed McConnell gave the wrong answer because he was overwhelmed with information and merely mixed up his facts.[41]
Speaking at National Security Agency headquarters in Fort Meade, Maryland on September 19, 2007, President George W. Bush urged Congress to make the provisions of the Protect America Act permanent. Bush also called for retroactive immunity for telecommunications companies who had cooperated with government surveillance efforts, saying, “It’s particularly important for Congress to provide meaningful liability protection to those companies now facing multibillion-dollar lawsuits only because they are believed to have assisted in efforts to defend our nation, following the 9/11 attacks”.[42]
On October 4, 2007, the bipartisan Liberty and Security Committee of the Constitution Project, co-chaired by David Keene and David D. Cole, issued its “Statement on the Protect America Act”.[43] The Statement urged Congress not to reauthorize the PAA, saying the language of the bill “runs contrary to the tripartite balance of power the Framers envisioned for our constitutional democracy, and poses a serious threat to the very notion of government of the people, by the people and for the people”. Some in the legal community have questioned the constitutionality of any legislation that would retroactively immunize telecommunications firms alleged to have cooperated with the government from civil liability for having potentially violated their customers’ privacy rights.[44]
In an article appearing in the January/February 2008 issue of the Institute of Electrical and Electronics Engineers journal of Security and Privacy, noted technology experts from academia and the computing industry found significant flaws in the technical implementation of the Protect America Act which they said created serious security risks, including the danger that such a surveillance system could be exploited by unauthorized users, criminally misused by trusted insiders, or abused by the government.[45]
On October 7, 2007, the Washington Post reported that House Democrats planned to introduce alternative legislation which would provide for one-year “umbrella” warrants, and would require the Justice Department inspector general to audit the use of those warrants and issue quarterly reports to a special FISA court and to Congress. The proposed bill would not include immunity for telecommunications firms facing lawsuits in connection with the administration’s NSA warrantless surveillance program. House Democrats said that as long as the administration withholds requested documents explaining the basis for the program that they cannot consider immunity for firms alleged to have facilitated it.[46] On October 10, 2007 comments on the White House South Lawn, President Bush said he would not sign any bill that did not provide retroactive immunity for telecommunications corporations.[47]
On October 18, 2007, the House Democratic leadership put off a vote on the proposed legislation by the full chamber to avoid consideration of a Republican measure that made specific references to Osama bin Laden. At the same time, the Senate Intelligence Committee reportedly reached a compromise with the White House on a different proposal that would give telephone carriers legal immunity for any role they played in the National Security Agency’s domestic eavesdropping program approved by President Bush after the Sept. 11 terrorist attacks.[48]
On November 15, 2007, the Senate Judiciary Committee voted 10-9 along party lines to send an alternative measure to the full Senate other than the one the intelligence committee had crafted with the White House. The proposal would leave to the full Senate whether or not to provide retroactive immunity to telecommunications firms that cooperated with the NSA. Judiciary Committee chairman Patrick Leahy said that granting such immunity would give the Bush administration a “blank check” to do what it wants without regard to the law. Arlen Specter of Pennsylvania, the top Republican on the committee, said that court cases may be the only way Congress can learn exactly how far outside the law the administration has gone in eavesdropping in the United States. When the full Senate takes up the bill, Specter is expected to offer a compromise that would shield the companies from financial ruin but allow lawsuits to go forward by having the federal government stand in for the companies at trial.[49]
On the same day, the House of Representatives voted 227-189 to approve a Democratic bill that would expand court oversight of government surveillance inside the United States while denying immunity to telecom companies. House Judiciary Committee chairman John Conyers left the door open to an immunity deal in the future, but said that the White House must first give Congress access to classified documents specifying what the companies did that requires legal immunity.[50]
Wikisource has original text related to this article:
In February 2008, the Senate passed the version of the new FISA that would allow telecom companies immunity. On March 13, 2008, the U.S. House of Representatives held a secret session to discuss related information. On March 14, the House voted 213-197 to approve a bill that would not grant telecom immunity — far short of the 2/3 majority required to override a Presidential veto.[51] The Senate and House bills are compared and contrasted in a June 12, 2008 report from the Congressional Research Service.[52]
On March 13, 2008, the House of Representatives held a secret, closed door meeting to debate changes to the FISA bill.[53][54]
Glenn Greenwald (born March 6, 1967) is an American political journalist, lawyer, columnist, blogger, and author. In August 2012, he left Salon.com, where he was a columnist, to become a columnist at the US edition of The Guardian newspaper,[1][2] to which he has contributed since June 2011.[3][4][5]
Greenwald practiced law in the Litigation Department at Wachtell, Lipton, Rosen & Katz (1994–1995); in 1996 he co-founded his own litigation firm, called Greenwald Christoph & Holland (later renamed Greenwald Christoph PC), where he litigated cases concerning issues of U.S. constitutional law and civil rights.[6][18] According to Greenwald, “I decided voluntarily to wind down my practice in 2005 because I could, and because, after ten years, I was bored with litigating full-time and wanted to do other things which I thought were more engaging and could make more of an impact, including political writing.”[18]
In February 2007, Greenwald became a contributing writer at Salon.com, and the new column and blog superseded Unclaimed Territory, though Salon.com prominently features hyperlinks to it in Greenwald’s dedicated biographical section.[19][20]
Greenwald’s criticism of the conditions in which U.S. Army Private Bradley Manning, the accused WikiLeaks leaker, was being held ultimately led to a formal investigation by the U.N. high official on torture,[26][27] denunciations by Amnesty International,[28] and the resignation of State Department spokesman Philip J. Crowley after he publicly criticized Manning’s detention conditions.[29] Since then, Greenwald has been a strong supporter of Manning. He calls Manning “a whistle-blower acting with the noblest of motives”, and “a national hero similar to Daniel Ellsberg.”[30]
The Guardian
Greenwald left Salon.com on August 20, 2012 for The Guardian, citing “the opportunity to reach a new audience, to further internationalize my readership, and to be re-invigorated by a different environment” as reasons for the move.[31]
Greenwald has been placed on numerous ‘top 50’ and ‘top 25’ lists of columnists in the United States.[37][38][39][40][41][42][43][44][45] In June, 2012, Newsweek magazine named him one of America’s Top 10 Opinionists, saying that “a righteous, controlled, and razor-sharp fury runs through a great deal” of his writing, and: “His independent persuasion can make him a danger or an asset to both sides of the aisle.”[46]
Personal life
Greenwald is gay, and lives most of the time in Rio de Janeiro, the hometown of his Brazilian partner, David Michael Miranda.[18][47][48][49][50] In a profile in Out magazine, Greenwald explained that his residence in Brazil is due to the fact that American law, the Defense of Marriage Act (DOMA), bars the federal recognition of same-sex marriages and thus prevents his partner from obtaining immigration rights in the US.[51]
Greenwald and his partner have 11 dogs, all rescued from the street,[52][53], and he frequently picks up dogs from the street and uses his platforms to find homes for them.[54][55][56]
Books
Greenwald’s first book, How Would a Patriot Act? Defending American Values From a President Run Amok, was published by Working Assets in 2006. It was a New York Times bestseller,[57] and ranked #1 on Amazon.com both before its publication (due to pre-orders based on attention from ‘UT’ readers and other bloggers) and for several days after its release, ending its first week at #293.[58]
A Tragic Legacy, his second book, examines the presidency of George W. Bush “with an emphasis on his personality traits and beliefs that drove the presidency (along with an emphasis on how and why those personality traits have led to a presidency that has failed to historic proportions).”[59] Published in hardback by Crown (a division of Random House) on June 26, 2007 and reprinted in a paperback edition by Three Rivers Press on April 8, 2008, it too was a New York Times Best Seller, also ranking #1 for a day on Amazon.com’s Non-Fiction Best Seller List and #2 the next day (also due to heavy “discussions and promotions by blogs – a campaign catalyzed by Jane Hamsher [at FireDogLake]”, according to Greenwald).[60]
His third book, entitled Great American Hypocrites: Toppling the Big Myths of Republican Politics, was published by Random House in April 2008, the same month that Three Rivers Press reissued A Tragic Legacy in paperback.[61][62]
His fourth book, With Liberty and Justice for Some: How the Law Is Used to Destroy Equality and Protect the Powerful, was released by Metropolitan Books (of Henry Holt and Company) in October 2011.
Political views
Greenwald is critical of actions jointly supported by Democrats and Republicans, writing: “the worst and most tyrannical government actions in Washington are equally supported on a fully bipartisan basis.”[63] In the preface to his first book, How Would a Patriot Act? (2006), Greenwald opens with some of his own personal political history, describing his ‘pre-political’ self as neither liberal nor conservative as a whole, voting neither for George W. Bush nor for any of his rivals (indeed, not voting at all).[64]
Bush’s ascendancy to the U.S. Presidency “changed” Greenwald’s previous uninvolved political attitude toward the electoral process “completely”:
Over the past five years, a creeping extremism has taken hold of our federal government, and it is threatening to radically alter our system of government and who we are as a nation. This extremism is neither conservative nor liberal in nature, but is instead driven by theories of unlimited presidential power that are wholly alien, and antithetical, to the core political values that have governed this country since its founding”; for, “the fact that this seizure of ever-expanding presidential power is largely justified through endless, rank fear-mongering—fear of terrorists, specifically—means that not only our system of government is radically changing, but so, too, are our national character, our national identity, and what it means to be American.”[64]
Believing that “It is incumbent upon all Americans who believe in that system, bequeathed to us by the founders, to defend it when it is under assault and in jeopardy. And today it is”, he stresses: “I did not arrive at these conclusions eagerly or because I was predisposed by any previous partisan viewpoint. Quite the contrary.”[64]
Resistant to applying ideological labels to himself, he emphasizes repeatedly that he is a strong advocate for U.S. constitutional “balance of powers”[14] and for constitutionally-protected civil and political rights in his writings and public appearances.[6]
Throughout his work he has relentlessly criticized the policies of the George W. Bushadministration and those who support or enable it, arguing that most of the American “Corporate News Media” excuse Bush’s policies and echo administration talking points rather than asking hard questions.[49][32]
Regarding civil liberties in the age of Obama, he elaborated on his conception of change when he said, “I think the only means of true political change will come from people working outside of that [two-party electoral] system to undermine it, and subvert it, and weaken it, and destroy it; not try to work within it to change it.”[65] He did, however, raise money for Russ Feingold’s 2010 Senate re-election bid,[66] Bill Halter’s 2010 primary challenge to Democratic Sen. Blanche Lincoln [67] as well as several Congressional candidates in 2012 he described as “unique”.[68]
Greenwald has been criticized regarding his positions which are critical of Israel’s foreign policy and influence on U.S. politics.[69][70][71][72][73]
Segment 1: Beyond Top Tier–First In The Hearts and Minds Of The American People and Founding Fathers–The One–Ron Paul–Restoring Liberty, Peace and Prosperity–Videos
Segment 0: The Warfare and Welfare Economy Worsens With 30 Americans Killed and Over 45 Million Americans On Food Stamps–American People Want A Peace and Prosperity Economy–A Paycheck Not Food Stamps–Stop Out Of Control Spending On Government Interventions Abroad and At Home–Videos
Segment 1: More GORE–Great Obama Recession Economy–Government Treasury Securities Downgraded From AAA to AA+ With A Negative Outlook By Standard & Poor’s Rating Agency–Too Little Too Late–The Austrian School of Economics Was Right!–Videos
Segement 0: Will Tea Party Caucus Vote As A Block Against Democratic and Republican Establishment Compromise Bill On Raising National Debt Ceiling By $900 Billion, Adding Over $7,000 Billion To National Debt In The Next Ten Years Plus A Huge Tax Hike in 2013?–The American People Would Like To Know!–Videos
Segment 1: The Second Obama Recession Starts Or The Great Obama Depression Continues–The Growth Rate of Gross Domestic Product Declines For Four Consecutive Quarters–The Economy Has Peaked And Entered A Period Of Stagflation–Rising Prices, Unemployment And Obama Misery Index!–Ron Paul To The Rescue?–Videos
Segment 0: Tea Party Democrats, Republicans, and Independents Betrayed–Tell The Democratic and Republican Establishments To Balance The Budget and Cut The Debt Ceiling–Just Say No To Obama, Reid, Boehner and Ryan Unbalanced Budgets–Videos
Pronk Pops Show 37, July 20, 2011: Segment 1: The American People’s Solution To Economic Stagnation: Increase National Debt Ceiling By $2,000 Billion To $16,300 Billion In Exchange For Passage of A Balanced Budget Amendment And The FairTax Bills And Repealing The Income Tax 16th Amendment To U.S. Constitution–A Balanced, Fair And Transparent Approach To Creating Jobs and Growing A Peace and Prosperity Economy–Videos
Segment 0: Lipstick On A Pig–Great Obama Depression– Deeper and Longer–Official U-3 Unemployment Rate Hits 9.2% In June 2011 With 14 Million Unemployed and Total Unemployment Rate U-6 Hits 16.2% With Over 24.8 Million Americans Seeking Full Time Job–Obama Is Not Working–2012–End An Error!–Fire Obama–Videos
Segment 3: Obama’s Gungate: Operation Fast and Furious–Arming Mexican Drug Cartels and Criminals–Killing American and Mexican Citizens–A Pretext For The Ultimate Aim of Disarming The American People and Repealing the Second Amendment–Department of Justice, Department of Homeland Security, FBI, BATFE, ICE and DEA Coverup and Stonewalling–Call For Special Prosecutor–President Obama and Attorney General Holder Should Be Impeached For Obstruction of Justice–Videos–Updated
Segment 4: Ron Paul won’t seek re election for Congress–Why? Can You Say–President Ron Paul–Vote For A Committed and Principled Constitutionalist–The Peace and Prosperity Candidate For President–Ron Paul–Videos
Segment 1: The Legal Standard In A Murder Case: Prove It Beyond A Reasonable Doubt–Suspicion And Opinion Is Not Enough–Casey Anthony Murder Case–Not Guilty–Videos
Segment 2: George Bureau of Investigations Finds Atlanta School Teachers and Principals Cheating Scandal:Raised Students Scores On Tests –Government Corrupt Schools–
Segment 3: Obama’s Marxist Class Warfare On Millionaires and Billionaires–Tax The Job Creators–President’s Unbalanced Budget Would Result In A Big $1,100 Billion Deficit In Fiscal Year 2012–This Is Obama’s So-Called Balanced Approach–Obama Is Not Working–Fire Obama Right Now!–Videos
Segment 1: Is Ron Paul An Isolationist–No–He Is For Free Trade and A Nonterventionist Foreign Policy–Are The NeoCons Warmongers–Yes–Aggressive Interventionist Foreign Policy–Empire or Nation Building!–Videos
Segment 2: Cut, Cap, And Balance Pledge–The Washington D.C. Howdy Doody Debt Ceiling Show–“Say Kids What Time Is It?”–Howdy Doody Time–Fiscal Year 2020 Balanced Budget Time–Not Serious–Send In The Clowns–There Already There!– Videos
Segment 0: Jon Huntsman Launches 2012 Candidacy for President At Liberty Park–Should Become A Democrat Like John V. Lindsay And Run Against President Obama in 2012!–Videos
Segment 1: Republican Candidates For President Romney, Cain, and Johnson Refuse To Sign Pro-Life Citizen’s Pledge–While Sarah Palin’s Trig’s Creator E-Mail Moves Millions–Videos
Segment 2: Rick Perry/Sarah Palin Republican Establishment Candidate Ticket vs. Ron Paul/Michele Bachmann Republican Constitutional Candidate Ticket for the 2012 Presidential Race–Videos
Segment 2: The Political Issues of 2012 Elections: #1–Unemployment–Jobs, #2–Government Spending–Balanced Budgets, #3-Tax Reform–The FairTax, #4-Inflation–End The Fed, #5-Wars–Bring The Troops Home–Videos
Segment 2: June 2011–Unemployment Situation Worsens–9.1% Official Unemployment Rate (U-3) with 13,900,000 Unemployed and 15.8% Total Unemployment Rate (U-6) With 24,283,000 Americans Looking For Full Time Jobs!–Great Obama Depression (GOD)!–Videos
Segment 3: Last Dance For Love–Congress Blocks Debt Limit Hike–For Now–Who Is The Political Class Fooling–Bring The Troops and Jobs Home and Send The Bureaucrats and Big Spenders Home–Save Medicare and Social Security–Hot Stuff–Videos
Segment 1: Herman Cain–The Tea Party Movement Candidate–Running On Cutting Spending, Opposing Higher Debt Ceiling, Enforcing Immigration Laws, Defunding Planned Parenthood, Nominating Pro Life Judges, And Passing The FairTax–Common Sense Solutions!–Videos
Segment 2: Taxman Obama’s Hidden Tax Increase On The Rich That Results In Fewer Jobs And Lower Economic Growth vs. Ryan’s Long and Winding Road To Economic Stagnation vs. Senators Lee, DeMint and Paul’s Stairway To Peace and Prosperity With A Balanced Budget!–Videos
Segment 4: Memo To Washington Republican Party Establishment–You Are Not Listening To The American People–Read Our Lips–“Cut Spending and Balance The Budget Starting With Fiscal Year 2012”–Videos
Segment 1: Segment 1: Newt Gingrich Running For President As A Big Government Interventionist Republican Progressive aka Green “Compassionate” Conservative?–Favors Individual Health Care Mandates While Attacking Paul Ryan As A Right Wing Radical Social Engineer For Proposing A Premium Support or $15,000 Voucher System To Save Medicare From Bankruptcy!–Videos
Segment 2: Leave It To Beaver–Newt Gingrich–The Beaver Puppet of The Republican Washington D.C. Establishment Political Class With It Social Engineered Warfare and Welfare Economy with A $3,500 Billion Unbalanced Budget For Fiscal Year 2012 with Nearly $1,000 Billion In Deficit Spending!–Videos
Segment 4: Ron Paul Is Running For President of The United States In 2012!–The Third Time Is The Charm–A Man Of Integrity–A Candidate For Peace and Prosperity–Neither A Big Government Warfare Republican Nor A Massive Government Welfare Democrat–A Man Of And For The American People–A Tea Party Patriot–Ron Paul–Videos
Segment 1: Bureau of Labor Statistics Official Unemployment Rate (U-3) Increased To 9.0% With 13.7 Million Americans Unemployed and Total Unemployment Rate (U-6) Increased To 15.9% With 24.4 Million Americans Seeking Full Time Job–Economy Adds 244,000 Jobs But Initial Unemployment Claims Hit Eight Month High of 474,000!–Videos
Segment 1: Ron Paul Is Running For President of The United States In 2012!–The Third Time Is The Charm–A Man Of Integrity–A Candidate For Peace and Prosperity–Neither A Big Government Warfare Republican Nor A Massive Government Welfare Democrat–A Man Of And For The American People–A Tea Party Patriot–Ron Paul–Videos
Segment 2: President Obama’s Fiscal Year 2012 Budget Speech Of April 13, 2011–Eat The Rich And Killing The American Dream Class Warfare–Cuts National Security Spending and Raise Taxes On The Rich–Produces Massive Deficits, National Debt, and Higher Unemployment For 12 More Years–Progressive Radical Socialist Economic Stagflation–Videos
Segment 3: The FairTax (National Consumption Sales Tax) vs. The Flat Tax (One Rate Federal Income Tax)–Who Pays The Most Federal Individual Income Tax? Videos
Segment 1: Tea Party Movement Demands Passage of Balanced Budget Amendment and The FairTax As The Price For Raising The National Statutory Debt Limit of $ 14,294,000,000 One Last Time By $1,000,000,000,000!–Videos
Segment 2: The FairTax (National Consumption Sales Tax) vs. The Flat Tax (One Rate Federal Income Tax)–Who Pays The Most Federal Individual Income Tax? Videos
Segment 1: 3,500,000 Million Americans Unemployed in March 2011 Still Exceeds Great Depression High of 13,000,000 In March 1933–The Obama Depressions Continues–Bureau of Labor Statistics: 8.8% Official Unemployment Rate (U-3) vs. Gallup Unemployment Rate of 10.0%–Nonfarm Payroll Increased By 216,000–The Government Makes The Depression Worse!–Videos
Segment 2: Obama’s Anti-American, Anti-Capitalist, Anti-Growth, Anti-Jobs, and Anti-Security Energy Policy–Videos
Segment 3: Republican Establishment Will Propose A Ten Year $6,200 Billion Cut In Spending Over Ten Years–The Problem Is It Does Not Balance The Budget For Another Five Years At The Earliest–Tea Party Movement Demands Balanced Budgets Starting In 2012 For The Next Ten Years!–A Jet Plane To Prosperity Not A Path To Prosperity–Videos
Segment 4: Just One More Thing Congressman Ryan: When Does The Republican’s Path To Prosperity Balance The Budget?–The Twelth of Never!–Videos
For additional information and videos on the above segments:
Segment 1: The Truth And Consequences About Undeclared Wars–Real Strange Bedfellows–Obama Allies U.S. with Libyan Rebels Including Islamic Jihadists, Moslem Brotherhood, and Al-Qaeda!–Give Peace A Chance–AC-130 Gunship–A-10 Warthogs–F-15E Strike Eagles and Special Operation Smash Squads
Segment 2ne Unconstitutional and Undeclared War Too Many: The Great Pretender, Peace Candidate And Noble Peace Prize Winner, President Barack Obama Undeclared War On Libya’s Muammar Ghaddafi In Defense Of Libyian Islamic Fighting Group (LIFG) Rebels Linked To al-Qaeda and The BP Libyian Oil Deal Linked To Obama Campaign Contributions–A Political Payoff!–Obama Has To Go In 2012–Videos
Segment 3:Earthquake Damages Japanese Nuclear Plant At Fukushima Daiichi, Four Explosions and Four Nuclear Reactors Flooded With Seawater To Contain Release Of Radioactive Material and Plant Released Radioactive Materials To Stop Pressure Buildup–Partial Meltdown Of Nuclear Core Feared–Radioactive Material Escaping From Plant–Over 250,000 Ordered Evacuated From 20 Kilometer (12.4 Miles) Radius From Plant–Videos
Segment 1: The Washington Political Elites of Both Parties Are Not Serious About Balancing The Federal Budget And Funding Entitlement Liabilities–Send In The Clowns–Don’t Bother There Here–Videos
Segment 2, Gallup–U.S. Unemployment Hits 10.3% In February 2011 Vs. Bureau of Labor Statistics (BLS) U.S. Unemployment Rate Declined By .1% To 8.9% in February 2011 With Job Creation of 192,000 In February 2011–Over 13.7 Million Americans Unemployed More Than Worse Month of Great Depression!
For more information and videos related to this show click on links below:
President Obama’s Saint Valentine’s Massacre of The American People–Fiscal Year 2012 Budget Buster–Spending $3,729 Billion–Taxes $2,627 Billion–Deficit $1,101 Billion–Dead On Arrival–DOA– 3 Million Tea Party Patriots To March On Washington D.C. On Friday, April 15, 2011 In Protest!
For more information and videos related to this show click on link below:


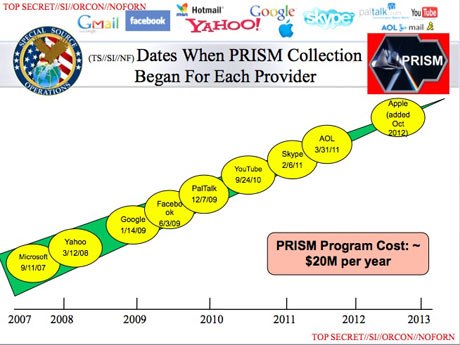


You must be logged in to post a comment.