Archive for September 3rd, 2010
Paul Craig Roberts–Peak Jobs–Videos
Press TV-On the edge with Max Keiser-Max Keiser talking to Paul Craig Roberts-07-16-2010(Part1)
Press TV-On the edge with Max Keiser-Max Keiser talking to Paul Craig Roberts-07-16-2010(Part2)
Press TV-On the edge with Max Keiser-Max Keiser talking to Paul Craig Roberts-07-16-2010(Part3)
Related Posts On Pronk Palisades
Economists
The Battle For The World Economy–Videos
Frederic Bastiat–The Law–Videos
Walter Block–Videos
Walter Block–Introduction To Libertarianism–Videos
Hunter Lewis–Where Keynes Went Wrong–Videos
Thomas DiLorenzo–The Economic Model of the Fascist State–Videos
Richard Ebeling–America’s New Road to Serfdom and the Continuing Relevance of Austrian Economics –Videos
Paul Edward Gottfried–Fascism, Anti-Fascism, and the Welfare State–Videos
David Gordon–Five Best Books on the Current Crisis–Video
David Gordon–The Confused Literature of Globalization–Videos
Friedrich Hayek–Videos
Henry Hazlitt–Economics In One Lesson–Videos
Robert Higgs–The Complex Path of Ideological Change–Videos
Robert Higgs–The Great Depression and the Current Recession–Videos
Robert Higgs–Why Are Politicians Always Trying to Scare Us?–Videos
Jörg Guido Hülsmann–The Ethics of Money Production–Videos
Jörg Guido Hülsmann–The Life and Work of Ludwig von Mises–Videos
Milton Friedman–Videos
Milton Friedman on Education–Videos
Milton Friedman–Debate In Iceland–Videos
Milton Friedman–Free To Choose–On Donahue –Videos
Israel Kirzner–On Entrepreneurship–Vidoes
Paul Krugman–Videos
Hunter Lewis–Where Keynes Went Wrong–Videos
Liberal Fascism–Jonah Goldberg–Videos
Dan Mitchell–Videos
Ludwig von Mises–Videos
Robert P. Murphy–Videos
Robert P. Murphy–Government Stimulus: Repeating the mistakes of the Great Depression–Videos
Gary North–Keynes and His Influence–Take The North Challenge–Videos
The Fountainhead, Atlas Shrugged and The Ideas of Ayn Rand
George Gerald Reisman–Why Nazism Was Socialism and Why Socialism Is Totalitarian–Videos
Paul Craig Roberts–How The Economy Was Lost–The War Of The Worlds–Videos
Llewellyn H. Rockwell, Jr–How Empires Bamboozle the Bourgeoisie–Videos
Murray Rothbard–Videos
Murray N. Rothbard–Introduction to Economics: A Private Seminar–Videos
Murray Rothbard–Libertarianism–Video
Rothbard On Keynes–Videos
Murray Rothbard– What Has Government Done to Our Money?–Videos
Peter Schiff–Videos
Schiff, Forbers and Bloomberg Nail The Financial Crisis and Recession–Mistakes Were Made–Greed, Arrogance, Stupidity–Three Chinese Curses!
Larry Sechrest–The Anticapitalists: Barbarians at the Gate–Videos
L. William Seidman on The Economic Crisis: Causes and Cures–Videos
Amity Shlaes–Videos
Julian Simon–Videos
Julian Simon–The Ultimate Resource II: People, Materials, and Environment–Videos
Thomas Sowell and Conflict of Visions–Videos
Thomas Sowell On The Housing Boom and Bust–Videos
Econ Talk With Thomas Sowell–Videos
Peter Thiel–Videos
Thomas E. Woods, Jr.–Videos
Thomas E. Woods–The Economic Crisis and The Federal Reserve–Videos
Tom Woods–Lectures On Liberty–Videos
Thomas E. Woods–The Market Economy–Videos
Tom Woods On Personal Rights and Property Ownership
Tom Woods–Smashing Myths and Restoring Sound Money–Videos
Tom Woods–Who Killed The Constitution
Tom Wright On The FairTax–Videos
Banking Cartel’s Public Relations Campaign Continues:Federal Reserve Chairman Ben Bernanke On The Record
Read Full Post | Make a Comment ( None so far )Paul Craig Roberts–How The Economy Was Lost–The War Of The Worlds–Videos


Paul Craig Roberts Returns to Alex Jones Tv 1/4: A Journey into serfdom!
Paul Craig Roberts Returns to Alex Jones Tv 2/4: A Journey into serfdom!
Paul Craig Roberts Returns to Alex Jones Tv 3/4: A Journey into serfdom!
Paul Craig Roberts Returns to Alex Jones Tv 4/4: A Journey into serfdom!
Related Posts On Pronk Palisades
Collectivism: Socialism, Communism, Progressivism and Fascism
Progressivism America’s Cancer–Videos
The Battle For The World Economy–Videos
Walter Block–Videos
Thomas DiLorenzo–The Economic Model of the Fascist State–Videos
G. William Domhoff: Who Runs America–Videos
Jonah Goldberg–Liberal Fascism–Videos
Paul Edward Gottfried–Fascism, Anti-Fascism, and the Welfare State–Videos
G. Edward Griffin- On Individualism vs. Collectivism–Videos
Robert Higgs–The Complex Path of Ideological Change–Videos
Mark Levin–Liberty and Tyranny: A Conservative Manifesto–Videos
Hunter Lewis–Where Keynes Went Wrong–Videos
Jeffrey Miron–Obamaomics–Videos
Gary North–Keynes and His Influence–Take The North Challenge–Videos
George Gerald Reisman–Why Nazism Was Socialism and Why Socialism Is Totalitarian–Videos
Today’s Progressives–Obama’s Radical Socialist Democratic Party
The Racist Test for Judge Sonya Sotomayor and President Obama–Racism Unmasked!
Calling and Raising The Stakes for Race Card Players–Obama and Sotomayor
George Soros: Government Interventionist and Global Socialist–Obama’s Puppeter Master–Videos
George Soros: Barack Obama’s Money Man and Agenda Puppeter
The Cloward-Piven Strategy Of The Progressive Radical Socialists: Wrecking The U.S. Economy By Massive Government Dependence, Spending, Deficits, Debts, Taxes And Regulations!
President Barack Obama’s Role Model–President Franklin D. Roosevelt–The Worse President For The U.S. and World Economies and The American People–With The Same Results–High Unemployment Rates–Over 25 Million American Citizens Seeking Full Time Jobs Today–Worse Than The Over 13 Million Seeking Jobs During The Worse of The Great Depression!
Progressives
Progressive Radical Socialist Health Care Plan Written In Prison By Convicted Felon Richard Creamer!
Obamanomics–New Deal Progressive Radical Socialist Interventionism
Eugenics, Planned Parenthood, Population Control, and Designer Babies–Videos
The Great Depression and the Current Recession–Robert Higgs–Videos
The Obama Depression: Lessons Learned–Deja Vu!
Lord Christopher Monckton–Climate Change–Treaty–Videos
Progressive Radical Socialist Canned Criticism of American People: Danger, Profits, and Wrong Thinking
The Battle For The World Economy–Videos
Broom Budget Busting Bums: Replace The Entire Congress–Tea Party Express and Patriots–United We Stand!
Obama’s Civilian National Security Force–Youth Corp Wave–Friendly Fascism Faces–Cons–Crooks–Communists–Communities–Corps!
Obama’s Hidden Agenda and Covert Cadre of Marxists, Communists, Progressives, Radicals, Socialists–Far Left Democrats Destroying Capitalism and The American Republic
Yuri Bezmenov On KGB Soviet Propaganda and Subversion–Videos
The Bloody History of Communism–Videos
Obama Youth–Civilian National Security Force–National Socialism–Hitler Youth–Brownshirts– Redux?–Collectivism!
American Progressive Liberal Fascism–The Wave of The Future Or Back To Past Mistakes?
Today’s Progressives–Obama’s Radical Socialist Democratic Party
President Obama–Killer of The American Dream and Market Capitalism–Stop The Radical Socialists Before They Kill You!
The Progressive Radical Socialist Family Tree–ACORN & AmeriCorps–Time To Chop It Down
It Is Official–America On The Obama Road To Fascism–Thomas Sowell!
President Obama and His Keynesian Spending Cult of The Fascist Democrat Radicals–FDRs
Economists
The Battle For The World Economy–Videos
Frederic Bastiat–The Law–Videos
Walter Block–Videos
Walter Block–Introduction To Libertarianism–Videos
Hunter Lewis–Where Keynes Went Wrong–Videos
Thomas DiLorenzo–The Economic Model of the Fascist State–Videos
Richard Ebeling–America’s New Road to Serfdom and the Continuing Relevance of Austrian Economics –Videos
Paul Edward Gottfried–Fascism, Anti-Fascism, and the Welfare State–Videos
David Gordon–Five Best Books on the Current Crisis–Video
David Gordon–The Confused Literature of Globalization–Videos
Friedrich Hayek–Videos
Henry Hazlitt–Economics In One Lesson–Videos
Robert Higgs–The Complex Path of Ideological Change–Videos
Robert Higgs–The Great Depression and the Current Recession–Videos
Robert Higgs–Why Are Politicians Always Trying to Scare Us?–Videos
Jörg Guido Hülsmann–The Ethics of Money Production–Videos
Jörg Guido Hülsmann–The Life and Work of Ludwig von Mises–Videos
Milton Friedman–Videos
Milton Friedman on Education–Videos
Milton Friedman–Debate In Iceland–Videos
Milton Friedman–Free To Choose–On Donahue –Videos
Israel Kirzner–On Entrepreneurship–Vidoes
Paul Krugman–Videos
Hunter Lewis–Where Keynes Went Wrong–Videos
Liberal Fascism–Jonah Goldberg–Videos
Dan Mitchell–Videos
Ludwig von Mises–Videos
Robert P. Murphy–Videos
Robert P. Murphy–Government Stimulus: Repeating the mistakes of the Great Depression–Videos
Gary North–Keynes and His Influence–Take The North Challenge–Videos
The Fountainhead, Atlas Shrugged and The Ideas of Ayn Rand
George Gerald Reisman–Why Nazism Was Socialism and Why Socialism Is Totalitarian–Videos
Llewellyn H. Rockwell, Jr–How Empires Bamboozle the Bourgeoisie–Videos
Murray Rothbard–Videos
Murray N. Rothbard–Introduction to Economics: A Private Seminar–Videos
Murray Rothbard–Libertarianism–Video
Rothbard On Keynes–Videos
Murray Rothbard– What Has Government Done to Our Money?–Videos
Peter Schiff–Videos
Schiff, Forbers and Bloomberg Nail The Financial Crisis and Recession–Mistakes Were Made–Greed, Arrogance, Stupidity–Three Chinese Curses!
Larry Sechrest–The Anticapitalists: Barbarians at the Gate–Videos
L. William Seidman on The Economic Crisis: Causes and Cures–Videos
Amity Shlaes–Videos
Julian Simon–Videos
Julian Simon–The Ultimate Resource II: People, Materials, and Environment–Videos
Thomas Sowell and Conflict of Visions–Videos
Thomas Sowell On The Housing Boom and Bust–Videos
Econ Talk With Thomas Sowell–Videos
Peter Thiel–Videos
Thomas E. Woods, Jr.–Videos
Thomas E. Woods–The Economic Crisis and The Federal Reserve–Videos
Tom Woods–Lectures On Liberty–Videos
Thomas E. Woods–The Market Economy–Videos
Tom Woods On Personal Rights and Property Ownership
Tom Woods–Smashing Myths and Restoring Sound Money–Videos
Tom Woods–Who Killed The Constitution
Tom Wright On The FairTax–Videos
Banking Cartel’s Public Relations Campaign Continues:Federal Reserve Chairman Ben Bernanke On The Record
Insanity Economics–Stimulus Kicks In–Total Unemployment Rate (U-6) Jumps Up To 16.7% with 25.7 Million Americans Seeking Full Time Employment!
“Insanity: doing the same thing over and over again and expecting different results.”
~Albert Einstein
Companies Add 67K Workers, but Jobless Rate Rise

http://www.shadowstats.com/alternate_data/unemployment-charts
Official Unemployment Rate (U-3)
If you are one of the 25 million Americans seeking a full-time job, the August 2010 unemployment report from the Department of Labor’s Bureau of Labor statistics was discouraging.

The Bureau of Labor Statistics reported that in August, 2010, the official unemployment rate (U-3) rose from 9.5% in July to 9.6 % in August with 14.9 million Americans unemployed.
Real Total Unemployment Rate (U-6)

The real total unemployment rate (U-6) also rose from 16.5% in July to 16.7% in August with 25.7 million Americans seeking full-time employment.
If you are young, black or Hispanic, the unemployment rate is considerably high.
The unemployment rate for young workers ages 16 through 19 years rose from 26.1% in July to 26.3% in August.
For black or African Americans the unemployment rate also rose from 15.6% in July to 16.3 in August.
For Hispanics the unemployment rate decreased from 12.1% in July to 12.0% in August.
To put these rate of unemployment in historical perspective the graph below shows the U-3 and U-6 unemployment rates from 1900 through 2009:
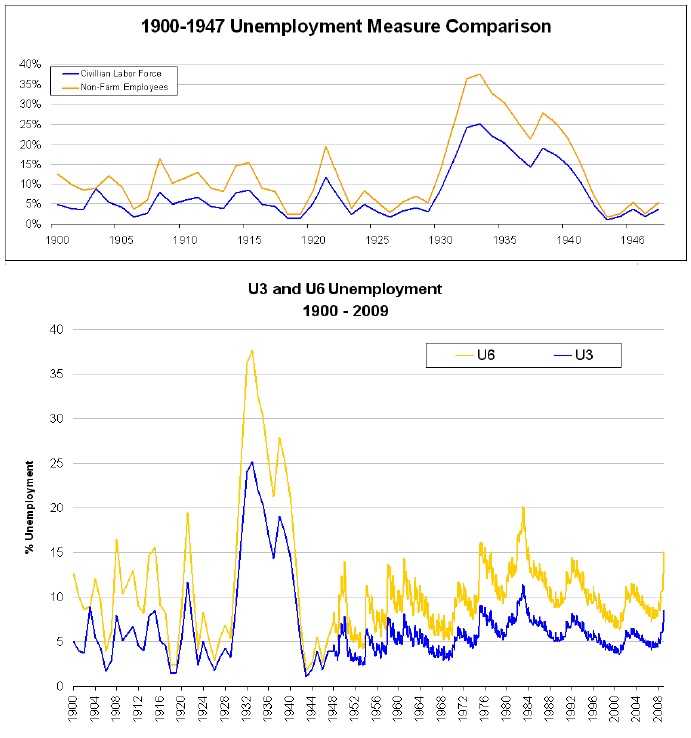


Source: Historical Unemployment In Relation Today By N. Andrews
http://www.scribd.com/doc/13282170/Unemployment-1930s-vs-Today
The Department of Labor, Bureau or Labor Statistics, publishes several unemployment rates series of data including:
- U-1: Persons unemployed 15 weeks or longer, as a percent of the civilian labor force
- U-2: Job losers and persons who completed temporary jobs, as a percent of the civilian labor force
- U-3: Total unemployed, as a percent of the civilian labor force (official unemployment rate)
- U-4: Total unemployed plus discouraged workers, as a percent of the civilian labor force plus discouraged workers
- U-5: Total unemployed, plus discouraged workers, plus all other marginally attached workers, as a percent of the civilian labor force plus all marginally attached workers
- U-6: Total unemployed, plus all marginally attached workers, plus total employed part time for economic reasons, as a percent of the civilian labor force plus all marginally attached workers
Marginally attached workers: In the United States, persons not in the labor force who want and are available for a job and who have looked for work sometime in the past 12 months (or since the end of their last job if they held one within the past 12 months), but who are not currently looking, are designated as “marginally attached to the labor force.”
The marginally attached are divided into those not currently looking because they believe their search would be futile—so-called “discouraged workers”—and those not currently looking for other reasons such as family responsibilities, ill health, or lack of transportation.
Source: Bureau of Labor Statistics
Each month there are new entrants into the labor market as students either graduate from high school and college or drop-out and look for jobs for the first time. The United States needs to add approximately 150,000 jobs each month to keep the unemployment rate constant. There are currently approximately 154 million individuals in the civilian labor force. Each month to reduce the unemployment rate by .1%, a total of about 300,000 new jobs needs to be created.

In August the employment level increased from 138,960,000 in July to 139,250 or an increase of 290,000. When President Obama took office in January 2009 the employment level was 142,221,000. The so-called stimulus bill was suppose to limit the unemployment rate to a maximum of 8%. Instead the unemployment rate hit 10.1% in October 2009 and is expected to go over 10% in the coming months and be over 9% for two years or more.The stimulus package has failed to create jobs. Proposing another stimulus package would only make matters worse and prolong the recession.
Both the Bush and Obama expansion of the size and scope of the Federal Government and the passage of so-called government spending stimulus packages have resulted in less private investment and job creation by businesses. Business owners will not expand or grow their businesses when they lack confidence in the economic policies of the Federal Government. Economists call this regime uncertainty. This happened during the Great Depression that began with Hoover in 1930 and continued with Roosevelt from 1933 and through 1945. During World War II the unemployment level did fall dramatically as million of men were drafted to fight the war and men and women were employed to produce the weapons and munitions of war. However, prosperity did not return until 1946 when Federal Government spending was dramatically cut.
Government stimulus spending (Keynesian Economics) to increase economic growth and jobs did not work for Presidents Hoover, Roosevelt, Ford, Bush, and Obama. Keynesian economics is insanity economics–doing the same thing over and over again and expecting different results.
Instead, President Obama is seriously considering raising taxes by letting the Bush tax cuts expire in 2010, proposing another stimulus package and a cap-and-trade energy tax or alternatively a new additional tax, the value added tax.If implemeneeded the economic consequences will be another depression–the Obama Depression. No mention is ever made of cutting the size, scope and burden of the Federal Government, which is the real source of the problem. Government interventionism in the form of fiscal and monetary policies caused both the financial and economic crisis we are currently in. More of the same economic policies is insanity economics. The Keynesian economists are running the asylum.
If you are a high school or college student stay in school and complete your education. Go to your local college career services office to obtain assistance in writing cover letters and resumes and finding employment. Do not be discouraged if it takes longer to find a job. Just keep sending out those resumes and networking and sooner or latter you will find a job.
“Permanent mass unemployment destroys the moral foundations of the social order. The young people, who, having finished their training for work, are forced to remain idle, are the ferment out of which the most radical political movements are formed. In their ranks the soldiers of the coming revolutions are recruited.”
~Ludwig von Mises, Socialism, page 440
Ron Paul EXPOSES the Real GDP and Unemployment Numbers
Keynesian Economics Is Wrong: Bigger Gov’t Is Not Stimulus
Stimulus II: A Sequel America Can’t Afford
Dan Mitchell on whether Obama’s economic team should resign
Dan Mitchell on Entitlement Spending
Dan Mitchell on Taxing the Rich
Why You’ve Never Heard of the Great Depression of 1920 | Thomas E. Woods, Jr.
Keynesian Predictions vs. American History | Thomas E. Woods, Jr.
Smashing Myths and Restoring Sound Money | Thomas E. Woods, Jr.
Best Books Criticizing Keynesian Economics | David Gordon
Background Articles and Videos
Types of Unemployment and the Natural Rate of Unemployment- Key Macro Concepts
(Macro) Episode 18: Unemployment
(Macro) Episode 19: Unemployment
Series Id:           LNS12000000
Seasonally Adjusted
Series title:        (Seas) Employment Level
Labor force status:  Employed
Type of data:        Number in thousands
Age:                 16 years and over


| Year | Jan | Feb | Mar | Apr | May | Jun | Jul | Aug | Sep | Oct | Nov | Dec | Annual |
|---|---|---|---|---|---|---|---|---|---|---|---|---|---|
| 2000 | 136559(1) | 136598 | 136701 | 137270 | 136630 | 136940 | 136531 | 136662 | 136893 | 137088 | 137322 | 137614 | |
| 2001 | 137778 | 137612 | 137783 | 137299 | 137092 | 136873 | 137071 | 136241 | 136846 | 136392 | 136238 | 136047 | |
| 2002 | 135701 | 136438 | 136177 | 136126 | 136539 | 136415 | 136413 | 136705 | 137302 | 137008 | 136521 | 136426 | |
| 2003 | 137417(1) | 137482 | 137434 | 137633 | 137544 | 137790 | 137474 | 137549 | 137609 | 137984 | 138424 | 138411 | |
| 2004 | 138472(1) | 138542 | 138453 | 138680 | 138852 | 139174 | 139556 | 139573 | 139487 | 139732 | 140231 | 140125 | |
| 2005 | 140245(1) | 140385 | 140654 | 141254 | 141609 | 141714 | 142026 | 142434 | 142401 | 142548 | 142499 | 142752 | |
| 2006 | 143142(1) | 143444 | 143765 | 143794 | 144108 | 144370 | 144229 | 144631 | 144797 | 145292 | 145477 | 145914 | |
| 2007 | 146032(1) | 146043 | 146368 | 145686 | 145952 | 146079 | 145926 | 145685 | 146193 | 145885 | 146483 | 146173 | |
| 2008 | 146421(1) | 146165 | 146173 | 146306 | 146023 | 145768 | 145515 | 145187 | 145021 | 144677 | 143907 | 143188 | |
| 2009 | 142221(1) | 141687 | 140854 | 140902 | 140438 | 140038 | 139817 | 139433 | 138768 | 138242 | 138381 | 137792 | |
| 2010 | 138333(1) | 138641 | 138905 | 139455 | 139420 | 139119 | 138960 | 139250 | |||||
| 1 : Data affected by changes in population controls. | |||||||||||||
Civilian Labor Force Level

Series Id:           LNS11000000
Seasonally Adjusted
Series title:        (Seas) Civilian Labor Force Level
Labor force status:  Civilian labor force
Type of data:        Number in thousands
Age:                 16 years and over


| Year | Jan | Feb | Mar | Apr | May | Jun | Jul | Aug | Sep | Oct | Nov | Dec | Annual |
|---|---|---|---|---|---|---|---|---|---|---|---|---|---|
| 2000 | 142267(1) | 142456 | 142434 | 142751 | 142388 | 142591 | 142278 | 142514 | 142518 | 142622 | 142962 | 143248 | |
| 2001 | 143800 | 143701 | 143924 | 143569 | 143318 | 143357 | 143654 | 143284 | 143989 | 144086 | 144240 | 144305 | |
| 2002 | 143883 | 144653 | 144481 | 144725 | 144938 | 144808 | 144803 | 145009 | 145552 | 145314 | 145041 | 145066 | |
| 2003 | 145937(1) | 146100 | 146022 | 146474 | 146500 | 147056 | 146485 | 146445 | 146530 | 146716 | 147000 | 146729 | |
| 2004 | 146842(1) | 146709 | 146944 | 146850 | 147065 | 147460 | 147692 | 147564 | 147415 | 147793 | 148162 | 148059 | |
| 2005 | 148029(1) | 148364 | 148391 | 148926 | 149261 | 149238 | 149432 | 149779 | 149954 | 150001 | 150065 | 150030 | |
| 2006 | 150201(1) | 150629 | 150839 | 150915 | 151085 | 151368 | 151383 | 151729 | 151650 | 152020 | 152360 | 152698 | |
| 2007 | 153117(1) | 152941 | 153093 | 152531 | 152717 | 153045 | 153039 | 152781 | 153393 | 153158 | 153767 | 153869 | |
| 2008 | 154048(1) | 153600 | 153966 | 153936 | 154420 | 154327 | 154410 | 154696 | 154590 | 154849 | 154524 | 154587 | |
| 2009 | 154140(1) | 154401 | 154164 | 154718 | 154956 | 154759 | 154351 | 154426 | 153927 | 153854 | 153720 | 153059 | |
| 2010 | 153170(1) | 153512 | 153910 | 154715 | 154393 | 153741 | 153560 | 154110 | |||||
| 1 : Data affected by changes in population controls. | |||||||||||||
Labor Force Participation Rate
Series Id:           LNS11300000
Seasonally Adjusted
Series title:        (Seas) Labor Force Participation Rate
Labor force status:  Civilian labor force participation rate
Type of data:        Percent or rate
Age:                 16 years and over


| Year | Jan | Feb | Mar | Apr | May | Jun | Jul | Aug | Sep | Oct | Nov | Dec | Annual |
|---|---|---|---|---|---|---|---|---|---|---|---|---|---|
| 2000 | 67.3 | 67.3 | 67.3 | 67.3 | 67.1 | 67.1 | 66.9 | 66.9 | 66.9 | 66.8 | 66.9 | 67.0 | |
| 2001 | 67.2 | 67.1 | 67.2 | 66.9 | 66.7 | 66.7 | 66.8 | 66.5 | 66.8 | 66.7 | 66.7 | 66.7 | |
| 2002 | 66.5 | 66.8 | 66.6 | 66.7 | 66.7 | 66.6 | 66.5 | 66.6 | 66.7 | 66.6 | 66.4 | 66.3 | |
| 2003 | 66.4 | 66.4 | 66.3 | 66.4 | 66.4 | 66.5 | 66.2 | 66.1 | 66.1 | 66.1 | 66.1 | 65.9 | |
| 2004 | 66.1 | 66.0 | 66.0 | 65.9 | 66.0 | 66.1 | 66.1 | 66.0 | 65.8 | 65.9 | 66.0 | 65.9 | |
| 2005 | 65.8 | 65.9 | 65.9 | 66.1 | 66.1 | 66.1 | 66.1 | 66.2 | 66.1 | 66.1 | 66.0 | 66.0 | |
| 2006 | 66.0 | 66.1 | 66.2 | 66.1 | 66.1 | 66.2 | 66.1 | 66.2 | 66.1 | 66.2 | 66.3 | 66.4 | |
| 2007 | 66.4 | 66.3 | 66.3 | 66.0 | 66.0 | 66.0 | 66.0 | 65.8 | 66.0 | 65.8 | 66.0 | 66.0 | |
| 2008 | 66.2 | 66.0 | 66.1 | 66.0 | 66.2 | 66.1 | 66.0 | 66.1 | 66.0 | 66.0 | 65.8 | 65.8 | |
| 2009 | 65.7 | 65.7 | 65.6 | 65.8 | 65.8 | 65.7 | 65.4 | 65.4 | 65.1 | 65.0 | 64.9 | 64.6 | |
| 2010 | 64.7 | 64.8 | 64.9 | 65.2 | 65.0 | 64.7 | 64.6 | 64.7 |
Unemployment Level
Series Id:           LNS13000000
Seasonally Adjusted
Series title:        (Seas) Unemployment Level
Labor force status:  Unemployed
Type of data:        Number in thousands
Age:                 16 years and over


| Year | Jan | Feb | Mar | Apr | May | Jun | Jul | Aug | Sep | Oct | Nov | Dec | Annual |
|---|---|---|---|---|---|---|---|---|---|---|---|---|---|
| 2000 | 5708 | 5858 | 5733 | 5481 | 5758 | 5651 | 5747 | 5853 | 5625 | 5534 | 5639 | 5634 | |
| 2001 | 6023 | 6089 | 6141 | 6271 | 6226 | 6484 | 6583 | 7042 | 7142 | 7694 | 8003 | 8258 | |
| 2002 | 8182 | 8215 | 8304 | 8599 | 8399 | 8393 | 8390 | 8304 | 8251 | 8307 | 8520 | 8640 | |
| 2003 | 8520 | 8618 | 8588 | 8842 | 8957 | 9266 | 9011 | 8896 | 8921 | 8732 | 8576 | 8317 | |
| 2004 | 8370 | 8167 | 8491 | 8170 | 8212 | 8286 | 8136 | 7990 | 7927 | 8061 | 7932 | 7934 | |
| 2005 | 7784 | 7980 | 7737 | 7672 | 7651 | 7524 | 7406 | 7345 | 7553 | 7453 | 7566 | 7279 | |
| 2006 | 7059 | 7185 | 7075 | 7122 | 6977 | 6998 | 7154 | 7097 | 6853 | 6728 | 6883 | 6784 | |
| 2007 | 7085 | 6898 | 6725 | 6845 | 6765 | 6966 | 7113 | 7096 | 7200 | 7273 | 7284 | 7696 | |
| 2008 | 7628 | 7435 | 7793 | 7631 | 8397 | 8560 | 8895 | 9509 | 9569 | 10172 | 10617 | 11400 | |
| 2009 | 11919 | 12714 | 13310 | 13816 | 14518 | 14721 | 14534 | 14993 | 15159 | 15612 | 15340 | 15267 | |
| 2010 | 14837 | 14871 | 15005 | 15260 | 14973 | 14623 | 14599 | 14860 |
Unemployment Rate
Series Id:           LNS14000000
Seasonally Adjusted
Series title:        (Seas) Unemployment Rate
Labor force status:  Unemployment rate
Type of data:        Percent or rate
Age:                 16 years and over


| Year | Jan | Feb | Mar | Apr | May | Jun | Jul | Aug | Sep | Oct | Nov | Dec | Annual |
|---|---|---|---|---|---|---|---|---|---|---|---|---|---|
| 2000 | 4.0 | 4.1 | 4.0 | 3.8 | 4.0 | 4.0 | 4.0 | 4.1 | 3.9 | 3.9 | 3.9 | 3.9 | |
| 2001 | 4.2 | 4.2 | 4.3 | 4.4 | 4.3 | 4.5 | 4.6 | 4.9 | 5.0 | 5.3 | 5.5 | 5.7 | |
| 2002 | 5.7 | 5.7 | 5.7 | 5.9 | 5.8 | 5.8 | 5.8 | 5.7 | 5.7 | 5.7 | 5.9 | 6.0 | |
| 2003 | 5.8 | 5.9 | 5.9 | 6.0 | 6.1 | 6.3 | 6.2 | 6.1 | 6.1 | 6.0 | 5.8 | 5.7 | |
| 2004 | 5.7 | 5.6 | 5.8 | 5.6 | 5.6 | 5.6 | 5.5 | 5.4 | 5.4 | 5.5 | 5.4 | 5.4 | |
| 2005 | 5.3 | 5.4 | 5.2 | 5.2 | 5.1 | 5.0 | 5.0 | 4.9 | 5.0 | 5.0 | 5.0 | 4.9 | |
| 2006 | 4.7 | 4.8 | 4.7 | 4.7 | 4.6 | 4.6 | 4.7 | 4.7 | 4.5 | 4.4 | 4.5 | 4.4 | |
| 2007 | 4.6 | 4.5 | 4.4 | 4.5 | 4.4 | 4.6 | 4.6 | 4.6 | 4.7 | 4.7 | 4.7 | 5.0 | |
| 2008 | 5.0 | 4.8 | 5.1 | 5.0 | 5.4 | 5.5 | 5.8 | 6.1 | 6.2 | 6.6 | 6.9 | 7.4 | |
| 2009 | 7.7 | 8.2 | 8.6 | 8.9 | 9.4 | 9.5 | 9.4 | 9.7 | 9.8 | 10.1 | 10.0 | 10.0 | |
| 2010 | 9.7 | 9.7 | 9.7 | 9.9 | 9.7 | 9.5 | 9.5 | 9.6 |
Total Unemployment Rate
Series Id:           LNS13327709
Seasonally Adjusted
Series title:        (seas) Total unemployed, plus all marginally attached workers plus total employed part time for economic reasons, as a percent of all civilian labor force plus all marginally attached workers
Labor force status:  Aggregated totals unemployed
Type of data:        Percent or rate
Age:                 16 years and over
Percent/rates:       Unemployed and mrg attached and pt for econ reas as percent of labor force plus marg attached
| Year | Jan | Feb | Mar | Apr | May | Jun | Jul | Aug | Sep | Oct | Nov | Dec | Annual |
|---|---|---|---|---|---|---|---|---|---|---|---|---|---|
| 2000 | 7.1 | 7.2 | 7.1 | 6.9 | 7.1 | 7.0 | 7.0 | 7.1 | 7.0 | 6.8 | 7.1 | 6.9 | |
| 2001 | 7.3 | 7.4 | 7.3 | 7.4 | 7.5 | 7.9 | 7.8 | 8.1 | 8.7 | 9.3 | 9.4 | 9.6 | |
| 2002 | 9.5 | 9.5 | 9.4 | 9.7 | 9.5 | 9.5 | 9.6 | 9.6 | 9.6 | 9.6 | 9.7 | 9.8 | |
| 2003 | 10.0 | 10.2 | 10.0 | 10.2 | 10.1 | 10.3 | 10.3 | 10.1 | 10.4 | 10.2 | 10.0 | 9.8 | |
| 2004 | 9.9 | 9.7 | 10.0 | 9.6 | 9.6 | 9.5 | 9.5 | 9.4 | 9.4 | 9.7 | 9.4 | 9.2 | |
| 2005 | 9.3 | 9.3 | 9.1 | 8.9 | 8.9 | 9.0 | 8.8 | 8.9 | 9.0 | 8.7 | 8.7 | 8.6 | |
| 2006 | 8.4 | 8.4 | 8.2 | 8.1 | 8.2 | 8.4 | 8.5 | 8.4 | 8.0 | 8.2 | 8.1 | 8.0 | |
| 2007 | 8.3 | 8.1 | 8.0 | 8.2 | 8.2 | 8.2 | 8.3 | 8.5 | 8.4 | 8.4 | 8.5 | 8.8 | |
| 2008 | 9.1 | 8.9 | 9.0 | 9.2 | 9.7 | 10.0 | 10.5 | 10.9 | 11.2 | 11.9 | 12.8 | 13.7 | |
| 2009 | 14.0 | 15.0 | 15.6 | 15.8 | 16.4 | 16.5 | 16.4 | 16.8 | 17.0 | 17.4 | 17.2 | 17.3 | |
| 2010 | 16.5 | 16.8 | 16.9 | 17.1 | 16.6 | 16.5 | 16.5 | 16.7 |
16–19 years olds Unemployment Rate
Series Id:           LNS14000012
Seasonally Adjusted
Series title:        (Seas) Unemployment Rate - 16-19 yrs.
Labor force status:  Unemployment rate
Type of data:        Percent or rate
Age:                 16 to 19 years
| Year | Jan | Feb | Mar | Apr | May | Jun | Jul | Aug | Sep | Oct | Nov | Dec | Annual |
|---|---|---|---|---|---|---|---|---|---|---|---|---|---|
| 2000 | 12.7 | 13.8 | 13.3 | 12.6 | 12.8 | 12.3 | 13.4 | 14.0 | 13.0 | 12.8 | 13.0 | 13.2 | |
| 2001 | 13.8 | 13.7 | 13.8 | 13.9 | 13.4 | 14.2 | 14.4 | 15.6 | 15.2 | 16.0 | 15.9 | 17.0 | |
| 2002 | 16.5 | 16.0 | 16.6 | 16.7 | 16.6 | 16.7 | 16.8 | 17.0 | 16.3 | 15.1 | 17.1 | 16.9 | |
| 2003 | 17.2 | 17.2 | 17.8 | 17.7 | 17.9 | 19.0 | 18.2 | 16.6 | 17.6 | 17.2 | 15.7 | 16.2 | |
| 2004 | 17.0 | 16.5 | 16.8 | 16.6 | 17.1 | 17.0 | 17.8 | 16.7 | 16.6 | 17.4 | 16.4 | 17.6 | |
| 2005 | 16.2 | 17.5 | 17.1 | 17.8 | 17.8 | 16.3 | 16.1 | 16.1 | 15.5 | 16.1 | 17.0 | 14.9 | |
| 2006 | 15.2 | 15.3 | 16.1 | 14.6 | 14.0 | 15.7 | 15.9 | 16.1 | 16.3 | 15.2 | 14.9 | 14.7 | |
| 2007 | 14.8 | 14.9 | 14.9 | 15.6 | 15.9 | 16.2 | 15.3 | 16.0 | 16.0 | 15.5 | 16.2 | 16.9 | |
| 2008 | 17.8 | 16.5 | 16.0 | 15.6 | 18.9 | 19.0 | 20.8 | 18.9 | 19.3 | 20.3 | 20.3 | 20.8 | |
| 2009 | 20.9 | 21.8 | 22.0 | 21.8 | 23.2 | 24.3 | 24.5 | 25.7 | 26.1 | 27.6 | 26.8 | 27.1 | |
| 2010 | 26.4 | 25.0 | 26.1 | 25.4 | 26.4 | 25.7 | 26.1 | 26.3 |
Black or African American Unemployment Rate
Series Id:           LNS14000006
Seasonally Adjusted
Series title:        (Seas) Unemployment Rate - Black or African American
Labor force status:  Unemployment rate
Type of data:        Percent or rate
Age:                 16 years and over
Race:                Black or African American


| Year | Jan | Feb | Mar | Apr | May | Jun | Jul | Aug | Sep | Oct | Nov | Dec | Annual |
|---|---|---|---|---|---|---|---|---|---|---|---|---|---|
| 2000 | 8.2 | 8.1 | 7.4 | 7.0 | 7.7 | 7.8 | 7.7 | 7.9 | 7.3 | 7.3 | 7.3 | 7.4 | |
| 2001 | 8.2 | 7.7 | 8.3 | 8.0 | 7.9 | 8.3 | 8.0 | 9.1 | 8.9 | 9.5 | 9.8 | 10.1 | |
| 2002 | 10.0 | 9.9 | 10.5 | 10.7 | 10.2 | 10.5 | 9.8 | 9.8 | 9.7 | 9.8 | 10.7 | 11.3 | |
| 2003 | 10.5 | 10.7 | 10.3 | 10.9 | 10.9 | 11.5 | 10.9 | 10.9 | 11.1 | 11.4 | 10.2 | 10.1 | |
| 2004 | 10.4 | 9.7 | 10.3 | 9.8 | 10.1 | 10.2 | 11.0 | 10.5 | 10.3 | 10.8 | 10.7 | 10.7 | |
| 2005 | 10.6 | 10.9 | 10.5 | 10.3 | 10.1 | 10.2 | 9.2 | 9.7 | 9.4 | 9.1 | 10.6 | 9.2 | |
| 2006 | 8.9 | 9.4 | 9.5 | 9.4 | 8.7 | 8.8 | 9.5 | 8.8 | 9.0 | 8.5 | 8.6 | 8.3 | |
| 2007 | 8.0 | 8.0 | 8.3 | 8.3 | 8.3 | 8.4 | 8.0 | 7.7 | 8.1 | 8.5 | 8.5 | 9.0 | |
| 2008 | 9.2 | 8.3 | 9.1 | 8.6 | 9.6 | 9.4 | 9.9 | 10.8 | 11.4 | 11.3 | 11.5 | 12.1 | |
| 2009 | 12.8 | 13.5 | 13.5 | 15.0 | 15.0 | 14.8 | 14.7 | 15.2 | 15.5 | 15.7 | 15.6 | 16.2 | |
| 2010 | 16.5 | 15.8 | 16.5 | 16.5 | 15.5 | 15.4 | 15.6 | 16.3 |
Hispanic or Latino Unemployment Rate
Series Id:           LNS14000009
Seasonally Adjusted
Series title:        (Seas) Unemployment Rate - Hispanic or Latino
Labor force status:  Unemployment rate
Type of data:        Percent or rate
Age:                 16 years and over
Ethnic origin:       Hispanic or Latino


| Year | Jan | Feb | Mar | Apr | May | Jun | Jul | Aug | Sep | Oct | Nov | Dec | Annual |
|---|---|---|---|---|---|---|---|---|---|---|---|---|---|
| 2000 | 5.6 | 5.7 | 6.1 | 5.5 | 5.8 | 5.6 | 5.8 | 5.9 | 5.8 | 5.1 | 6.0 | 5.7 | |
| 2001 | 5.8 | 6.1 | 6.2 | 6.4 | 6.3 | 6.6 | 6.2 | 6.5 | 6.7 | 7.1 | 7.3 | 7.7 | |
| 2002 | 7.8 | 7.0 | 7.5 | 8.0 | 7.1 | 7.4 | 7.4 | 7.5 | 7.4 | 7.9 | 7.8 | 7.9 | |
| 2003 | 7.9 | 7.6 | 7.8 | 7.6 | 8.1 | 8.4 | 8.1 | 7.7 | 7.3 | 7.4 | 7.5 | 6.6 | |
| 2004 | 7.4 | 7.4 | 7.5 | 7.1 | 7.0 | 6.6 | 6.9 | 6.8 | 6.9 | 6.7 | 6.7 | 6.5 | |
| 2005 | 6.2 | 6.4 | 5.8 | 6.4 | 5.9 | 5.7 | 5.5 | 5.8 | 6.5 | 5.9 | 6.2 | 6.1 | |
| 2006 | 5.7 | 5.5 | 5.2 | 5.3 | 4.9 | 5.2 | 5.2 | 5.3 | 5.5 | 4.7 | 5.1 | 5.0 | |
| 2007 | 5.7 | 5.2 | 5.1 | 5.4 | 5.8 | 5.6 | 5.9 | 5.5 | 5.8 | 5.6 | 5.8 | 6.3 | |
| 2008 | 6.4 | 6.2 | 6.9 | 6.9 | 6.9 | 7.7 | 7.5 | 8.0 | 8.0 | 8.9 | 8.8 | 9.4 | |
| 2009 | 9.9 | 11.0 | 11.6 | 11.4 | 12.7 | 12.3 | 12.4 | 13.0 | 12.7 | 13.1 | 12.7 | 12.9 | |
| 2010 | 12.6 | 12.4 | 12.6 | 12.5 | 12.4 | 12.4 | 12.1 | 12.0 |
The US Unemployment Rate
January 1948 to July 2010
http://www.miseryindex.us/URbymonth.asp
A portrait of the youth labor
market in 13 countries, 1980–2007
Gary Martin
Gary Martin is an economist in the Division of International Labor Comparisons, Bureau of Labor Statistics. E-mail: ILChelp@bls.gov
“…A relatively high unemployment rate for young people has been a persistent problem in industrialized countries
in recent decades; still, the number of youths who are unemployed has been falling with declining youth
populations and more years spent in education. …”
“…Youth unemployment rates are relatively higher for a number of reasons.7
First, young people are among the most vulnerable during an economic downturn when workers are being laid off and there are hiring slowdowns or freezes. Youths typically have the least seniority, the least work experience, and the least amount of company training invested in them, and they are more likely to be working on a short-term contract.8 They are, therefore, the most likely to be let go. Indeed, even if, on the one hand, there were no layoffs at all, but only a general hiring freeze, unemployment among young people would still grow as they attempted to move from school into the labor force upon completing their education; and if, on the other hand, employers were forced by economic conditions simply to be more discriminating in their hiring, those with no experience or with very little experience would be the least likely to be hired, and these, too, are most likely to be the young. Numerous studies have shown that youth unemployment rates are more sensitive to the business cycle than are adult unemployment rates.9
Second, whatever the state of the economy, young people simply have less experience in looking for work. Lack of experience at work is counteracted to a degree by the willingness and ability of youths to work for less money, but lack of experience in the process of finding a job is not.
Third, young people, generally with fewer resources than older workers and a stronger financial attachment to family, tend to be less mobile. Consequently, they are somewhat less able or willing to move to places where more jobs might be available. This is especially true for those in the 15- to 19-year-old category, and in countries where attachment to home is particularly strong, the more important that factor would be.
Fourth, young people, with fewer financial obligations and often with family support, can typically afford to take immediate employment less seriously—especially as family sizes have shrunk and the pressure to get a job to help support the family has subsided. The younger the prospective workers, the less serious they tend to be about paid work. If they are students, the jobs they are likely to get, or to lose, are typically not full-time, career-track jobs, and they usually pay very little. Young people sacrifice less by passing up such jobs than do older people, whose search for employment is typically for career-type jobs. Whether the jobs are career track jobs or not, young people with financial support from parents can usually afford to wait longer for just the right job to come along. Thus, in this instance, a higher rate of unemployment actually may reflect economic strength, rather than economic weakness, for youths.10…”
http://www.bls.gov/opub/mlr/2009/07/art1full.pdf
Current Employment Statistics – CES (National)
Frequently Asked Questions (FAQs)
The CES Survey: Concepts and Scope
- What is the establishment payroll survey?
- What is the CES definition of employment?
- Are part time employees counted in your survey?
- Who is included in data for production and nonsupervisory employees?
- How do reservists impact CES?
- Are employees in Puerto Rico included in national CES estimates?
- Are undocumented immigrants counted in the surveys?
- Why are there two monthly measures of employment?
- Does the establishment survey sample include small firms?
- Has the establishment survey understated employment growth because it excludes the self-employed?
http://www.youtube.com/watch?v=czcUmnsprQI&feature=related
The Road Ahead: Unemployment, Poverty and the Recession
Employment Situation Summary
Transmission of material in this release is embargoed            USDL-10-1212
until 8:30 a.m. (EDT) Friday, September 3, 2010

Technical information:
 Household data:       (202) 691-6378  *  cpsinfo@bls.gov  *  www.bls.gov/cps
 Establishment data:   (202) 691-6555  *  cesinfo@bls.gov  *  www.bls.gov/ces

Media contact:         (202) 691-5902  *  PressOffice@bls.gov

                       THE EMPLOYMENT SITUATION -- AUGUST 2010

Nonfarm payroll employment changed little (-54,000) in August, and the unem-
ployment rate was about unchanged at 9.6 percent, the U.S. Bureau of Labor
Statistics reported today. Government employment fell, as 114,000 temporary
workers hired for the decennial census completed their work. Private-sector
payroll employment continued to trend up modestly (+67,000).

Household Survey Data

The number of unemployed persons (14.9 million) and the unemployment rate
(9.6 percent) were little changed in August. From May through August, the
jobless rate remained in the range of 9.5 to 9.7 percent. (See table A-1.)

Among the major worker groups, the unemployment rate for adult men (9.8 per-
cent), adult women (8.0 percent), teenagers (26.3 percent), whites (8.7 per-
cent), blacks (16.3 percent), and Hispanics (12.0 percent) showed little
change in August. The jobless rate for Asians was 7.2 percent, not season-
ally adjusted. (See tables A-1, A-2, and A-3.)

The number of long-term unemployed (those jobless for 27 weeks and over) de-
clined by 323,000 over the month to 6.2 million. In August, 42.0 percent of
unemployed persons had been jobless for 27 weeks or more. (See table A-12.)

In August, the civilian labor force participation rate (64.7 percent) and
the employment-population ratio (58.5 percent) were essentially unchanged.
(See table A-1.)

The number of persons employed part time for economic reasons (sometimes re-
ferred to as involuntary part-time workers) increased by 331,000 over the
month to 8.9 million. These individuals were working part time because their
hours had been cut back or because they were unable to find a full-time job.
(See table A-8.)

About 2.4 million persons were marginally attached to the labor force in
August, little changed from a year earlier. (The data are not seasonally ad-
justed.) These individuals were not in the labor force, wanted and were avail-
able for work, and had looked for a job sometime in the prior 12 months. They
were not counted as unemployed because they had not searched for work in the
4 weeks preceding the survey. (See table A-16.)

Among the marginally attached, there were 1.1 million discouraged workers in
August, an increase of 352,000 from a year earlier. (The data are not season-
ally adjusted.) Discouraged workers are persons not currently looking for work
because they believe no jobs are available for them. The remaining 1.3 million
persons marginally attached to the labor force had not searched for work in the
4 weeks preceding the survey for reasons such as school attendance or family
responsibilities.

Establishment Survey Data

Total nonfarm payroll employment was little changed (-54,000) in August. Govern-
ment employment fell by 121,000, reflecting the departure of 114,000 temporary
Census 2010 workers from federal government payrolls. Total private employment
continued to trend up modestly over the month (+67,000). Since its most recent
low in December 2009, private-sector employment has risen by 763,000. (See
table B-1.)

Employment in health care increased by 28,000 in August, with the largest gains
occurring in ambulatory health care services (+17,000) and hospitals (+9,000).
Thus far in 2010, the health care industry has added an average of 20,000 jobs
per month, about in line with the average monthly job growth in 2009.

Mining employment rose by 8,000 in August. Since a recent low in October 2009,
employment in the industry has increased by 72,000. Support activities for mining
has accounted for about three-fourths of the gain.

Manufacturing employment declined by 27,000 over the month. A decline in motor
vehicles and parts (-22,000) offset a gain of similar magnitude in July as the
industry departed somewhat from its usual layoff and recall pattern for annual
retooling.

Within professional and business services, employment in temporary help services
was up by 17,000. This industry has added 392,000 jobs since a recent employment
low in September 2009.

Construction employment was up (+19,000) in August. This change partially re-
flected the return to payrolls of 10,000 workers who were on strike in July.

Employment in retail trade was about unchanged over the month. A job gain among
motor vehicle and parts dealers (+8,000) was essentially offset by losses in
building materials and garden supply stores (-6,000).

Employment in other private-sector industries, including wholesale trade, trans-
portation and warehousing, information, financial activities, and leisure and
hospitality, showed little change in August.

Over the month, government employment fell by 121,000, largely reflecting the
loss of 114,000 temporary workers hired for Census 2010. The number of tempor-
ary Census 2010 workers peaked in May at 564,000 but has declined to 82,000 in
August.

The average workweek for all employees on private nonfarm payrolls was unchanged
over the month at 34.2 hours. The manufacturing workweek for all employees in-
creased by 0.1 hour to 40.2 hours, and factory overtime was up by 0.1 hour. The
average workweek for production and nonsupervisory employees on private nonfarm
payrolls increased by 0.1 hour to 33.5 hours. (See tables B-2 and B-7.)

Average hourly earnings of all employees on private nonfarm payrolls increased
by 6 cents, or 0.3 percent, to $22.66 in August. Over the past 12 months, aver-
age hourly earnings have increased by 1.7 percent. In August, average hourly
earnings of private-sector production and nonsupervisory employees increased by
3 cents, or 0.2 percent, to $19.08. (See tables B-3 and B-8.)

The change in total nonfarm payroll employment for June was revised from -221,000
to -175,000, and the change for July was revised from -131,000 to -54,000.

___________
The Employment Situation for September is scheduled to be released on Friday,
October 8, 2010, at 8:30 a.m. (EDT).

The US Unemployment Rate - 1948 to 2009
http://www.miseryindex.us/urbyyear.asp
The US Unemployment Rate – 1948 to 2009
http://www.miseryindex.us/urbyyear.asp
The Depression You’ve Never Heard Of: 1920-1921
by Robert P. Murphy
“…The 1920–1921 Depression
This context highlights the importance of the 1920–1921 depression. Here the government and Fed did the exact opposite of what the experts now recommend. We have just about the closest thing to a controlled experiment in macroeconomics that one could desire. To repeat, it’s not that the government boosted the budget at a slower rate, or that the Fed provided a tad less liquidity. On the contrary, the government slashed its budget tremendously, and the Fed hiked rates to record highs. We thus have a fairly clear-cut experiment to test the efficacy of the Keynesian and monetarist remedies.
At the conclusion of World War I, U.S. officials found themselves in a bleak position. The federal debt had exploded because of wartime expenditures, and annual consumer price inflation rates had jumped well above 20 percent by the end of the war.
To restore fiscal and price sanity, the authorities implemented what today strikes us as incredibly “merciless” policies. From FY 1919 to 1920, federal spending was slashed from $18.5 billion to $6.4 billion—a 65 percent reduction in one year. The budget was pushed down the next two years as well, to $3.3 billion in FY 1922.
On the monetary side, the New York Fed raised its discount rate to a record high 7 percent by June 1920. Now the reader might think that this nominal rate was actually “looser” than the 1.5 percent discount rate charged in 1931 because of the changes in inflation rates. But on the contrary, the price deflation of the 1920–1921 depression was more severe. From its peak in June 1920 the Consumer Price Index fell 15.8 percent over the next 12 months. In contrast, year-over-year price deflation never even reached 11 percent at any point during the Great Depression. Whether we look at nominal interest rates or “real” (inflation-adjusted) interest rates, the Fed was very “tight” during the 1920–1921 depression and very “loose” during the onset of the Great Depression.
Now some modern economists will point out that our story leaves out an important element. Even though the Fed slashed its discount rate to record lows during the onset of the Great Depression, the total stock of money held by the public collapsed by roughly a third from 1929 to 1933. This is why Milton Friedman blamed the Fed for not doing enough to avert the Great Depression. By flooding the banking system with newly created reserves (part of the “monetary base”), the Fed could have offset the massive cash withdrawals of the panicked public and kept the overall money stock constant.
But even this nuanced argument fails to demonstrate why the 1929–1933 downturn should have been more severe than the 1920–1921 depression. The collapse in the monetary base (directly controlled by the Fed) during 1920–1921 was the largest in U.S. history, and it dwarfed the fall during the early Hoover years. So we hit the same problem: The standard monetarist explanation for the Great Depression applies all the more so to the 1920–1921 depression.
The Results
If the Keynesians are right about the Great Depression, then the depression of 1920–1921 should have been far worse. The same holds for the monetarists; things should have been awful in the 1920s if their theory of the 1930s is correct.
To be sure, the 1920–1921 depression was painful. The unemployment rate peaked at 11.7 percent in 1921. But it had dropped to 6.7 percent by the following year, and was down to 2.4 percent by 1923. After the depression the United States proceeded to enjoy the “Roaring Twenties,” arguably the most prosperous decade in the country’s history. Some of this prosperity was illusory—itself the result of subsequent Fed inflation—but nonetheless the 1920–1921 depression “purged the rottenness out of the system” and provided a solid framework for sustainable growth.
As we know, things turned out decidedly differently in the 1930s. Despite the easy fiscal and monetary policies of the Hoover administration and the Federal Reserve—which today’s experts say are necessary to avoid the “mistakes of the Great Depression”—the unemployment rate kept going higher and higher, averaging an astounding 25 percent in 1933. And of course, after the “great contraction” the U.S. proceeded to stagnate in the Great Depression of the 1930s, which was easily the least prosperous decade in the country’s history.
The conclusion seems obvious to anyone whose mind is not firmly locked into the Keynesian or monetarist framework: The free market works. Even in the face of massive shocks requiring large structural adjustments, the best thing the government can do is cut its own budget and return more resources to the private sector. For its part, the Federal Reserve doesn’t help matters by flooding the shell-shocked credit markets with green pieces of paper. Prices can adjust to clear labor and other markets soon enough, in light of the new fundamentals, if only the politicians and central bankers would get out of the way. …”
http://www.thefreemanonline.org/featured/the-depression-youve-never-heard-of-1920-1921/#
Aggregate Demand Video Tutorial
IS Video Tutorial
LM Video Tutorial
ISLM Video Tutorial
Read Full Post | Make a Comment ( None so far )
Ann Coulter, “Never Discount Repulicans’ Ability to Blow An Election”–Videos
2010 Midterm Elections – Ann Coulter and Sean Hannity
Read Full Post | Make a Comment ( None so far )

You must be logged in to post a comment.