Story 1: American People’s Crisis of Confidence in Big Government And Out of Control Spending and Taxes — Abandoning Both Political Parties — The Coming Of A Third Independent Party — Toppling Two Party Tyranny — The Wealth Creators Will Lead The American Renaissance — Videos
Free Market Revolution -The Solution to what Ails America Today
The mission of the Financial Policy Council Inc. (FPC), a research think tank and educational institution, is to formulate and promote sound public policy based on the principles of free enterprise and wealth creation as envisioned by the ideals of the American Founding Fathers.
Our goal is to ensure that America, the land of opportunity where freedom and prosperity have flourished, is not derailed by poorly formulated and reactive economic, fiscal and tax policy. In addition, our goal is to retain and reclaim America’s leading role in the global economic community.
Dr. Yaron Brook | Why Be Selfish? | Full Length HD
G. Edward Griffin – The Collectivist Conspiracy
Confidence In Institutions – GBTV
Matt Welch Tackles Two Party Tyranny on Stossel
TAKE IT TO THE LIMITS: Milton Friedman on Libertarianism
WASHINGTON, D.C. — Gallup’s U.S. Economic Confidence Index registered at -9 for the week ending June 7, the sixth straight week the index has been at or below -5.
After climbing steadily during the fall of last year and registering positive scores from late December through mid-February, the U.S. Economic Confidence Index slipped to between -3 and -4 for most of March and April in Gallup’s weekly averages. The index dipped more at the start of May, reaching -9, and has remained near that level since.
Still, on a relative basis the recent weekly index readings are much higher than Gallup found for most weeks between January 2008 and November 2014, when the index ranged from -65 to -3.
Gallup’s Economic Confidence Index is the average of two components: Americans’ views of current economic conditions and their perceptions of whether the U.S. economy is getting better or getting worse. The theoretical maximum for the index is +100, if all Americans say the economy is excellent or good and getting better. The theoretical minimum is -100, if all Americans say the economy is poor and getting worse.
For the week ending June 7, 24% of Americans said the economy is excellent or good while 30% said it is poor, resulting in a current conditions score of -6. The economic outlook score of -12, the lowest score for this component since early May, is the result of 42% of Americans saying the economy is getting better and 54% saying it is getting worse.
Bottom Line
Americans’ outlook has improved on a variety of economic measures, but their overall confidence in the U.S. economy is registering significantly lower values in the past several weeks than it did from late December to late April.
The recent erosion in confidence may be related to rising gas prices since the beginning of the year. The direction of gas prices in the months ahead could help predict the trajectory of economic confidence, as could other economic information consumers are likely to pick up on, including the monthly government jobs report — which for May was stronger than some analysts expected.
Results for this Gallup poll are based on telephone interviews conducted June 1-7, 2015, on the Gallup U.S. Daily survey, with a random sample of 3,035 adults, aged 18 and older, living in all 50 U.S. states and the District of Columbia. For results based on the total sample of national adults, the margin of sampling error is ±2 percentage points at the 95% confidence level. All reported margins of sampling error include computed design effects for weighting.
Each sample of national adults includes a minimum quota of 50% cellphone respondents and 50% landline respondents, with additional minimum quotas by time zone within region. Landline and cellular telephone numbers are selected using random-digit-dial methods.
Confidence in U.S. Institutions Still Below Historical Norms
by Jeffrey M. Jones
Story Highlights
Only military, small business top historical averages
Military, small business highest-rated institutions overall
Confidence in organized religion, police at all-time lows
PRINCETON, N.J. — Americans’ confidence in most major U.S. institutions remains below the historical average for each one. Only the military (72%) and small business (67%) — the highest-rated institutions in this year’s poll — are currently rated higher than their historical norms, based on the percentage expressing “a great deal” or “quite a lot” of confidence in the institution.
These results are based on a June 2-7 Gallup poll that included Gallup’s latest update on confidence in U.S. institutions. Gallup first measured confidence ratings in 1973 and has updated them each year since 1993.
Americans’ confidence in most major institutions has been down for many years as the nation has dealt with prolonged wars in Iraq and Afghanistan, a major recession and sluggish economic improvement, and partisan gridlock in Washington. In fact, 2004 was the last year most institutions were at or above their historical average levels of confidence. Perhaps not coincidentally, 2004 was also the last year Americans’ satisfaction with the way things are going in the United States averaged better than 40%. Currently, 28% of Americans are satisfied with the state of the nation.
From a broad perspective, Americans’ confidence in all institutions over the last two years has been the lowest since Gallup began systematic updates of a larger set of institutions in 1993. The average confidence rating of the 14 institutions asked about annually since 1993 — excluding small business, asked annually since 2007 — is 32% this year. This is one percentage point above the all-institution average of 31% last year. Americans were generally more confident in all institutions in the late 1990s and early 2000s as the country enjoyed a strong economy and a rally in support for U.S. institutions after the 9/11 terrorist attacks.
Confidence in Political, Financial and Religious Institutions Especially Low
Today’s confidence ratings of Congress, organized religion, banks, the Supreme Court and the presidency show the greatest deficits compared with their historical averages, all running at least 10 points below that mark. Americans’frustration with the government’s performance has eroded the trust they have in all U.S. political institutions. Likewise, Americans’ confidence in banks fell after the bursting of the housing bubble and the subsequent financial crisis.
The large decline in confidence in organized religion is likely tied to a decline in religiosity overall, but also to scandals that have plagued various religious organizations, most notably the Catholic Church. This year’s 42% score for confidence in the church or organized religion is the lowest Gallup has measured for that institution. The prior low was 44% in 2012.
Confidence in the police, at 52% this year, ties the low for that institution recorded in the first year it was measured, 1993. In the past year, the police have been a major focus of news coverage in several incidents in which white police officers’ actions resulted in the deaths of black men they were trying to apprehend.
Still, the church and the police rank among the highest-rated institutions, trailing only the military and small business among the 15 institutions tested in this year’s poll. Further back in history, the church ranked first or tied for first in all but one survey from 1973 through 1988. Since then, the military has been the top-ranked institution each year except 1997, when small business was first.
Congress is the institution in which Americans express the least confidence this year, with 8% doing so, one point above its 7% rating last year — the lowest Gallup has ever measured for any institution. Congress has ranked last each year since 2010, and a total of 12 times since 1973. Other institutions that have held this unwelcome distinction in the past include big business (nine times), health maintenance organizations (eight), the criminal justice system (six) and organized labor (four). The top- and bottom-rated institutions in each Confidence in Institutions poll are shown at the bottom of this story.
Implications
Americans continue to show lower levels of confidence in most of the major institutions central to U.S. society, with only the military and small business getting ratings in 2015 that are above their historical averages. That speaks to the broader dissatisfaction Americans have with the state of the nation more generally over the past decade as the U.S. has faced serious economic, international and political challenges. Americans have tended to be more confident in U.S. institutions when the economy has been strong, such as in the mid-1980s and the late 1990s and early 2000s. Although Americans are now more upbeat about the economy than they were in 2008-2013, they are not yet convinced that the economy is good, given that their assessments of national economic conditions remain more negative than positive.
Survey Methods
Results for this Gallup poll are based on telephone interviews conducted June 2-7, 2015, with a random sample of 1,527 adults, aged 18 and older, living in all 50 U.S. states and the District of Columbia. For results based on the total sample of national adults, the margin of sampling error is ±3 percentage points at the 95% confidence level. All reported margins of sampling error include computed design effects for weighting.
Each sample of national adults includes a minimum quota of 50% cellphone respondents and 50% landline respondents, with additional minimum quotas by time zone within region. Landline and cellular telephone numbers are selected using random-digit-dial methods.
Confidence in U.S. Branches of Government Remains Low
by Justin McCarthy
Story Highlights
Americans’ confidence in presidency up four points, at 33%
Thirty-two percent have confidence in the Supreme Court
Congress retains the least confidence, at 8%
WASHINGTON, D.C. — Americans’ confidence in each of the three branches of the U.S. government remains low, with confidence in Congress and the Supreme Court near their all-time lows reached last year. Currently, 33% of Americans have “a great deal” or “quite a lot” of confidence in the presidency, 32% are this confident in the Supreme Court, and Congress is still well behind, at 8%.
While Congress has consistently received the lowest confidence rating of the three branches of government, the Supreme Court and the presidency usually track each other closely. This is apart from times when the incumbent president has been extremely popular, as in 1991 and 2002, or exceptionally unpopular, as in 2007 and 2008.
Gallup’s June 2-7 poll found confidence in the presidency rising slightly to 33% from 29% last year, which in turn was just four percentage points above the historical low of 25% in 2007. The uptick in confidence in the presidency this year is consistent with Americans’ higher job approval ratings of President Barack Obama since last fall.
Meanwhile, ratings of the Supreme Court and Congress, which had dropped to record lows in 2014, have barely moved.
Confidence in the Presidency in Obama’s Seventh Year Exceeds Bush’s
The president in office is not mentioned by name in the confidence in the presidency question, but Americans’ evaluations of the sitting president at the time are strongly related to how much confidence Americans place in the presidency as an institution.
Confidence in the presidency as an institution during each year of Obama’s presidency has generally been lower than the comparable year in the presidencies of Bill Clinton and George W. Bush. An exception is Obama’s first year, when Americans had greater confidence in the institution than in the first years of either Bush or Clinton. Also, in Obama’s current year in office, his seventh, confidence in the presidency is higher than the 25% found in Bush’s seventh year — the record low — but lower than the 49% in Clinton’s seventh year.
The highest confidence rating the presidency has ever received is 72%, in March 1991 during the administration of George H.W. Bush shortly after he had succeeded in pushing Iraq out of Kuwait in the Gulf War. However, by October of that same year, after the Gulf War was over, confidence in the presidency had dropped to 50%.
Average Confidence in the Three Branches Is Low, but Has Been Lower
The average confidence rating for the three branches of government combined is 24%, lower than most previous averages since 1991 and well below the high of 50% that year.
But the average of confidence ratings for the three branches of government has been lower — including in 2008 (23%) and 2014 (22%).
Bottom Line
Americans’ confidence in two of the three institutions that make up the U.S. government — Congress and the Supreme Court — remains near their all-time lows reached in 2014, while confidence in the presidency, although low, is up marginally compared with last year.
For Congress, low confidence in the institution is nothing new to members of the Senate and the House of Representatives, who have also seen low job approval ratings in recent years. Individual members likely aren’t as interested in Americans’ collective opinions as they are in the views of the voters they must appeal to back home. But the public’s extremely low confidence no doubt weighs on Congress at some level.
The Supreme Court, meanwhile, is not directly accountable to the public — and often defies public opinion completely. Although its unelected members serve indefinite terms, confidence in the court is not unsusceptible to a drop in confidence in government as a whole.
Survey Methods
Results for this Gallup poll are based on telephone interviews conducted June 2-7, 2015, with a random sample of 1,527 adults, aged 18 and older, living in all 50 U.S. states and the District of Columbia. For results based on the total sample of national adults, the margin of sampling error is ±3 percentage points at the 95% confidence level. All reported margins of sampling error include computed design effects for weighting.
Each sample of national adults includes a minimum quota of 50% cellphone respondents and 50% landline respondents, with additional minimum quotas by time zone within region. Landline and cellular telephone numbers are selected using random-digit-dial methods.
Americans have little confidence in most of their major institutions including Congress, the presidency, the Supreme Court, banks and organized religion, according to the latest Gallup poll.
“Americans’ confidence in most major U.S. institutions remains below the historical average for each one,” a Gallup spokesman said in a news release. Only the military, in which 72 percent of Americans express confidence, up from a historical average of 68 percent, and small business, with 67 percent confidence, up from 63, are currently rated higher than their historical norms. This is based on the percentage expressing “a great deal” or “quite a lot” of confidence in these institutions, the Gallup spokesman said.
Only 8 percent have confidence in Congress, down by 16 points from a long-term average of 24 percent – the lowest of all institutions rated. The rating is about the same as last year’s 7 percent, the lowest Gallup has ever measured for any institution.
Thirty-three percent have confidence in the presidency, a drop from a historical average of 43 percent.
Thirty-two percent have confidence in the Supreme Court, down from 44.
All in all, it’s a picture of a nation discouraged about its present and worried about its future, and highly doubtful that its institutions can pull America out of its trough. In a political context, the findings indicate that the growing number of presidential candidates for 2016 will have a difficult time instilling confidence in a skeptical electorate that they have the answers to the country’s problems.
“Americans’ confidence in most major institutions has been down for many years as the nation has dealt with prolonged wars in Iraq and Afghanistan, a major recession and sluggish economic improvement, and partisan gridlock in Washington,” the Gallup spokesman said. “In fact, 2004 was the last year most institutions were at or above their historical average levels of confidence. Perhaps not coincidentally, 2004 was also the last year Americans’ satisfaction with the way things are going in the United States averaged better than 40 percent. Currently, 28 percent of Americans are satisfied with the state of the nation.”
The Gallup spokesman added: “From a broad perspective, Americans’ confidence in all institutions over the last two years has been the lowest since Gallup began systematic updates of a larger set of institutions in 1993.”
Twenty-eight percent have confidence in banks, down from 40 percent.
Twenty-one percent have confidence in big business, down from 24 percent.
Twenty-four percent have confidence in organized labor, down from 26.
Twenty-four percent have confidence in newspapers, down from 32 percent. Twenty-one percent have confidence in television news, down from 30 percent.
The police also have experienced a drop in public esteem, with 52 percent of Americans saying they are confident in the police compared with 57 percent who have been confident in the police historically. Police have been widely criticized in recent months for abusive tactics toward African-Americans, which resulted in the deaths of several black men.
Forty-two percent express confidence in organized religion, down from 55.
“Americans continue to show lower levels of confidence in most of the major institutions central to U.S. society, with only the military and small business getting ratings in 2015 that are above their historical averages,” the Gallup spokesman said. “That speaks to the broader dissatisfaction Americans have with the state of the nation more generally over the past decade as the U.S. has faced serious economic, international and political challenges. Americans have tended to be more confident in U.S. institutions when the economy has been strong, such as in the mid-1980s and the late 1990s and early 2000s. Although Americans are now more upbeat about the economy than they were in 2008-2013, they are not yet convinced that the economy is good, given that their assessments of national economic conditions remain more negative than positive.”
AMERICANS LOSE CONFIDENCE IN EVERYTHING
Poll shows views turning negative on banks, government, religion, police, media
An explosive new Gallup poll shows Americans have lost confidence in almost every major institution – from the U.S. presidency, Congress and the Supreme Court to banks and organized religion.
“Americans’ confidence in most major U.S. institutions remains below the historical average for each one,” a Gallup spokesman said.
Only the military (72 percent) and small business (67 percent) have Americans’ increasing confidence, both of which are now rated 4 percentage points higher than their historical norms, according to the poll.
Congress – which plunged 16 points from its average of 24 points – is the lowest ranking institution at just 8 percent.
Just as numerous presidential candidates attempt to convince America that they have the answers to the nation’s problems, the poll shows only one-third, or 33 percent, of Americans have confidence in the presidency, a nosedive from the historical average of 43 percent.
Likewise, just 32 percent said they have confidence in the Supreme Court, which is down from an average of 44 just before the court announces its decisions on landmark issues such as same-sex marriage and Obamacare subsidies to states without insurance-exchange websites.
“Americans’ confidence in most major institutions has been down for many years as the nation has dealt with prolonged wars in Iraq and Afghanistan, a major recession and sluggish economic improvement, and partisan gridlock in Washington,” a Gallup spokesman said. “In fact, 2004 was the last year most institutions were at or above their historical average levels of confidence. Perhaps not coincidentally, 2004 was also the last year Americans’ satisfaction with the way things are going in the United States averaged better than 40 percent. Currently, 28 percent of Americans are satisfied with the state of the nation.”
In 2004, President George W. Bush was re-elected and the U.S. transferred sovereignty and control of Iraq back to the Iraqi people.
At the beginning of 2004, the U.S. economy was booming. Four middle-class tax cuts were extended, including a $1,000-per-couple child tax credit, expansion of the lowest (10 percent) tax bracket, exceptions for the alternative minimum tax, and relief from the “marriage penalty” for two-income families. Another $140 billion in tax relief was granted to U.S. business. Unemployment dropped from 5.7 percent to 5.4 percent.
Regarding the latest poll numbers, the Gallup spokesman added, “From a broad perspective, Americans’ confidence in all institutions over the last two years has been the lowest since Gallup began systematic updates of a larger set of institutions in 1993.”
In the last two years, Americans have seen President Obama begin his second term of office. Amid an explosion of legalized same-sex marriage in numerous U.S. states, the Supreme Court declared the Defense of Marriage Act unconstitutional.
Americans witnessed the debt-ceiling crisis in October 2013, which resulted in the shutdown of the federal government and furlough of federal workers.
By 2014, the Obama administration had announced its plan to shrink the military budget to $522 billion and slash the Army to a size unseen since before World War II. The nation also saw Americans impacted by a West African Ebola outbreak and revelations that the Veterans Administration had covered up exceedingly long wait times for veterans seeking medical attention.
The year 2014 also saw the rise of terrorist group ISIS and racial riots in Ferguson, Missouri, and St. Louis after the fatal police shooting of Michael Brown in August. By 2015, riots had broken out in Baltimore, Maryland, over the shooting of Freddie Gray.
According to the Gallup poll, 28 percent of Americans now have confidence in banks, compared to the historical average of 40 percent.
Twenty-one percent said they have confidence in big business, down from 24 percent.
Twenty-four percent have confidence in organized labor, down from 26 percent.
Twenty-four percent have confidence in newspapers, down from 32 percent.
Twenty-one percent have confidence in TV news, down from 30 percent.
Fifty-two percent have confidence in police, down from 57 percent.
Forty-two percent have confidence in organized religion, down from 55.
“Americans continue to show lower levels of confidence in most of the major institutions central to U.S. society, with only the military and small business getting ratings in 2015 that are above their historical averages,” the Gallup spokesman said.
“That speaks to the broader dissatisfaction Americans have with the state of the nation more generally over the past decade as the U.S. has faced serious economic, international and political challenges. Americans have tended to be more confident in U.S. institutions when the economy has been strong, such as in the mid-1980s and the late 1990s and early 2000s.”
While Americans are more confident in the economy than they were from 2008 to 2013, the Gallup spokesman said, “[T]hey are not yet convinced that the economy is good, given that their assessments of national economic conditions remain more negative than positive.”
The Vice President of the United States has the additional duty of President of the Senate. Because the number of seats in the United States Senate is an even number (two senators per state), it is the Vice President’s duty as President of the Senate to cast a tie-breaking vote in the event that “they be equally divided”—an equal number of Senators voting both for and against a motion.
A party that has “an independent state organization… in a majority of the states”[1] is listed as a major party. An “independent state organization” is not to be confused with the organization of an Independent Democrat or Independent Republican.
These parties are based only in states or certain regions and rarely, if ever, offer candidates for national offices. These are all parties that are unaffiliated with national parties. Each state has official state chapters of the major parties as well as some of the minor parties.
These organizations do not nominate candidates for election but otherwise function similarly to political parties. Some of them have nominated candidates in the past.
Since its inception in 1995, the Index of Economic Freedom has chronicled hundreds of examples of government policy changes that have enhanced economic freedom, thereby promoting human progress and greater prosperity. As the Index has catalogued, nations with higher degrees of economic freedom prosper because they capitalize more fully on the ability of the free-market system not only to generate, but also to reinforce dynamic growth through efficient resource allocation, value creation, and innovation. Policies that promote freedom, whether through improvements in the rule of law, the promotion of competition and openness, or suitable restraints on the size and economic reach of government, turn out in practice to offer and advance practical solutions to a wide range of economic and social challenges that face the world’s societies.
The findings of the 2015 Index once again demonstrate the strongly positive linkages between economic freedom and various dimensions of human development. Many of the linkages are straightforward: Higher taxes, for example, reduce investment and hurt job growth. Others, such as the impact on economic growth from the promotion of property rights or the maintenance of a stable monetary system, are more intricate, multidimensional, and nonlinear.
Even in these cases, however, the evidence is strong that adherence to the principles of economic freedom is an unmatched strategy for promoting solutions to human problems and advancing overall well-being. No alternative systems—and many have been tried—come close to the record of free-market capitalism in promoting growth and improving the human condition.
Economic Freedom: Advancing Opportunity
Today’s successful economies are not necessarily geographically large or richly blessed with natural resources. Many economies have managed to expand opportunities for their citizens by enhancing their economic dynamism. In general, the overarching objective of economic policies must be to create an environment that provides the most opportunity for the widest range of activities that can lead to increased prosperity.
The Index results have shown that sustaining such economic dynamism is achievable only when governments adopt economic policies that empower individuals and firms with more choices, encouraging greater entrepreneurship.
It is noteworthy that despite recent policy missteps by many countries in responding to the global economic slowdown, which amounted to a political assault on capitalism in some places, the free-market system is not on the verge of breakdown. In fact, as the negative impact of regulatory and spending mistakes has become apparent, a greater number of people around the world seem to be realizing that the economic damage inflicted by the heavy hand of government—subpar growth, deteriorating entrepreneurial environments, and lower employment growth—is not inevitable, but rather the result of bad policy choices.
Even as the free market has been under challenge in countries such as Venezuela, Bolivia, Russia, and even the United States, many other governments around the world have acknowledged its superiority. Decades of evidence, some presented in the pages of this Index, are hard for even the most ideological governments to ignore. Not only does the free-market system remain viable, but many of its core features, such as private property rights, openness to trade and investment, and fiscal discipline, have entrenched themselves as the policy standard, any deviation from which requires strong justification.
Economic Freedom: Promoting Prosperity
In many respects, economic freedom is merely shorthand for an openness to entrepreneurial activity that increases opportunity for individuals to succeed in their endeavors. Chart 1 shows the close correspondence between economic freedom and entrepreneurial opportunity as measured by the Entrepreneurship and Opportunity sub-index of the Legatum Prosperity Index, which “measures a country’s entrepreneurial environment, its promotion of innovative activity, and the evenness ofopportunity.”
Given such a strong relationship, it should be apparent that a government’s most effective stimulus activity will not be to increase its own spending or increase layers of regulation, both of which reduce economic freedom. The best results are likely to be achieved instead through policy reforms that improve the incentives that drive entrepreneurial activity, creating more opportunities for greater economicdynamism.
Equally notable are the fundamental benefits that stem from the strong positive relationship between economic freedom and levels of per capita income. For countries achieving scores in the Index that reflect even moderate levels of economic freedom (60 or above), the relationship between economic freedom and per capita GDP is highly significant.
As indicated in Chart 2, countries moving up the economic freedom scale show increasingly high levels of average income. Economies rated “free” or “mostly free” in the 2015 Index enjoy incomes that are over twice the average levels in all other countries and more than five times higher than the incomes of “repressed” economies.
Economic Freedom: Antidote to Poverty
By a great many measures, the past two decades during which the Index has been charting the advance of economic freedom have been the most prosperous in the history of humankind. Those countries that have adopted some version of free-market capitalism, with economies supported by efficient regulations and open to the free flow of goods, services, and capital, have participated in an era of globalization and economic integration in which solutions to many of the world’s development problems have taken hold and generated real improvements in living standards.
The free-market system that is rooted in the principles of economic freedom has fueled unprecedented economic growth around the world. As Chart 3 illustrates, as the global economy has moved toward greater economic freedom over the past two decades, real world GDP has increased by about 70 percent, and the global poverty rate has been cut in half, lifting hundreds of millions of people out of poverty.
Greater economic freedom has had a positive impact not just on the number of people in poverty, but also on the intensity of the poverty still experienced by some. Poverty intensity as measured by the United Nations Development Programme’s Multidimensional Poverty Index, which assesses the nature and intensity of deprivation at the individual level in education, health outcomes, and standard of living, is much lower on average in countries with higher levels of economic freedom. Chart 5 shows that the intensity of poverty in countries whose economies are considered mostly free or moderately free is only about one-fourth the level in countries that are rated less free.
The key driver of poverty reduction is dynamic and resilient economic growth that creates jobs. Not surprisingly, one of the most important goals of economic policy in almost every country in the world has thus been to increase the rate of economic growth.
As Chart 4 demonstrates, there is a robust relationship between improving economic freedom and achieving higher per capita economic growth. Whether long-term (20 years), medium-term (10 years), or short-term (five years), the relationship between changes in economic freedom and changes in economic growth is consistently positive.
Undeniably, countries moving toward greater economic freedom tend to achieve higher rates of per capita GDP growth over time. Whether in the short term or over the long run, the average annual per capita economic growth rates of countries that have grown economic freedom the most are at least 50 percent higher than those of countries where freedom has stagnated or slowed.
Economic Freedom: Societal Development and Democratic Progress
Growing economic freedom is unequivocally about more than financial success. Achieving greater overall prosperity that goes beyond materialistic and monetary dimensions of well-being is equally important. The societal benefits of economic freedom extend far beyond higher incomes or reductions in poverty. Countries with higher levels of economic freedom enjoy higher levels of overall human development as measured by the United Nations Human Development Index, which measures life expectancy, literacy, education, and the standard of living in countries worldwide. As Chart 6 shows, governments that choose policies that increase economic freedom are placing their societies on the pathway to more education opportunities, better health care, and higher standards of living for their citizens.
In some countries, government policies and actions concerning the environment have become more intrusive and economically distortionary. Many governments have pushed programs to tax carbon emissions and increase taxes on gasoline, organized non-transparent and sometimes corrupt exchanges for the buying and selling of carbon emissions, and provided subsidies for “clean” energy to politically favored firms. Such policies impose a huge direct cost on society, and they also retard economic growth—and all for uncertain environmental benefits.
Interestingly, the same free-market principles that have proven to be the key to economic success have also proven to deliver environmental success. Around the world, economic freedom has been shown to increase countries’ capacity for innovation and thus to improve overall environmental performance.
The positive link between economic freedom and higher levels of innovation ensures greater economic dynamism in coping with various developmental challenges, and the most remarkable improvements in clean energy use and energy efficiency over the past decades have occurred not as a result of government regulation, but rather because of advances in technology and trade. A virtuous cycle of investment, innovation (including in greener technologies), and dynamic economic growth has flourished where governments have trusted market forces and competition to spur efficiency. (See Chart 7.)
Greater economic freedom can also provide more fertile ground for effective and democratic governance. Debate over the direction of causality between economic freedom and democracy has become more controversial in recent years because of the multifaceted interaction between the two. Undoubtedly, achieving greater political freedom through well-functioning democracy is a messy and often excruciatingprocess.
However, the positive relationship between economic freedom and democratic governance is undeniable. (See Chart 8.) By empowering people to exercise greater control of their daily lives, economic freedom ultimately nurtures political reform by making it possible for individuals to gain the economic resources necessary to challenge entrenched interests and compete for political power, thereby encouraging the creation of more pluralistic societies.
Pursuit of greater economic freedom is thus an important stepping-stone to democracy. It empowers the poor and builds the middle class. It is a philosophy that encourages entrepreneurship and disperses economic power and decision-making throughout society.
Economic Freedom: The Key to Upward Mobility and Greater Social Progress
The massive improvements in global indicators of income and quality of life largely reflect a paradigm shift in the debate over how societies should be structured to achieve the most optimal outcome. Over the past two decades, this debate has largely been won by capitalism. However, fears that the immediate benefits of capitalism are fading has brought to the forefront concerns about economic mobility and economicfreedom.
At the heart of ensuring upward economic mobility is the task of advancing economic freedom so that dynamic and inclusive growth can meaningfully occur for ordinary people in a free society. Milton and Rose Friedman made a keen observation on the critically intertwined relationship between freedom andmobility:
[S]o long as freedom is maintained, it prevents … positions of privilege from becoming institutionalized. Freedom means diversity, but also mobility. It preserves the opportunity for today’s disadvantaged to become tomorrow’s privileged and, in the process enables almost everyone, from top to bottom, to enjoy a fuller and richer life.1
Economic freedom is critical to generating the broader-based economic growth that brings more opportunities for a greater number of people to work, produce, and save. In other words, ensuring greater economic freedom is directly related to preserving and enhancing dynamic upward mobility.
Also notable is that although some naysayers claim that economic and social progress has been limited in recent years as incomes in some countries have become more unequal as a result of economic freedom, the evidence does not support this contention. Instead, societies based on economic freedom are the ones that have demonstrated the strongest social progress.
As shown in Chart 9, countries that largely embrace economic freedom provide the environments that are most conducive to social progress.2 Countries that improve their competitiveness and open their societies to new ideas, products, and innovations have largely achieved the high levels of social progress that their citizens demand. It is not massive redistributions of wealth or government dictates on income levels that produce the most positive social outcomes. Instead, mobility and progress require lower barriers to entry, freedom to engage with the world, and less government intrusion.
Staying on Course
The 21st edition of the Index of Economic Freedom shows economic freedom once again on the rise, reaching the highest point in the Index’s 21-year history. Behind this record are stories of human progress and the achievements of countries and their citizens—literally billions of people around the world whose lives have measurably improved.
It is no coincidence that the increase of economic liberty over the past decades has coincided with a massive reduction in worldwide poverty, disease, and hunger. The link between economic freedom and development is clear and strong. People in economically free societies live longer. They have better health. They are able to be better stewards of the environment, and they push forward the frontiers of human achievement in science and technology through greater innovation.
A recurring theme of human history has been resilience and revival. The country profiles in the 2015 Index of Economic Freedom include many examples of countries that have accelerated their economic and social progress in the face of difficult challenges and a sometimes harsh international environment. Their successes can be emulated by others. The Index of Economic Freedom charts not just one path to development, but as many as the ingenuity of humans can produce when they are free to experiment andinnovate.
The principles of economic freedom are a sure guide, but only a guide. What truly will matter are the creative solutions to pressing world problems that are certain to flow from people who are, in the words of Milton and Rose Friedman, “free to choose.”
1. Milton Friedman and Rose D. Friedman, Free to Choose: A Personal Statement (New York: Harcourt Brace Jovanovich, 1979).
2. The Social Progress Index defines social progress as the capacity of a society to meet the basic human needs of its citizens, establish the building blocks that allow citizens and communities to enhance and sustain the quality of their lives, and create the conditions for all individuals to reach their full potential.
The United States’ economic freedom score is 76.2, making its economy the 12th freest in the 2015 Index. Its score is 0.7 point higher than last year, with modest gains in six of the 10 economic freedoms, including control of government spending, outweighing a slight decline in business freedom.
Although the precipitous downward spiral in U.S. economic freedom since 2008 has come to a halt in the 2015 Index, a 1.6-point decline in overall economic freedom over the past five years reflects broad-based deteriorations in key policy areas, particularly those related to upholding the rule of law and limited government. Continuing to trail such comparable economies as Australia, New Zealand, Switzerland, and Canada, America has been ranked “mostly free” since 2010.
The anemic post-recession recovery has been characterized by slow growth, high unemployment, a decrease in the number of Americans seeking work, and great uncertainty that has held back investment. Increased tax and regulatory burdens, aggravated by favoritism toward entrenched interests, have undercut America’s historically dynamic entrepreneurial growth.
BACKGROUND
President Barack Obama’s second-term efforts to expand government spending and regulation have been thwarted to some extent by Republican Party opposition in Congress. Economic policy leadership has devolved by default to the Federal Reserve, whose attempts to use monetary policy to stimulate economic activity have not restored robust growth. Implementation of the 2010 health care law, which has reduced competition in most health insurance markets, remains a drag on job creation and full-time employment. Overall, the U.S. economy continues to underperform, despite a private sector–led energy boom that has made the U.S. the world’s largest producer of oil and natural gas. The weak economic recovery and uncertain responses to foreign policy challenges, particularly in the Middle East, in Ukraine, and along the southern U.S. border, have contributed to a loss of support for the President and his party and Republican majorities in both chambers of Congress as a result of 2014 midterm elections.
Corruption in government and the political process remains a concern. High levels of government spending and the expansion and complexity of the government’s regulatory agenda have increased opportunities for political favoritism and cronyism. The judiciary functions independently. Protection of property rights has been uneven, with instances of regulatory overreach by the executive branch requiring court adjudication.
The top individual income tax rate is 39.6 percent, and the top corporate tax rate remains among the world’s highest at 35 percent. Other taxes include a capital gains tax and excise taxes. Tax revenue is equal to 24.3 percent of gross domestic product, and government spending is well over one-third of GDP. Public debt exceeds the value of the economy’s annual production.
The regulatory burden has been mounting. Since 2009, over 150 new major regulations have been imposed at an annual cost of more than $70 billion. As of 2014, 125 new regulations were in the pipeline. The labor market, primarily regulated at the state level, remains flexible. Subsidies for agriculture, health care, and renewable energy have bred economic distortions.
The average tariff rate is 1.5 percent. Tariffs on clothing are high, sugar imports face tariff-rate quotas, and petroleum and liquefied natural gas exports are restricted. Foreign investment in some sectors is capped. The financial market is well developed, but the 2010 Dodd–Frank Act has instituted more federal regulation, socializing the cost of financial risk-taking and increasing the likelihood of future financial crises and bailouts
WH adviser slams Drudge Report for impact on media
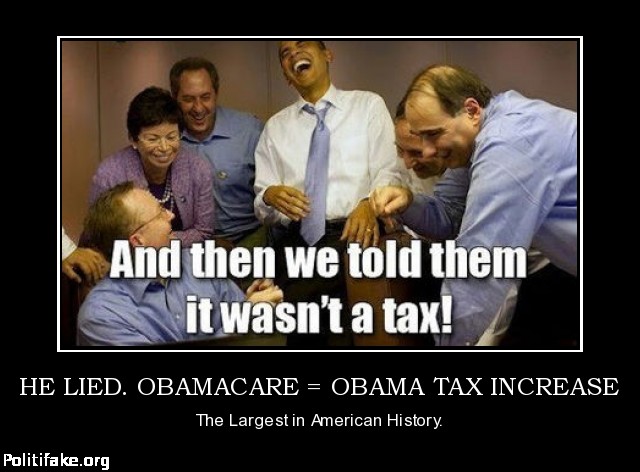
Matt Drudge is right, Estimated Taxes include Obamacare opt-out penalty
eHealth – How Much are the Obamacare Tax Penalties, and When Do They Apply?
Estimated Taxes
Obamacare Penalties: The Big Mistake Millions Are Making
Pay The Obamacare Penalty and Save The Money – Ron Meyer – Stuart Varney – FBN – 8-20-13
Matt Drudge Opts Out of Obamacare ‘For Life’
Opt-out Obamacare penalty actually can’t be enforced unless you get a tax refund (Limbaugh)
ObamaCare Fines, Fees and Expenses Explained pt1
ObamaCare Fines, Fees and Expenses Explained pt2
George Carlin – “I Gave Up On My Species” – We Are Circling The Drain
The Best of George Carlin: Exposing our government and fall of humanity one joke at a time
Circling The Drain (CTD)
‘LIBERTY TAX’: WHITE HOUSE, MEDIA ATTACK AFTER DRUDGE PAYS OBAMACARE OPT-OUT PENALTY
A White House aide set off a stampede of liberal media criticism for Internet news pioneer Matt Drudge over Obamacare – but his critics don’t seem to understand how small businesses pay taxes.
The brouhaha started when Drudge tweeted, “Just paid the Obamacare penalty for not ‘getting covered’… I’M CALLING IT A LIBERTY TAX.”
Jesse Lee, the Director of Progressive Media at Barack Obama’s White House, respondedthat that was a “Flat lie, no fee for previous year,” adding, “Scary how much influence he once had.”
Lee’s response to Drudge set off a firestorm in the liberal media, with many mainstream media and left-wing reporters countering him on Twitter and in their own articles to claim he does not have to pay Obamacare’s Individual Mandate tax until next year. The individual mandate went into effect Jan. 1 of this year, and most people paying their taxes right now are paying taxes for 2013.
“Dude, there’s no penalty until next yr,” Sahil Kapur of the leftwing Talking Points Memotweeted.
Kapur’s colleague at TPM Dylan Scott wrote a full story with a headline alleging Drudge was “probably lying.”
“Americans don’t pay a penalty for not having health insurance until they file their 2014 taxes — in 2015,” Scott wrote. “So either Drudge is lying or he paid a huge penalty a year earlier than he needed to.”
“Penalty isn’t collected until 2015,” Sam Baker of National Journal tweeted at Drudge.
The Huffington Post’s Jeffrey Young wrote a full article in which he described Drudge’s tweet as “weird” and a “little head-scratching” because the Obamacare tax does not kick in until the 2014 tax year.
Drudge indicated in his followup tweets that since he is self-employed as the proprietor of The Drudge Report, he files as a small business. According to the IRS’s website for self-employed individuals, they are required to pay taxes quarterly.
“As a self-employed individual, generally you are required to file an annual return and pay estimated tax quarterly,” the IRS website reads.
So, when they file and pay those 2014 first quarter taxes, such individuals have to pay the Obamacare Individual Mandate tax if they opted to not have health insurance—like Drudge just did.
Additionally, the IRS form (1040-ES) for estimating quarterly taxes specifically recommends adding the mandate penalty to line 12 for “other taxes” — to pay before the first quarterly deadline of April 15.
“It is true that thousands of small businesses will be forced to pay Obamacare taxes quarterly in 2014,” a Senate Budget Committee aide told Breitbart News on Friday afternoon.
Drudge even indicated as much in followup tweets, but the left-wing reporters—and the White House—have left their criticisms of him intact.
“Dazed team Obama media reporters think Opt-Out tax ‘year away’?” Drudge tweeted. “Not for small businesses that file Qtr estimates. We’re there NOW, baby #pay.”
“Capitalism means free enterprise, sovereignty of the consumers in economic matters, and sovereignty of the voters in political matters. Socialism means full government control of every sphere of the individuals life and the unrestricted supremacy of the government in its capacity as central board of production management.”
~Ludwig von Mises, Bureaucracy, page 10.
Obama on single payer health insurance
The Public Plan Deception – It’s Not About Choice
Glenn Beck Special – The Death Of Small Business
NFIB’s Todd Stottlemyer on the Health Care Debate (Part 1)
NFIB’s Todd Stottlemyer on the Health Care Debate (Part 2)
US Senator Saxby Chambliss debunking the 47 million uninsured
“47 Million Uninsured” Lie Explained – Mark Levin
Obama wants to destroy our healthcare: Mark Levin on Hannity
US Healthcare: A Short History
Why Is Healthcare So Expensive?
Medicare
Health Care Rally / Dr. Sally Pipes Part ONE
Health Care Rally / Dr. Sally Pipes Part TWO
Health Care Rally / Dr. Sally Pipes Part THREE
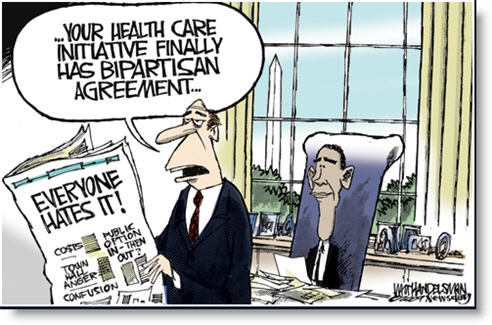
What will ObamaCare mean for you?
Much of the attention in the health care reform debate is being focused on the public option–the pathway to a single payer government monopoly of health care–socialized medicine.
Forgotten or not emphasized is the fact that the Federal Government under the proposed health care bills will require all individuals to purchase a qualified health care insurance plan if they do not have a health care plan from their employer or from the Federal Government such as Medicare or Medicaid.
The Democratic Party is telling the American people what they must spend their money on, namely an approved or qualified health insurance plan.
President Obama and his progressive radical socialist Democratic Party want to replace consumer sovereignty with government sovereignty, free enterprise with government command and control, and competition with monopoly in health care.
If you do not purchase such a government approved qualified health insurance plan for yourself and family, the Federal Government, namely the IRS will take money out of your checking account as a tax and fine to pay for the premium.
The majority of the people who do not have a health insurance plan are the young, the unemployed, and those working for small businesses or the self-employed that are not in a financial position to offer a group health care plan to their employees.
Many of the young Obama voters who think they will be getting “free” health care are in for a big surprise should a health care reform bill be enacted.
Yet the vast majority of health care expenditures are for the elderly, those on Medicare or for the very young.
In less than two years the first of the baby boomer generation, born between 1946 and 1964, the sons and daughters of the Greatest Generation, will become eligible for Medicare and Social Security.
Yet Medicare and within a few years Social Security are running deficits that are projected to be enormous as the entire baby boom generation becomes eligible for Medicare and Social Security.
I.O.U.S.A. Bonus Reel: Social Security+Medicare Projections
I.O.U.S.A. Bonus Reel: A $53 Trillion Federal Financial Hole
The payroll taxes for Medicare are simply not adequate to pay the medical, doctor and hospital bills of those covered by Medicare.
The Federal Government needs the insurance premiums paid by young and working Americans to pay for the health care benefits of the elderly.
Since the young and working age Americans have relatively less medical expenses than those on Medicare, a significant portion of the premiums paid by working and younger Americans could go to pay the cost of the elderly if there were a single payer system government monopoly over all health care premiums.
Currently doctors, hospitals and other providers shift the unreimbursed cost from Medicare and Medicaid to patients with private health care insurance.
The Federal Government simply is not paying its bills and is being subsidized by private sector employers, employees and individuals who purchase private insurance coverage or pay cash.
Cost Shifting in Health Care
Will Fox testifies before Congress
The problem is not private health insurance but government health insurance, namely Medicare and Medicaid.
Part 6: 5/8/09 John Stossel’s “You Can’t Even Talk About It”
Thus it is not surprising that President Obama and the progressive radical socialist Democratic Party favor a single payer system to bailout the Government at least for a few more years before the coming crisis and bankruptcy of Medicare and Medicaid.
The public option is the means to destroy competition and eventually eliminate private health insurance in the United States.
To accomplish this the Federal Government must first coerce all Americans who do not chose to purchase health insurance to either buy an approved plan or have the money taken out of their checking accounts.
You cannot have an honest debate about health care reform when the President of the United States repeatedly lies to the American people about the both the problem and his proposed solution.
You cannot have an honest debate about health care reform when tort reform will never be considered or enacted because the trial bar or attorneys give over 90% of their campaign contributions to the Democratic Party for the purpose of blocking tort reform.
Frivolous law suits result in rising medical malpractice insurance premiums and unnecessary medical testing and procedures directly impact the cost of medical care.
You cannot have an honest debate about health care reform when you hide the fact that Medicare and Medicaid cost are the real problem.
Medicare is a multi-generational ponzi scheme that is running on empty and profoundly immoral.
Now President Obama wants to make Medicare or socialized medicine universal–this would be fiscally irresponsible, destroy businesses and jobs and wreck the economy of the United States.
President Obama and the progressive radical socialist Democratic Party are attacking and demonizing doctors, the insurance industry, and the American people for daring to questioning his health insurance reform plan.
President Obama is not a leader on health care reform, he is a lying confidence man and extortionist.
If the Democratic Party truly cared about uninsured Americans, it could have joined decades ago with the Republican Party to give individuals the same tax advantages for individual health care insurance that employers have in deducting the premiums paid from their taxes for group insurance.
Instead the Democratic Party blocked such reform because that would not help their goal of a single payer universal health care or socialized medicine.
The American people are not falling for his and the Democratic Party’s socialist sting.
Milton Friedman – Socialized Medicine
Ronald Reagan speaks out on Socialized Medicine – Audio
“Our whole civilization rests on the fact that men have always succeeded in beating off the attack of the re-distributors. But the idea of re-distribution enjoys great popularity still, even in industrial countries. If we wish to save the world from barbarism we have to conquer Socialism, but we cannot thrust it carelessly aside.”
~Ludwig von Mises
Background Articles and Videos
The Swine Flu/Health Care Hoax
Support for Congressional Health Care Reform Falls to New Low
“…Public support for the health care reform plan proposed by President Obama and congressional Democrats has fallen to a new low as just 42% of U.S. voters now favor the plan. That’s down five points from two weeks ago and down eight points from six weeks ago.
A new Rasmussen Reports national telephone survey shows that opposition to the plan has increased to 53%, up nine points since late June.
More significantly, 44% of voters strongly oppose the health care reform effort versus 26% who strongly favor it. Intensity has been stronger among opponents of the plan since the debate began.
Sixty-seven percent (67%) of those under 30 favor the plan while 56% of those over 65 are opposed. Among senior citizens, 46% are strongly opposed.
Predictably, 69% of Democrats favor the plan, while 79% of Republicans oppose it. Yet while 44% of Democratic voters strongly favor the reform effort, 70% of GOP voters are strongly opposed to it.
Most notable, however, is the opposition among voters not affiliated with either party. Sixty-two percent (62%) of unaffiliated voters oppose the health care plan, and 51% are strongly opposed. This marks an uptick in strong opposition among both Republicans and unaffiliateds, while the number of strongly supportive Democrats is unchanged. …”
Fact Sheet: America’s Uninsured
The media repeat claims of 40 million to 50 million uninsured Americans, but facts from the Census Bureau and research organizations discredit it.
By Julia A. Seymour
Business & Media Institute
“…The media claim that there are 40 million to 50 million uninsured Americans and use that statistic to bolster calls for universal government-run insurance coverage. The inaccuracy has been repeated by print and broadcast journalists for years, but the true extent of the uninsured “crisis” is much smaller than those reports let on.
Myth:There are between 40 million and 50 million uninsured Americans. President Obama referred to “46 million uninsured Americans” in May 2009.
Fact: Anyone who reports that there are more than 46 million uninsured is exaggerating since the Census Bureau puts the number of uninsured at 45,657,000 people.
Fact: Nearly 10 million (9.7) of the 45.7 million uninsured are “not a citizen.” That makes every media claim of uninsured Americans higher than 35.9 million is wrong.
Myth:The 40 million to 50 million uninsured cannot afford health insurance.
Fact: More than 17 million of the uninsured make at least $50,000 per year (the median household income of $50,233) – 8.4 million make $50,000 to $74,999 per year and 9.1 million make $75,000 or higher. Two economists working at the National Bureau of Economic Research concluded that25 to 75 percent of those who do not purchase health insurance coverage “could afford to do so.”
Myth: The 40 million to 50 million uninsured do not get health care.
Fact: The National Center for Policy Analysis estimates that uninsured people get about $1,500 of free health care per year, or $6,000 per family of four.
Fact: An Urban Institute study found that 25 percent of the uninsured already qualify for government health insurance programs.
Myth: People will remain uninsured without government assistance.
Fact: The Congressional Budget Office says that 45 percent of the uninsured will be insured within four months. CBO Director Douglas Holtz-Eakin also said that the frequent claim of 40+ million Americans lacking insurance is an “incomplete and potentially misleading picture of the uninsured population.”
Fact: Liberal non-profit Kaiser Family Foundation put the number of uninsured Americans who do not qualify for government programs and make less than $50,000 a year between 8.2 million and 13.9 million. (The 8.2 million figure includes only those uninsured for two years or more.)
Fact: CBO analysis found that 36 million people would remain uninsured even if the Senate’s $1.6 trillion health care plan is passed. …”
White House public option ploy: A trial balloon, not a white flag
By Michelle Malkin
“…Do you believe the Sunday spin on the White House’s alleged “retreat” from the Obamacare public option?
Video of HHS Secretary Kathleen Sebelius’s pooh-poohing of the public option provision is here.
Drudge illustrated the AP story with a white flag.
Politico says the White House has “backed away.”
I’m not buying the hype. Are you?
The real Obama is a declared proponent of single-payer and universal health care Trojan Horses. All else is political theater.
Late Sunday, the health care czar’s office said Sebelius “misspoke.”
It’s not a misstatement. It’s not a surrender flag. It’s a trial balloon to measure the potential nutroots backlash versus the potential Senate pick-ups.
Besides, the public option provision can always be stuffed back in via a 3am manager’s amendment or during the House/Senate conference to reconcile each chamber’s Obamacare bills.
As for Democrat Sen. Kent Conrad’s health care “co-op” idea, the devil — as always — is in the details. …”
1900 to present day
Note: The following generations are listed in chronological order, but without specific birth year ranges.
Interbellum Generation – those born at the dawn of the 20th century and who grew up during the 1920s.
The Greatest Generation, the generation of veterans that fought and won World War II. They were born between World War I and the mid-1920s, coming of age during the Great Depression. Journalist Tom Brokaw dubbed this the Greatest Generation in a 1998 book of the same name. [1]
The Silent Generation was the generation who was too young to join the service when World War II started and prior to the end of the war. Many had fathers who served in World War I.
The Baby Boom Generation was the generation born just after World War II, a time that included a 14-year increase in birthrate worldwide. Baby Boomers in their teenage and college years were characteristically part of the counterculture of the 1960s, but later became more ideologically divided, although the generation remained widely committed to keystone values such as gender equality, racial equality, and environmental stewardship.[2]
Generation X is the generation generally defined as those born after the baby boom ended[3], extending from the early-to-mid 1960s to late 1970s. They connected to the pop culture of the 1980s to the early 1990s they grew up in.[4] Other names used interchangeably with Generation X are Reagan Generation, 13th Generation, and Baby Busters. Most of this generation are children of The Baby Boomers and The Silent Generation.
The MTV Generation are typically conceived as a “cusp” generation between Generation X and Generation Y that possess definable traits of both. While the music video and MTV rose to prominence during this generation’s formative period, it is also notable for being the last generation able to compare hardwired and analog technologies to wireless and digital technologies based upon personal experiences. They are also the last generation with personal memories of the Cold War era, and are sometimes called the Cold Y Generation.
The Generation Y, also known as Generation Next or the Millennials, are said to be dependent on digital technology. Generation Y is from 1980 to 1995 although there are no precise dates. [5][6][7][8][9][10][11] Until Generation Z began to come of age in the late 2000s, Gen Y was often ended around 2000 for convenience, but it is now more common to end Y and begin Z somewhere in the middle of the 1990s.
Generation Z are currently children, nicknamed “the digital natives”, born 1996 to about 2010. They are the generation that will come of age in the 2010s.
Time to ration health care for illegal aliens
By Michelle Malkin
“…I’ve said it before and I’ll say it again: Big Nanny Democrats want to ration health care for everyone in America – except those who break our immigration laws.
The latest cry for help comes from Nevada’s University Medical Center, via the Las Vegas Review Journal:
“Our people are really torn,” said Brian Brannman, UMC’s chief operating officer. “We want to take care of people who are ill. We’re proud that we can save lives. But our employees are also worried about the survival of UMC. They know that the appetite of taxpayers for helping undocumented immigrants is limited.”
Since April, UMC has been spending about $2 million per month providing emergency dialysis services to 80 illegal immigrants, Brannman said.
He projects that these services at UMC could run more than $24 million in the current fiscal year.
In each of the five prior years, the hospital provided the same emergency services to half as many illegal immigrants for a little more than $1 million per month.
Brannman said the hospital receives no reimbursement from federal, state or local sources to provide this life-saving treatment for people who have entered the country illegally.
But under federal law, any patient who shows up at an emergency department requesting an examination or treatment for a medical condition must be given an appropriate medical screening to determine whether there is an emergency. If there is, treatment must be provided.
“When we’re projecting a budget deficit of $70 million for fiscal year 2010, you can see that $24 million in dialysis treatment that’s not reimbursed is an awfully big chunk,” Brannman said.
UMC health care professionals say discussion of how to reform the nation’s health care system must include how to shore up taxpayer-supported hospitals, strained to the breaking point by following the law to care for those who are breaking it…
…”The federal government kicked the can down the road on the immigration issue and gave the bill to us,” Brannman said. “This is a federal policy failure that is driving huge health care costs to our citizens.”
The solution is not to give them health insurance, but to turn off the magnets that draw them to enter illegally in the first place.
The hospital has reached out to Mexican government officials to try and convince illegal aliens to return home. But “I can’t make them go back,” the Mexican consul in Las Vegas told the Review-Journal.
And the government officials in the United States who do have the power to deport them…won’t. …”
Paul Ryan Offers Amendment to Strike Government-Run Health Care Plan
Paul Ryan on Government-Run “Option”
Paul Ryan on the Patients’ Choice Act
Paul Ryan: Washington spending is “slow, wasteful and ineffective”
Todd Stottlemyer at Divided We Fail press conference
NFIB’s Todd Stottlemyer on the Health Care Debate (Part 1)
NFIB’s Todd Stottlemyer on the Health Care Debate (Part 2)
Small Business/Health Care Press Conference 7-29-09
The Impact of Mandatory Health Care Coverage on Small Businesses
Small Business and Health Care Reform – 1
Small Business and Health Care Reform – 2
Small Business and Health Care Reform – 3
Small Business and Health Care Reform – 4
Small Business and Health Care Reform – 5
Small Business and Health Care Reform – 6
Small Business and Health Care Reform – 7
Small Business and Health Care Reform – 8
Small Business and Health Care Reform – 9
Small Business and Health Care Reform – 10
Small Business and Health Care Reform – 11
Small Business and Health Care Reform – 12
Small Business and Health Care Reform – 13
Small Business and Health Care Reform – 14
Small Business and Health Care Reform – 15
Small Business and Health Care Reform – 16
Small Business and Health Care Reform – 17
Small Business and Health Care Reform – 18
Small Business and Health Care Reform – 19
First, mandatory health care or the Federal Government requiring employers and individuals to purchase a health care plan or pay a fine is a deal breaker as well as a job and business killer.
Second, the public option is also a deal killer for it would lead over time to a single payer or medicare for all.
Single payer would give the government a monopoly over health care that the majority of working Americans do not want nor will pay for.
Any politician of either political party that would support a health care reform bill that contain these provision will be targeted for defeat in the next election.
Without the support of small business and the self-employed, President Obama can forget about health care reform and a recovery that creates jobs.
The health care reform compromise is a health care bill that addresses 1) affordability, 2) portability, and 3) people covered by health care insurance and 4) ability to pay for non-catastrophic health care.
In order to get the cost of a health care plan to a price the young and low income person could afford you must have a very high deductible catastrophic plan.
In order to have portability the health plan should be one an individual can purchase for himself and immediate family. The individual insurance plan would not be tied to the current employer or be a group plan.
In order to get the highest number of people covered there must be a tax incentive at least equal to that an employer has in offering group health care insurance. Insurance premiums paid by an individual would have to be tax deductible.
In order to be able to pay for non-catastrophic care, health care saving accounts need to have higher annual contributions amounts.
Any health care reform bill that does not address unnecessary testing or defensive medicine as a result of frivilous law suits is not serious health care reform.
Background Articles and Videos
US Healthcare: A Short History
Health Care Reform – Why Do We Need Health Reform?


American People’s Crisis of Confidence in Big Government And Out of Control Spending and Taxes — Abandoning Both Political Parties — The Coming Of A Third Independent Party — Toppling Two Party Tyranny — The Wealth Creators Will Lead The American Renaissance — Videos
Posted on June 24, 2015. Filed under: American History, Articles, Blogroll, Books, Business, College, Communications, Constitution, Corruption, Crime, Crisis, Documentary, Economics, Education, Employment, Faith, Family, Federal Government, Federal Government Budget, Fiscal Policy, Foreign Policy, Fraud, Freedom, government, government spending, Health Care, history, History of Economic Thought, Illegal, Immigration, Investments, IRS, Law, Legal, liberty, Life, Links, media, National Security Agency (NSA), National Security Agency (NSA_, Non-Fiction, Obamacare, People, Philosophy, Politics, Radio, Radio, Rants, Raves, Regulations, Talk Radio, Tax Policy, Taxation, Taxes, Video, War, Wealth, Welfare, Wisdom, Writing | Tags: 17 June 2015, Abandoning Both Political Parties, America, American people, American Renaissance, Americans Have Lost Confidence ... in Everything, articles, Audio, Breaking News, Broadcasting, capitalism, Cartoons, Charity, Citizenship, Clarity, Classical Liberalism, Collectivism, Commentary, Commitment, Communicate, Communication, Concerns, Concise, Confidence In Institutions, Confidence in U.S. Institutions, Congress. Military, Convincing, Courage, Crisis of Confidence in Big Government, Culture, Current Affairs, Current Events, Democratic Party, Dr. Yaron Brook, economic growth, economic policy, Economics, Education, Evil, Experience, Faith, Family, First, fiscal policy, free enterprise, Free Market Captialism, Free Market Revolution, freedom, freedom of speech, Friends, G. Edward Griffin, Gallup Polls, Give It A Listen, God, Good, Goodwill, Growth, Hope, Independents, Individualism, Issues, Knowledge, Leave Us Alone, liberty, Life, Love, Lovers of Liberty, Milton Friedman, Milton Friedman on Classical Liberalism, Milton Friedman on Libertarianism, monetary policy, MPEG3, Myths That Conceal Reality, News, Opinions, Out of Control Spending and Taxes, Party Affiliation, Peace, Peace and Prosperity Economy, Photos, Podcasts, police, political parties in the United States, Political Philosophy, Politics, Polls, prosperity, Radio, Raymond Thomas Pronk, Representative Republic, Republic, Republican Party, Resources, Respect, rule of law, Rule of Men, Show Notes, Small Business, TAKE IT TO THE LIMITS, Talk Radio, The Pronk Pops Show, The Pronk Pops Show 487, The Wealth Creators, Toppling Two Party Tyranny, Truth, Tyranny, U.S. Constitution, U.S. Economic Confidence Index, United States of America, Videos, Virtue, War, Why Be Selfish?, Wisdom |
The Pronk Pops Show Podcasts
Pronk Pops Show 487: June 17, 2015
Pronk Pops Show 486: June 16, 2015
Pronk Pops Show 485: June 15, 2015
Pronk Pops Show 484: June 12, 2015
Pronk Pops Show 483: June 11, 2015
Pronk Pops Show 482: June 10, 2015
Pronk Pops Show 481: June 9, 2015
Pronk Pops Show 480: June 8, 2015
Pronk Pops Show 479: June 5, 2015
Pronk Pops Show 478: June 4, 2015
Pronk Pops Show 477 June 3, 2015
Pronk Pops Show 476: June 2, 2015
Pronk Pops Show 475: June 1, 2015
Pronk Pops Show 474: May 29, 2015
Pronk Pops Show 473: May 28, 2015
Pronk Pops Show 472: May 27, 2015
Pronk Pops Show 471: May 26, 2015
Pronk Pops Show 470: May 22, 2015
Pronk Pops Show 469: May 21, 2015
Pronk Pops Show 468: May 20, 2015
Pronk Pops Show 467: May 19, 2015
Pronk Pops Show 466: May 18, 2015
Pronk Pops Show 465: May 15, 2015
Pronk Pops Show 464: May 14, 2015
Pronk Pops Show 463: May 13, 2015
Pronk Pops Show 462: May 8, 2015
Pronk Pops Show 461: May 7, 2015
Pronk Pops Show 460: May 6, 2015
Pronk Pops Show 459: May 4, 2015
Pronk Pops Show 458: May 1, 2015
Pronk Pops Show 457: April 30, 2015
Pronk Pops Show 456: April 29, 2015
Pronk Pops Show 455: April 28, 2015
Pronk Pops Show 454: April 27, 2015
Pronk Pops Show 453: April 24, 2015
Pronk Pops Show 452: April 23, 2015
Pronk Pops Show 451: April 22, 2015
Pronk Pops Show 450: April 21, 2015
Pronk Pops Show 449: April 20, 2015
Pronk Pops Show 448: April 17, 2015
Pronk Pops Show 447: April 16, 2015
Pronk Pops Show 446: April 15, 2015
Pronk Pops Show 445: April 14, 2015
Pronk Pops Show 444: April 13, 2015
Pronk Pops Show 443: April 9, 2015
Pronk Pops Show 442: April 8, 2015
Pronk Pops Show 441: April 6, 2015
Pronk Pops Show 440: April 2, 2015
Pronk Pops Show 439: April 1, 2015
Pronk Pops Show 438: March 31, 2015
Pronk Pops Show 437: March 30, 2015
Pronk Pops Show 436: March 27, 2015
Pronk Pops Show 435: March 26, 2015
Pronk Pops Show 434: March 25, 2015
Pronk Pops Show 433: March 24, 2015
Pronk Pops Show 432: March 23, 2015
Pronk Pops Show 431: March 20, 2015
Pronk Pops Show 430: March 19, 2015
Pronk Pops Show 429: March 18, 2015
Pronk Pops Show 428: March 17, 2015
Pronk Pops Show 427: March 16, 2015
Pronk Pops Show 426: March 6, 2015
Pronk Pops Show 425: March 4, 2015
Pronk Pops Show 424: March 2, 2015
Story 1: American People’s Crisis of Confidence in Big Government And Out of Control Spending and Taxes — Abandoning Both Political Parties — The Coming Of A Third Independent Party — Toppling Two Party Tyranny — The Wealth Creators Will Lead The American Renaissance — Videos
Free Market Revolution -The Solution to what Ails America Today
The mission of the Financial Policy Council Inc. (FPC), a research think tank and educational institution, is to formulate and promote sound public policy based on the principles of free enterprise and wealth creation as envisioned by the ideals of the American Founding Fathers.
Our goal is to ensure that America, the land of opportunity where freedom and prosperity have flourished, is not derailed by poorly formulated and reactive economic, fiscal and tax policy. In addition, our goal is to retain and reclaim America’s leading role in the global economic community.
Dr. Yaron Brook | Why Be Selfish? | Full Length HD
G. Edward Griffin – The Collectivist Conspiracy
Confidence In Institutions – GBTV
Matt Welch Tackles Two Party Tyranny on Stossel
TAKE IT TO THE LIMITS: Milton Friedman on Libertarianism
Milton Friedman on Classical Liberalism
Milton Friedman Speaks – Is Capitalism Humane?
Milton Friedman Speaks –
Myths That Conceal Reality
Party Affiliation
http://www.gallup.com/poll/15370/party-affiliation.aspx
U.S. Economic Confidence Index Steady at -9
Story Highlights
WASHINGTON, D.C. — Gallup’s U.S. Economic Confidence Index registered at -9 for the week ending June 7, the sixth straight week the index has been at or below -5.
After climbing steadily during the fall of last year and registering positive scores from late December through mid-February, the U.S. Economic Confidence Index slipped to between -3 and -4 for most of March and April in Gallup’s weekly averages. The index dipped more at the start of May, reaching -9, and has remained near that level since.
Still, on a relative basis the recent weekly index readings are much higher than Gallup found for most weeks between January 2008 and November 2014, when the index ranged from -65 to -3.
Gallup’s Economic Confidence Index is the average of two components: Americans’ views of current economic conditions and their perceptions of whether the U.S. economy is getting better or getting worse. The theoretical maximum for the index is +100, if all Americans say the economy is excellent or good and getting better. The theoretical minimum is -100, if all Americans say the economy is poor and getting worse.
For the week ending June 7, 24% of Americans said the economy is excellent or good while 30% said it is poor, resulting in a current conditions score of -6. The economic outlook score of -12, the lowest score for this component since early May, is the result of 42% of Americans saying the economy is getting better and 54% saying it is getting worse.
Bottom Line
Americans’ outlook has improved on a variety of economic measures, but their overall confidence in the U.S. economy is registering significantly lower values in the past several weeks than it did from late December to late April.
The recent erosion in confidence may be related to rising gas prices since the beginning of the year. The direction of gas prices in the months ahead could help predict the trajectory of economic confidence, as could other economic information consumers are likely to pick up on, including the monthly government jobs report — which for May was stronger than some analysts expected.
The data in this article are available in Gallup Analytics.
Survey Methods
Results for this Gallup poll are based on telephone interviews conducted June 1-7, 2015, on the Gallup U.S. Daily survey, with a random sample of 3,035 adults, aged 18 and older, living in all 50 U.S. states and the District of Columbia. For results based on the total sample of national adults, the margin of sampling error is ±2 percentage points at the 95% confidence level. All reported margins of sampling error include computed design effects for weighting.
Each sample of national adults includes a minimum quota of 50% cellphone respondents and 50% landline respondents, with additional minimum quotas by time zone within region. Landline and cellular telephone numbers are selected using random-digit-dial methods.
Learn more about how Gallup Daily tracking works.
http://www.gallup.com/poll/183533/economic-confidence-index-steady.aspx?utm_source=Economy&utm_medium=newsfeed&utm_campaign=tiles
Confidence in U.S. Institutions Still Below Historical Norms
Story Highlights
PRINCETON, N.J. — Americans’ confidence in most major U.S. institutions remains below the historical average for each one. Only the military (72%) and small business (67%) — the highest-rated institutions in this year’s poll — are currently rated higher than their historical norms, based on the percentage expressing “a great deal” or “quite a lot” of confidence in the institution.
These results are based on a June 2-7 Gallup poll that included Gallup’s latest update on confidence in U.S. institutions. Gallup first measured confidence ratings in 1973 and has updated them each year since 1993.
Americans’ confidence in most major institutions has been down for many years as the nation has dealt with prolonged wars in Iraq and Afghanistan, a major recession and sluggish economic improvement, and partisan gridlock in Washington. In fact, 2004 was the last year most institutions were at or above their historical average levels of confidence. Perhaps not coincidentally, 2004 was also the last year Americans’ satisfaction with the way things are going in the United States averaged better than 40%. Currently, 28% of Americans are satisfied with the state of the nation.
From a broad perspective, Americans’ confidence in all institutions over the last two years has been the lowest since Gallup began systematic updates of a larger set of institutions in 1993. The average confidence rating of the 14 institutions asked about annually since 1993 — excluding small business, asked annually since 2007 — is 32% this year. This is one percentage point above the all-institution average of 31% last year. Americans were generally more confident in all institutions in the late 1990s and early 2000s as the country enjoyed a strong economy and a rally in support for U.S. institutions after the 9/11 terrorist attacks.
Confidence in Political, Financial and Religious Institutions Especially Low
Today’s confidence ratings of Congress, organized religion, banks, the Supreme Court and the presidency show the greatest deficits compared with their historical averages, all running at least 10 points below that mark. Americans’frustration with the government’s performance has eroded the trust they have in all U.S. political institutions. Likewise, Americans’ confidence in banks fell after the bursting of the housing bubble and the subsequent financial crisis.
The large decline in confidence in organized religion is likely tied to a decline in religiosity overall, but also to scandals that have plagued various religious organizations, most notably the Catholic Church. This year’s 42% score for confidence in the church or organized religion is the lowest Gallup has measured for that institution. The prior low was 44% in 2012.
Confidence in the police, at 52% this year, ties the low for that institution recorded in the first year it was measured, 1993. In the past year, the police have been a major focus of news coverage in several incidents in which white police officers’ actions resulted in the deaths of black men they were trying to apprehend.
Still, the church and the police rank among the highest-rated institutions, trailing only the military and small business among the 15 institutions tested in this year’s poll. Further back in history, the church ranked first or tied for first in all but one survey from 1973 through 1988. Since then, the military has been the top-ranked institution each year except 1997, when small business was first.
Congress is the institution in which Americans express the least confidence this year, with 8% doing so, one point above its 7% rating last year — the lowest Gallup has ever measured for any institution. Congress has ranked last each year since 2010, and a total of 12 times since 1973. Other institutions that have held this unwelcome distinction in the past include big business (nine times), health maintenance organizations (eight), the criminal justice system (six) and organized labor (four). The top- and bottom-rated institutions in each Confidence in Institutions poll are shown at the bottom of this story.
Implications
Americans continue to show lower levels of confidence in most of the major institutions central to U.S. society, with only the military and small business getting ratings in 2015 that are above their historical averages. That speaks to the broader dissatisfaction Americans have with the state of the nation more generally over the past decade as the U.S. has faced serious economic, international and political challenges. Americans have tended to be more confident in U.S. institutions when the economy has been strong, such as in the mid-1980s and the late 1990s and early 2000s. Although Americans are now more upbeat about the economy than they were in 2008-2013, they are not yet convinced that the economy is good, given that their assessments of national economic conditions remain more negative than positive.
Survey Methods
Results for this Gallup poll are based on telephone interviews conducted June 2-7, 2015, with a random sample of 1,527 adults, aged 18 and older, living in all 50 U.S. states and the District of Columbia. For results based on the total sample of national adults, the margin of sampling error is ±3 percentage points at the 95% confidence level. All reported margins of sampling error include computed design effects for weighting.
Each sample of national adults includes a minimum quota of 50% cellphone respondents and 50% landline respondents, with additional minimum quotas by time zone within region. Landline and cellular telephone numbers are selected using random-digit-dial methods.
View survey methodology, complete question responses, and trends.
Learn more about how the Gallup Poll Social Series works.
http://www.gallup.com/poll/183593/confidence-institutions-below-historical-norms.aspx?utm_source=Politics&utm_medium=newsfeed&utm_campaign=tiles
Confidence in U.S. Branches of Government Remains Low
WASHINGTON, D.C. — Americans’ confidence in each of the three branches of the U.S. government remains low, with confidence in Congress and the Supreme Court near their all-time lows reached last year. Currently, 33% of Americans have “a great deal” or “quite a lot” of confidence in the presidency, 32% are this confident in the Supreme Court, and Congress is still well behind, at 8%.
While Congress has consistently received the lowest confidence rating of the three branches of government, the Supreme Court and the presidency usually track each other closely. This is apart from times when the incumbent president has been extremely popular, as in 1991 and 2002, or exceptionally unpopular, as in 2007 and 2008.
Gallup’s June 2-7 poll found confidence in the presidency rising slightly to 33% from 29% last year, which in turn was just four percentage points above the historical low of 25% in 2007. The uptick in confidence in the presidency this year is consistent with Americans’ higher job approval ratings of President Barack Obama since last fall.
Meanwhile, ratings of the Supreme Court and Congress, which had dropped to record lows in 2014, have barely moved.
Confidence in the Presidency in Obama’s Seventh Year Exceeds Bush’s
The president in office is not mentioned by name in the confidence in the presidency question, but Americans’ evaluations of the sitting president at the time are strongly related to how much confidence Americans place in the presidency as an institution.
Confidence in the presidency as an institution during each year of Obama’s presidency has generally been lower than the comparable year in the presidencies of Bill Clinton and George W. Bush. An exception is Obama’s first year, when Americans had greater confidence in the institution than in the first years of either Bush or Clinton. Also, in Obama’s current year in office, his seventh, confidence in the presidency is higher than the 25% found in Bush’s seventh year — the record low — but lower than the 49% in Clinton’s seventh year.
The highest confidence rating the presidency has ever received is 72%, in March 1991 during the administration of George H.W. Bush shortly after he had succeeded in pushing Iraq out of Kuwait in the Gulf War. However, by October of that same year, after the Gulf War was over, confidence in the presidency had dropped to 50%.
Average Confidence in the Three Branches Is Low, but Has Been Lower
The average confidence rating for the three branches of government combined is 24%, lower than most previous averages since 1991 and well below the high of 50% that year.
But the average of confidence ratings for the three branches of government has been lower — including in 2008 (23%) and 2014 (22%).
Bottom Line
Americans’ confidence in two of the three institutions that make up the U.S. government — Congress and the Supreme Court — remains near their all-time lows reached in 2014, while confidence in the presidency, although low, is up marginally compared with last year.
For Congress, low confidence in the institution is nothing new to members of the Senate and the House of Representatives, who have also seen low job approval ratings in recent years. Individual members likely aren’t as interested in Americans’ collective opinions as they are in the views of the voters they must appeal to back home. But the public’s extremely low confidence no doubt weighs on Congress at some level.
The Supreme Court, meanwhile, is not directly accountable to the public — and often defies public opinion completely. Although its unelected members serve indefinite terms, confidence in the court is not unsusceptible to a drop in confidence in government as a whole.
Survey Methods
Results for this Gallup poll are based on telephone interviews conducted June 2-7, 2015, with a random sample of 1,527 adults, aged 18 and older, living in all 50 U.S. states and the District of Columbia. For results based on the total sample of national adults, the margin of sampling error is ±3 percentage points at the 95% confidence level. All reported margins of sampling error include computed design effects for weighting.
Each sample of national adults includes a minimum quota of 50% cellphone respondents and 50% landline respondents, with additional minimum quotas by time zone within region. Landline and cellular telephone numbers are selected using random-digit-dial methods.
http://www.gallup.com/poll/183605/confidence-branches-government-remains-low.aspx?utm_source=Politics&utm_medium=newsfeed&utm_campaign=tiles
Americans Have Lost Confidence … in Everything
It’s not just Congress and the economy that have Americans concerned these days.
Americans expressed a lack of confidence in banks and Congress, among other institutions.
By Kenneth T. WalshJune 17, 2015 | 7:20 a.m. EDT+ More
Americans have little confidence in most of their major institutions including Congress, the presidency, the Supreme Court, banks and organized religion, according to the latest Gallup poll.
“Americans’ confidence in most major U.S. institutions remains below the historical average for each one,” a Gallup spokesman said in a news release. Only the military, in which 72 percent of Americans express confidence, up from a historical average of 68 percent, and small business, with 67 percent confidence, up from 63, are currently rated higher than their historical norms. This is based on the percentage expressing “a great deal” or “quite a lot” of confidence in these institutions, the Gallup spokesman said.
Only 8 percent have confidence in Congress, down by 16 points from a long-term average of 24 percent – the lowest of all institutions rated. The rating is about the same as last year’s 7 percent, the lowest Gallup has ever measured for any institution.
Thirty-three percent have confidence in the presidency, a drop from a historical average of 43 percent.
Thirty-two percent have confidence in the Supreme Court, down from 44.
All in all, it’s a picture of a nation discouraged about its present and worried about its future, and highly doubtful that its institutions can pull America out of its trough. In a political context, the findings indicate that the growing number of presidential candidates for 2016 will have a difficult time instilling confidence in a skeptical electorate that they have the answers to the country’s problems.
“Americans’ confidence in most major institutions has been down for many years as the nation has dealt with prolonged wars in Iraq and Afghanistan, a major recession and sluggish economic improvement, and partisan gridlock in Washington,” the Gallup spokesman said. “In fact, 2004 was the last year most institutions were at or above their historical average levels of confidence. Perhaps not coincidentally, 2004 was also the last year Americans’ satisfaction with the way things are going in the United States averaged better than 40 percent. Currently, 28 percent of Americans are satisfied with the state of the nation.”
The Gallup spokesman added: “From a broad perspective, Americans’ confidence in all institutions over the last two years has been the lowest since Gallup began systematic updates of a larger set of institutions in 1993.”
Twenty-eight percent have confidence in banks, down from 40 percent.
Twenty-one percent have confidence in big business, down from 24 percent.
Twenty-four percent have confidence in organized labor, down from 26.
Twenty-four percent have confidence in newspapers, down from 32 percent. Twenty-one percent have confidence in television news, down from 30 percent.
The police also have experienced a drop in public esteem, with 52 percent of Americans saying they are confident in the police compared with 57 percent who have been confident in the police historically. Police have been widely criticized in recent months for abusive tactics toward African-Americans, which resulted in the deaths of several black men.
Forty-two percent express confidence in organized religion, down from 55.
“Americans continue to show lower levels of confidence in most of the major institutions central to U.S. society, with only the military and small business getting ratings in 2015 that are above their historical averages,” the Gallup spokesman said. “That speaks to the broader dissatisfaction Americans have with the state of the nation more generally over the past decade as the U.S. has faced serious economic, international and political challenges. Americans have tended to be more confident in U.S. institutions when the economy has been strong, such as in the mid-1980s and the late 1990s and early 2000s. Although Americans are now more upbeat about the economy than they were in 2008-2013, they are not yet convinced that the economy is good, given that their assessments of national economic conditions remain more negative than positive.”
AMERICANS LOSE CONFIDENCE IN EVERYTHING
Poll shows views turning negative on banks, government, religion, police, media
An explosive new Gallup poll shows Americans have lost confidence in almost every major institution – from the U.S. presidency, Congress and the Supreme Court to banks and organized religion.
“Americans’ confidence in most major U.S. institutions remains below the historical average for each one,” a Gallup spokesman said.
Only the military (72 percent) and small business (67 percent) have Americans’ increasing confidence, both of which are now rated 4 percentage points higher than their historical norms, according to the poll.
Congress – which plunged 16 points from its average of 24 points – is the lowest ranking institution at just 8 percent.
Just as numerous presidential candidates attempt to convince America that they have the answers to the nation’s problems, the poll shows only one-third, or 33 percent, of Americans have confidence in the presidency, a nosedive from the historical average of 43 percent.
Likewise, just 32 percent said they have confidence in the Supreme Court, which is down from an average of 44 just before the court announces its decisions on landmark issues such as same-sex marriage and Obamacare subsidies to states without insurance-exchange websites.
image: http://www.wnd.com/files/2015/06/gallup_2015.jpg
“Americans’ confidence in most major institutions has been down for many years as the nation has dealt with prolonged wars in Iraq and Afghanistan, a major recession and sluggish economic improvement, and partisan gridlock in Washington,” a Gallup spokesman said. “In fact, 2004 was the last year most institutions were at or above their historical average levels of confidence. Perhaps not coincidentally, 2004 was also the last year Americans’ satisfaction with the way things are going in the United States averaged better than 40 percent. Currently, 28 percent of Americans are satisfied with the state of the nation.”
In 2004, President George W. Bush was re-elected and the U.S. transferred sovereignty and control of Iraq back to the Iraqi people.
At the beginning of 2004, the U.S. economy was booming. Four middle-class tax cuts were extended, including a $1,000-per-couple child tax credit, expansion of the lowest (10 percent) tax bracket, exceptions for the alternative minimum tax, and relief from the “marriage penalty” for two-income families. Another $140 billion in tax relief was granted to U.S. business. Unemployment dropped from 5.7 percent to 5.4 percent.
Regarding the latest poll numbers, the Gallup spokesman added, “From a broad perspective, Americans’ confidence in all institutions over the last two years has been the lowest since Gallup began systematic updates of a larger set of institutions in 1993.”
In the last two years, Americans have seen President Obama begin his second term of office. Amid an explosion of legalized same-sex marriage in numerous U.S. states, the Supreme Court declared the Defense of Marriage Act unconstitutional.
Americans witnessed the debt-ceiling crisis in October 2013, which resulted in the shutdown of the federal government and furlough of federal workers.
By 2014, the Obama administration had announced its plan to shrink the military budget to $522 billion and slash the Army to a size unseen since before World War II. The nation also saw Americans impacted by a West African Ebola outbreak and revelations that the Veterans Administration had covered up exceedingly long wait times for veterans seeking medical attention.
The year 2014 also saw the rise of terrorist group ISIS and racial riots in Ferguson, Missouri, and St. Louis after the fatal police shooting of Michael Brown in August. By 2015, riots had broken out in Baltimore, Maryland, over the shooting of Freddie Gray.
image: http://www.wnd.com/files/2015/06/Gallup_2015b.jpg
According to the Gallup poll, 28 percent of Americans now have confidence in banks, compared to the historical average of 40 percent.
Twenty-one percent said they have confidence in big business, down from 24 percent.
Twenty-four percent have confidence in organized labor, down from 26 percent.
Twenty-four percent have confidence in newspapers, down from 32 percent.
Twenty-one percent have confidence in TV news, down from 30 percent.
Fifty-two percent have confidence in police, down from 57 percent.
Forty-two percent have confidence in organized religion, down from 55.
“Americans continue to show lower levels of confidence in most of the major institutions central to U.S. society, with only the military and small business getting ratings in 2015 that are above their historical averages,” the Gallup spokesman said.
“That speaks to the broader dissatisfaction Americans have with the state of the nation more generally over the past decade as the U.S. has faced serious economic, international and political challenges. Americans have tended to be more confident in U.S. institutions when the economy has been strong, such as in the mid-1980s and the late 1990s and early 2000s.”
While Americans are more confident in the economy than they were from 2008 to 2013, the Gallup spokesman said, “[T]hey are not yet convinced that the economy is good, given that their assessments of national economic conditions remain more negative than positive.”
http://www.wnd.com/2015/06/poll-americans-lose-confidence-in-everything/
List of political parties in the United States
This is a list of political parties in the United States, both past and present.
Parties with federal representation
Current United States Congressional seats
Congressional leadership of the House of Representatives
Congressional leadership of the Senate
The Vice President of the United States has the additional duty of President of the Senate. Because the number of seats in the United States Senate is an even number (two senators per state), it is the Vice President’s duty as President of the Senate to cast a tie-breaking vote in the event that “they be equally divided”—an equal number of Senators voting both for and against a motion.
Parties with state representation
Major political parties
A party that has “an independent state organization… in a majority of the states”[1] is listed as a major party. An “independent state organization” is not to be confused with the organization of an Independent Democrat or Independent Republican.
Minor political parties
This listing of minor parties does not include independents.
Regional parties
These parties are based only in states or certain regions and rarely, if ever, offer candidates for national offices. These are all parties that are unaffiliated with national parties. Each state has official state chapters of the major parties as well as some of the minor parties.
Alaska
Connecticut
Delaware
Hawaii
Michigan
Minnesota
New York
Northern Mariana Islands[edit]
Ohio
Oregon
Puerto Rico
Rhode Island
U.S. Virgin Islands
Vermont
Wisconsin
Historical parties
Non-electoral organizations
These organizations do not nominate candidates for election but otherwise function similarly to political parties. Some of them have nominated candidates in the past.
See also
References
Further reading
External links
https://en.wikipedia.org/wiki/List_of_political_parties_in_the_United_States
Why Economic Freedom Matters
http://platform.twitter.com/widgets/tweet_button.c197f64a14a7434e6e58ca9722b54406.en.html#_=1434661467776&count=horizontal&counturl=http%3A%2F%2Fwww.heritage.org%2Findex%2Fbook%2Fchapter-2&dnt=false&id=twitter-widget-0&lang=en&original_referer=http%3A%2F%2Fwww.heritage.org%2Findex%2Fbook%2Fchapter-2&size=m&text=Why%20Economic%20Freedom%20Matters%20%7C%202015%20Index%20of%20Economic%20Freedom%20Book%3A&url=http%3A%2F%2Fwww.heritage.org%2Findex%2Fbook%2Fchapter-2%23.VYMyW9nFDwI.twitter
Since its inception in 1995, the Index of Economic Freedom has chronicled hundreds of examples of government policy changes that have enhanced economic freedom, thereby promoting human progress and greater prosperity. As the Index has catalogued, nations with higher degrees of economic freedom prosper because they capitalize more fully on the ability of the free-market system not only to generate, but also to reinforce dynamic growth through efficient resource allocation, value creation, and innovation. Policies that promote freedom, whether through improvements in the rule of law, the promotion of competition and openness, or suitable restraints on the size and economic reach of government, turn out in practice to offer and advance practical solutions to a wide range of economic and social challenges that face the world’s societies.
The findings of the 2015 Index once again demonstrate the strongly positive linkages between economic freedom and various dimensions of human development. Many of the linkages are straightforward: Higher taxes, for example, reduce investment and hurt job growth. Others, such as the impact on economic growth from the promotion of property rights or the maintenance of a stable monetary system, are more intricate, multidimensional, and nonlinear.
Even in these cases, however, the evidence is strong that adherence to the principles of economic freedom is an unmatched strategy for promoting solutions to human problems and advancing overall well-being. No alternative systems—and many have been tried—come close to the record of free-market capitalism in promoting growth and improving the human condition.
Economic Freedom: Advancing Opportunity
Today’s successful economies are not necessarily geographically large or richly blessed with natural resources. Many economies have managed to expand opportunities for their citizens by enhancing their economic dynamism. In general, the overarching objective of economic policies must be to create an environment that provides the most opportunity for the widest range of activities that can lead to increased prosperity.
The Index results have shown that sustaining such economic dynamism is achievable only when governments adopt economic policies that empower individuals and firms with more choices, encouraging greater entrepreneurship.
It is noteworthy that despite recent policy missteps by many countries in responding to the global economic slowdown, which amounted to a political assault on capitalism in some places, the free-market system is not on the verge of breakdown. In fact, as the negative impact of regulatory and spending mistakes has become apparent, a greater number of people around the world seem to be realizing that the economic damage inflicted by the heavy hand of government—subpar growth, deteriorating entrepreneurial environments, and lower employment growth—is not inevitable, but rather the result of bad policy choices.
Even as the free market has been under challenge in countries such as Venezuela, Bolivia, Russia, and even the United States, many other governments around the world have acknowledged its superiority. Decades of evidence, some presented in the pages of this Index, are hard for even the most ideological governments to ignore. Not only does the free-market system remain viable, but many of its core features, such as private property rights, openness to trade and investment, and fiscal discipline, have entrenched themselves as the policy standard, any deviation from which requires strong justification.
Economic Freedom: Promoting Prosperity
In many respects, economic freedom is merely shorthand for an openness to entrepreneurial activity that increases opportunity for individuals to succeed in their endeavors. Chart 1 shows the close correspondence between economic freedom and entrepreneurial opportunity as measured by the Entrepreneurship and Opportunity sub-index of the Legatum Prosperity Index, which “measures a country’s entrepreneurial environment, its promotion of innovative activity, and the evenness ofopportunity.”
Given such a strong relationship, it should be apparent that a government’s most effective stimulus activity will not be to increase its own spending or increase layers of regulation, both of which reduce economic freedom. The best results are likely to be achieved instead through policy reforms that improve the incentives that drive entrepreneurial activity, creating more opportunities for greater economicdynamism.
Equally notable are the fundamental benefits that stem from the strong positive relationship between economic freedom and levels of per capita income. For countries achieving scores in the Index that reflect even moderate levels of economic freedom (60 or above), the relationship between economic freedom and per capita GDP is highly significant.
As indicated in Chart 2, countries moving up the economic freedom scale show increasingly high levels of average income. Economies rated “free” or “mostly free” in the 2015 Index enjoy incomes that are over twice the average levels in all other countries and more than five times higher than the incomes of “repressed” economies.
Economic Freedom: Antidote to Poverty
By a great many measures, the past two decades during which the Index has been charting the advance of economic freedom have been the most prosperous in the history of humankind. Those countries that have adopted some version of free-market capitalism, with economies supported by efficient regulations and open to the free flow of goods, services, and capital, have participated in an era of globalization and economic integration in which solutions to many of the world’s development problems have taken hold and generated real improvements in living standards.
The free-market system that is rooted in the principles of economic freedom has fueled unprecedented economic growth around the world. As Chart 3 illustrates, as the global economy has moved toward greater economic freedom over the past two decades, real world GDP has increased by about 70 percent, and the global poverty rate has been cut in half, lifting hundreds of millions of people out of poverty.
Greater economic freedom has had a positive impact not just on the number of people in poverty, but also on the intensity of the poverty still experienced by some. Poverty intensity as measured by the United Nations Development Programme’s Multidimensional Poverty Index, which assesses the nature and intensity of deprivation at the individual level in education, health outcomes, and standard of living, is much lower on average in countries with higher levels of economic freedom. Chart 5 shows that the intensity of poverty in countries whose economies are considered mostly free or moderately free is only about one-fourth the level in countries that are rated less free.
The key driver of poverty reduction is dynamic and resilient economic growth that creates jobs. Not surprisingly, one of the most important goals of economic policy in almost every country in the world has thus been to increase the rate of economic growth.
As Chart 4 demonstrates, there is a robust relationship between improving economic freedom and achieving higher per capita economic growth. Whether long-term (20 years), medium-term (10 years), or short-term (five years), the relationship between changes in economic freedom and changes in economic growth is consistently positive.
Undeniably, countries moving toward greater economic freedom tend to achieve higher rates of per capita GDP growth over time. Whether in the short term or over the long run, the average annual per capita economic growth rates of countries that have grown economic freedom the most are at least 50 percent higher than those of countries where freedom has stagnated or slowed.
Economic Freedom: Societal Development and Democratic Progress
Growing economic freedom is unequivocally about more than financial success. Achieving greater overall prosperity that goes beyond materialistic and monetary dimensions of well-being is equally important. The societal benefits of economic freedom extend far beyond higher incomes or reductions in poverty. Countries with higher levels of economic freedom enjoy higher levels of overall human development as measured by the United Nations Human Development Index, which measures life expectancy, literacy, education, and the standard of living in countries worldwide. As Chart 6 shows, governments that choose policies that increase economic freedom are placing their societies on the pathway to more education opportunities, better health care, and higher standards of living for their citizens.
In some countries, government policies and actions concerning the environment have become more intrusive and economically distortionary. Many governments have pushed programs to tax carbon emissions and increase taxes on gasoline, organized non-transparent and sometimes corrupt exchanges for the buying and selling of carbon emissions, and provided subsidies for “clean” energy to politically favored firms. Such policies impose a huge direct cost on society, and they also retard economic growth—and all for uncertain environmental benefits.
Interestingly, the same free-market principles that have proven to be the key to economic success have also proven to deliver environmental success. Around the world, economic freedom has been shown to increase countries’ capacity for innovation and thus to improve overall environmental performance.
The positive link between economic freedom and higher levels of innovation ensures greater economic dynamism in coping with various developmental challenges, and the most remarkable improvements in clean energy use and energy efficiency over the past decades have occurred not as a result of government regulation, but rather because of advances in technology and trade. A virtuous cycle of investment, innovation (including in greener technologies), and dynamic economic growth has flourished where governments have trusted market forces and competition to spur efficiency. (See Chart 7.)
Greater economic freedom can also provide more fertile ground for effective and democratic governance. Debate over the direction of causality between economic freedom and democracy has become more controversial in recent years because of the multifaceted interaction between the two. Undoubtedly, achieving greater political freedom through well-functioning democracy is a messy and often excruciatingprocess.
However, the positive relationship between economic freedom and democratic governance is undeniable. (See Chart 8.) By empowering people to exercise greater control of their daily lives, economic freedom ultimately nurtures political reform by making it possible for individuals to gain the economic resources necessary to challenge entrenched interests and compete for political power, thereby encouraging the creation of more pluralistic societies.
Pursuit of greater economic freedom is thus an important stepping-stone to democracy. It empowers the poor and builds the middle class. It is a philosophy that encourages entrepreneurship and disperses economic power and decision-making throughout society.
Economic Freedom: The Key to Upward Mobility and Greater Social Progress
The massive improvements in global indicators of income and quality of life largely reflect a paradigm shift in the debate over how societies should be structured to achieve the most optimal outcome. Over the past two decades, this debate has largely been won by capitalism. However, fears that the immediate benefits of capitalism are fading has brought to the forefront concerns about economic mobility and economicfreedom.
At the heart of ensuring upward economic mobility is the task of advancing economic freedom so that dynamic and inclusive growth can meaningfully occur for ordinary people in a free society. Milton and Rose Friedman made a keen observation on the critically intertwined relationship between freedom andmobility:
[S]o long as freedom is maintained, it prevents … positions of privilege from becoming institutionalized. Freedom means diversity, but also mobility. It preserves the opportunity for today’s disadvantaged to become tomorrow’s privileged and, in the process enables almost everyone, from top to bottom, to enjoy a fuller and richer life.1
Economic freedom is critical to generating the broader-based economic growth that brings more opportunities for a greater number of people to work, produce, and save. In other words, ensuring greater economic freedom is directly related to preserving and enhancing dynamic upward mobility.
Also notable is that although some naysayers claim that economic and social progress has been limited in recent years as incomes in some countries have become more unequal as a result of economic freedom, the evidence does not support this contention. Instead, societies based on economic freedom are the ones that have demonstrated the strongest social progress.
As shown in Chart 9, countries that largely embrace economic freedom provide the environments that are most conducive to social progress.2 Countries that improve their competitiveness and open their societies to new ideas, products, and innovations have largely achieved the high levels of social progress that their citizens demand. It is not massive redistributions of wealth or government dictates on income levels that produce the most positive social outcomes. Instead, mobility and progress require lower barriers to entry, freedom to engage with the world, and less government intrusion.
Staying on Course
The 21st edition of the Index of Economic Freedom shows economic freedom once again on the rise, reaching the highest point in the Index’s 21-year history. Behind this record are stories of human progress and the achievements of countries and their citizens—literally billions of people around the world whose lives have measurably improved.
It is no coincidence that the increase of economic liberty over the past decades has coincided with a massive reduction in worldwide poverty, disease, and hunger. The link between economic freedom and development is clear and strong. People in economically free societies live longer. They have better health. They are able to be better stewards of the environment, and they push forward the frontiers of human achievement in science and technology through greater innovation.
A recurring theme of human history has been resilience and revival. The country profiles in the 2015 Index of Economic Freedom include many examples of countries that have accelerated their economic and social progress in the face of difficult challenges and a sometimes harsh international environment. Their successes can be emulated by others. The Index of Economic Freedom charts not just one path to development, but as many as the ingenuity of humans can produce when they are free to experiment andinnovate.
The principles of economic freedom are a sure guide, but only a guide. What truly will matter are the creative solutions to pressing world problems that are certain to flow from people who are, in the words of Milton and Rose Friedman, “free to choose.”
1. Milton Friedman and Rose D. Friedman, Free to Choose: A Personal Statement (New York: Harcourt Brace Jovanovich, 1979).
2. The Social Progress Index defines social progress as the capacity of a society to meet the basic human needs of its citizens, establish the building blocks that allow citizens and communities to enhance and sustain the quality of their lives, and create the conditions for all individuals to reach their full potential.
http://www.heritage.org/index/book/chapter-2
Country Rankings
Free
Mostly Free
Moderately Free
Mostly Unfree
Repressed
Not Ranked
http://www.heritage.org/index/ranking
United States
RULE OF LAW
Property Rights80.0
Freedom From Corruption73.0
LIMITED GOVERNMENT
Government Spending51.8
Fiscal Freedom66.2
REGULATORY EFFICIENCY
Business Freedom88.8
Labor Freedom98.5
Monetary Freedom76.6
OPEN MARKETS
Trade Freedom87.0
Investment Freedom70.0
Financial Freedom70.0
Embed This Data
Create a Comparison Chart
See how United States compares to another country using any of the measures in the Index.
vs
Download PDF
QUICK FACTS
Embed This Data
The United States’ economic freedom score is 76.2, making its economy the 12th freest in the 2015 Index. Its score is 0.7 point higher than last year, with modest gains in six of the 10 economic freedoms, including control of government spending, outweighing a slight decline in business freedom.
Although the precipitous downward spiral in U.S. economic freedom since 2008 has come to a halt in the 2015 Index, a 1.6-point decline in overall economic freedom over the past five years reflects broad-based deteriorations in key policy areas, particularly those related to upholding the rule of law and limited government. Continuing to trail such comparable economies as Australia, New Zealand, Switzerland, and Canada, America has been ranked “mostly free” since 2010.
The anemic post-recession recovery has been characterized by slow growth, high unemployment, a decrease in the number of Americans seeking work, and great uncertainty that has held back investment. Increased tax and regulatory burdens, aggravated by favoritism toward entrenched interests, have undercut America’s historically dynamic entrepreneurial growth.
BACKGROUND
President Barack Obama’s second-term efforts to expand government spending and regulation have been thwarted to some extent by Republican Party opposition in Congress. Economic policy leadership has devolved by default to the Federal Reserve, whose attempts to use monetary policy to stimulate economic activity have not restored robust growth. Implementation of the 2010 health care law, which has reduced competition in most health insurance markets, remains a drag on job creation and full-time employment. Overall, the U.S. economy continues to underperform, despite a private sector–led energy boom that has made the U.S. the world’s largest producer of oil and natural gas. The weak economic recovery and uncertain responses to foreign policy challenges, particularly in the Middle East, in Ukraine, and along the southern U.S. border, have contributed to a loss of support for the President and his party and Republican majorities in both chambers of Congress as a result of 2014 midterm elections.
RULE OF LAWVIEW METHODOLOGY
Property Rights80.0Create a Graph using this measurement
Freedom From Corruption73.0Create a Graph using this measurement
Corruption in government and the political process remains a concern. High levels of government spending and the expansion and complexity of the government’s regulatory agenda have increased opportunities for political favoritism and cronyism. The judiciary functions independently. Protection of property rights has been uneven, with instances of regulatory overreach by the executive branch requiring court adjudication.
LIMITED GOVERNMENTVIEW METHODOLOGY
Government Spending51.8Create a Graph using this measurement
Fiscal Freedom66.2Create a Graph using this measurement
The top individual income tax rate is 39.6 percent, and the top corporate tax rate remains among the world’s highest at 35 percent. Other taxes include a capital gains tax and excise taxes. Tax revenue is equal to 24.3 percent of gross domestic product, and government spending is well over one-third of GDP. Public debt exceeds the value of the economy’s annual production.
REGULATORY EFFICIENCYVIEW METHODOLOGY
Business Freedom88.8Create a Graph using this measurement
Labor Freedom98.5Create a Graph using this measurement
Monetary Freedom76.6Create a Graph using this measurement
The regulatory burden has been mounting. Since 2009, over 150 new major regulations have been imposed at an annual cost of more than $70 billion. As of 2014, 125 new regulations were in the pipeline. The labor market, primarily regulated at the state level, remains flexible. Subsidies for agriculture, health care, and renewable energy have bred economic distortions.
OPEN MARKETSVIEW METHODOLOGY
Trade Freedom87.0Create a Graph using this measurement
Investment Freedom70.0Create a Graph using this measurement
Financial Freedom70.0Create a Graph using this measurement
The average tariff rate is 1.5 percent. Tariffs on clothing are high, sugar imports face tariff-rate quotas, and petroleum and liquefied natural gas exports are restricted. Foreign investment in some sectors is capped. The financial market is well developed, but the 2010 Dodd–Frank Act has instituted more federal regulation, socializing the cost of financial risk-taking and increasing the likelihood of future financial crises and bailouts
http://www.heritage.org/index/country/unitedstates
Listen To Pronk Pops Podcast or Download Show 480-487
Listen To Pronk Pops Podcast or Download Show 473-479
Listen To Pronk Pops Podcast or Download Show 464-472
Listen To Pronk Pops Podcast or Download Show 455-463
Listen To Pronk Pops Podcast or Download Show 447-454
Listen To Pronk Pops Podcast or Download Show 439-446
Listen To Pronk Pops Podcast or Download Show 431-438
Listen To Pronk Pops Podcast or Download Show 422-430
Listen To Pronk Pops Podcast or Download Show 414-421
Listen To Pronk Pops Podcast or Download Show 408-413
Listen To Pronk Pops Podcast or Download Show 400-407
Listen To Pronk Pops Podcast or Download Show 391-399
Listen To Pronk Pops Podcast or Download Show 383-390
Listen To Pronk Pops Podcast or Download Show 376-382
Listen To Pronk Pops Podcast or Download Show 369-375
Listen To Pronk Pops Podcast or Download Show 360-368
Listen To Pronk Pops Podcast or Download Show 354-359
Listen To Pronk Pops Podcast or Download Show 346-353
Listen To Pronk Pops Podcast or Download Show 338-345
Listen To Pronk Pops Podcast or Download Show 328-337
Listen To Pronk Pops Podcast or Download Show 319-327
Listen To Pronk Pops Podcast or Download Show 307-318
Listen To Pronk Pops Podcast or Download Show 296-306
Listen To Pronk Pops Podcast or Download Show 287-295
Listen To Pronk Pops Podcast or Download Show 277-286
Listen To Pronk Pops Podcast or Download Show 264-276
Listen To Pronk Pops Podcast or Download Show 250-263
Listen To Pronk Pops Podcast or Download Show 236-249
Listen To Pronk Pops Podcast or Download Show 222-235
Listen To Pronk Pops Podcast or Download Show 211-221
Listen To Pronk Pops Podcast or Download Show 202-210
Listen To Pronk Pops Podcast or Download Show 194-201
Listen To Pronk Pops Podcast or Download Show 184-193
Listen To Pronk Pops Podcast or Download Show 174-183
Listen To Pronk Pops Podcast or Download Show 165-173
Listen To Pronk Pops Podcast or Download Show 158-164
Listen To Pronk Pops Podcast or Download Show 151-157
Listen To Pronk Pops Podcast or Download Show 143-150
Listen To Pronk Pops Podcast or Download Show 135-142
Listen To Pronk Pops Podcast or Download Show 131-134
Listen To Pronk Pops Podcast or Download Show 124-130
Listen To Pronk Pops Podcast or Download Shows 121-123
Listen To Pronk Pops Podcast or Download Shows 118-120
Listen To Pronk Pops Podcast or Download Shows 113 -117
Listen To Pronk Pops Podcast or Download Show 112
Listen To Pronk Pops Podcast or Download Shows 108-111
Listen To Pronk Pops Podcast or Download Shows 106-108
Listen To Pronk Pops Podcast or Download Shows 104-105
Listen To Pronk Pops Podcast or Download Shows 101-103
Listen To Pronk Pops Podcast or Download Shows 98-100
Listen To Pronk Pops Podcast or Download Shows 94-97
Listen To Pronk Pops Podcast or Download Shows 93
Listen To Pronk Pops Podcast or Download Shows 92
Listen To Pronk Pops Podcast or Download Shows 91
Listen To Pronk Pops Podcast or Download Shows 88-90
Listen To Pronk Pops Podcast or Download Shows 84-87
Listen To Pronk Pops Podcast or Download Shows 79-83
Listen To Pronk Pops Podcast or Download Shows 74-78
Listen To Pronk Pops Podcast or Download Shows 71-73
Listen To Pronk Pops Podcast or Download Shows 68-70
Listen To Pronk Pops Podcast or Download Shows 65-67
Listen To Pronk Pops Podcast or Download Shows 62-64
Listen To Pronk Pops Podcast or Download Shows 58-61
Listen To Pronk Pops Podcast or Download Shows 55-57
Listen To Pronk Pops Podcast or Download Shows 52-54
Listen To Pronk Pops Podcast or Download Shows 49-51
Listen To Pronk Pops Podcast or Download Shows 45-48
Listen To Pronk Pops Podcast or Download Shows 41-44
Listen To Pronk Pops Podcast or Download Shows 38-40
Listen To Pronk Pops Podcast or Download Shows 34-37
Listen To Pronk Pops Podcast or Download Shows 30-33
Listen To Pronk Pops Podcast or Download Shows 27-29
Listen To Pronk Pops Podcast or Download Shows 17-26
Listen To Pronk Pops Podcast or Download Shows 16-22
Listen To Pronk Pops Podcast or Download Shows 10-15
Listen To Pronk Pops Podcast or Download Shows 01-09
Read Full Post | Make a Comment ( None so far )