* The U.S. Constitution vests Congress with the powers to tax, spend, and pay the debts of the federal government. Legislation to carry out these functions must either be:
- passed by majorities in both houses of Congress and approved by the President; or
- passed by majorities in both houses of Congress, vetoed by the President, and then passed by two-thirds of both houses of Congress; or
- passed by majorities in both houses of Congress and left unaddressed by the President for ten days.
* Other factors impacting the national debt include but are not limited to legislation passed by previous congresses and presidents, economic cycles, terrorist attacks, natural disasters, demographics, and the actions of U.S. citizens and foreign governments.
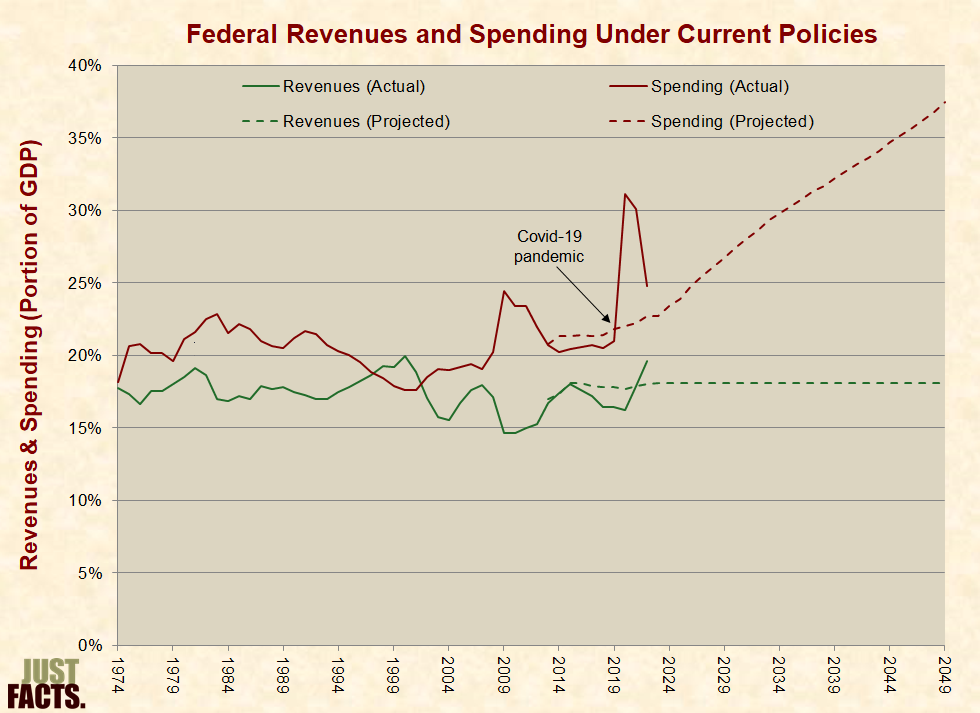
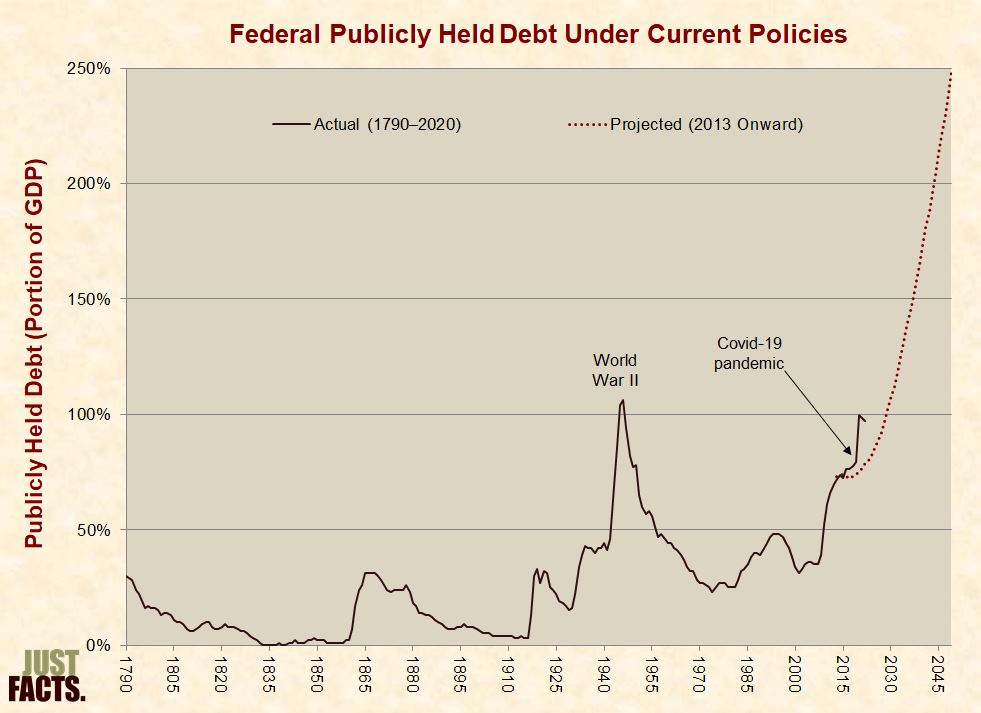
* In 2014, the Congressional Budget Office (CBO) projected the debt that the U.S. government would accumulate under current federal policies. The projection used the following assumptions:
- Unemployment will incrementally decline from 6.8% in 2014 to 5.8% in 2018 and 5.3% in 2027, where it will remain thereafter. (For reference, the average of the previous 40 years is 6.5%.)
- GDP growth will incrementally decline from an average rate of 3.4% above the rate of inflation in 2015 to 1.9% in 2021 and remain constant thereafter. (The average of the previous 40 years is 2.9%.)
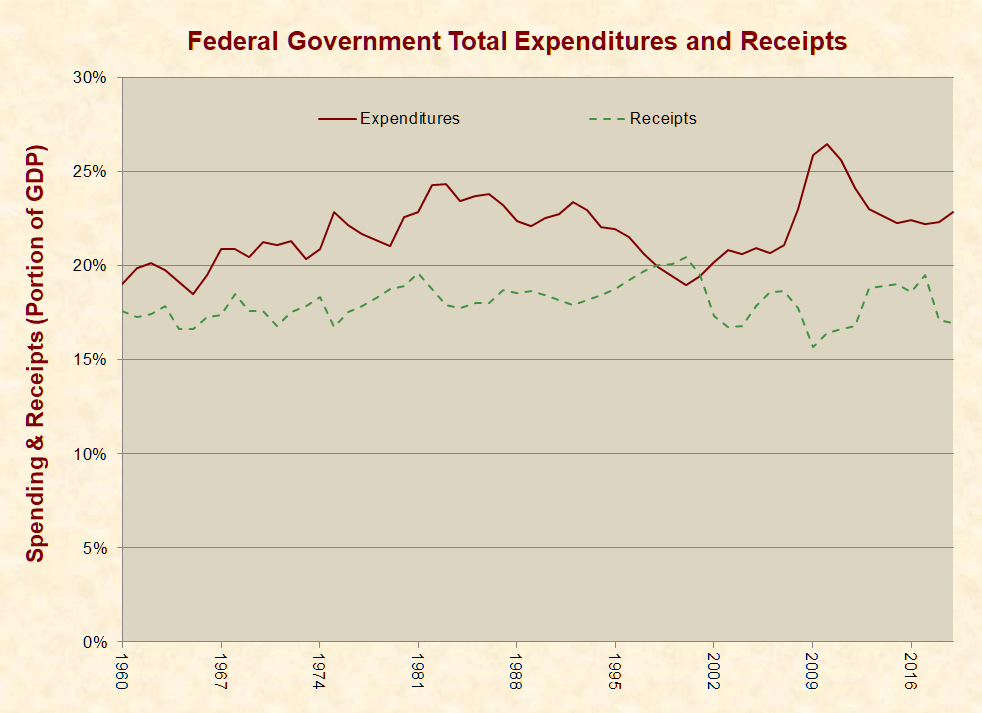
- Federal revenues (i.e., taxes) will incrementally increase from 17.4% of GDP in 2014 to 18.0% in 2024 and remain constant thereafter. (The average of the previous 40 years is 17.4%.)
- Federal spending will incrementally increase from 20.4% of GDP in 2014 to 23.6% in 2025 and 31.8% in 2040. (The average of the previous 40 years is 20.5%.)
- Payments for Medicare services will undergo scheduled reductions that would likely cause “severe problems with beneficiary access to care.”
* Combining these projections with historical data yields the following results:
† To measure the entirety of the national debt, it would be preferable to show “gross” debt instead of “publicly held” debt, but this data is not presented in this report. Nonetheless, it would make little difference because the excluded debt primarily resides in federal government trust funds that dwindle and become insolvent during the projection period. Facts regarding why and how the federal government keeps its books in this manner are covered in the section of this research entitled “Government Accounting.”
|
* Per CBO, postponing action to stabilize the debt will:
- punish younger generations of Americans, because most of the burden would fall on them.
- reward older generations of Americans, because “they would partly or entirely avoid the policy changes needed to stabilize the debt.”
- “substantially increase the size of the policy adjustments needed to put the budget on a sustainable course.”
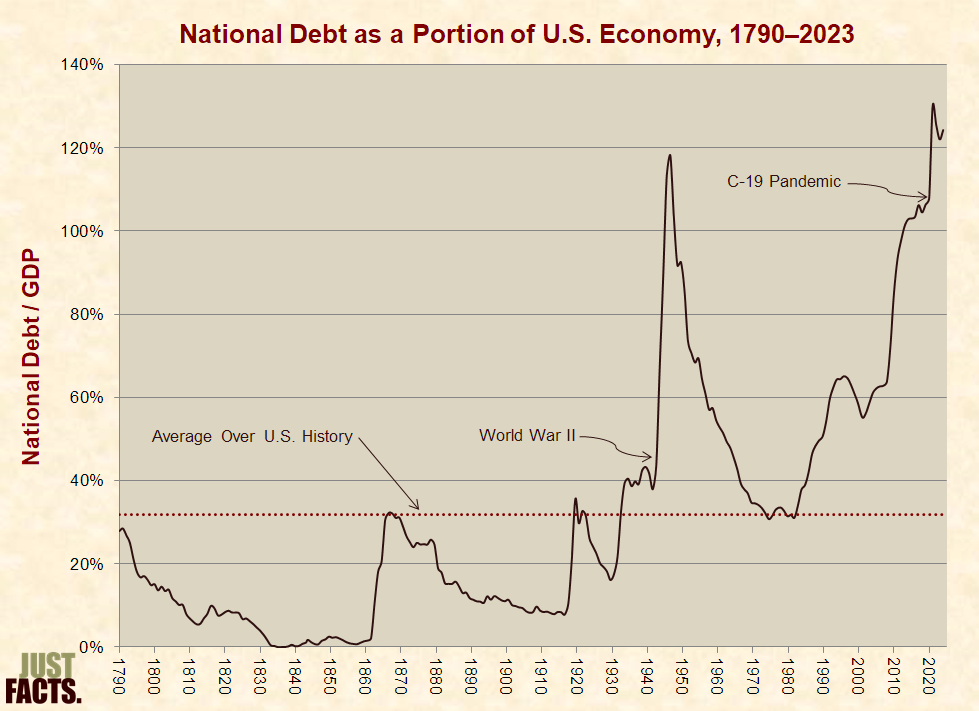
* The following Ph.D. economists and political scientists have claimed that the level of national debt during World War II is a good reason to not be overly concerned about the modern national debt:
- Paul Davidson, editor of the Journal of Post Keynesian Economics and author of The Keynes Solution: The Path to Global Economic Prosperity:
Rather than bankrupting the nation, this large growth in the national debt [during World War II] promoted a prosperous economy. By 1946, the average American household was living much better economically than in the prewar days. Moreover, the children of that Depression–World War II generation were not burdened by having to pay off what then was considered a huge national debt. Instead, for the next quarter century, the economy continued on a path of unprecedented economic growth and prosperity….
- Douglas J. Amy, professor of politics at Mount Holyoke College:
Conservatives are also wrong when they argue that deficit spending and a large national debt will inevitably undermine economic growth. To see why, we need to simply look back at times when we have run up large deficits and increased the national debt. The best example is World War II when the national debt soared to 120% of GDP—nearly twice the size of today’s debt. This spending not only got us out of the Great Depression but set the stage for a prolonged period of sustained economic growth in the 50s and 60s.
- Paul Krugman, Nobel Prize-winning economist and Princeton University professor:
Right now, federal debt is about 50% of GDP. So even if we do run these deficits, federal debt as a share of GDP will be substantially less than it was at the end of World War II.
Again, the debt outlook is bad. But we’re not looking at something inconceivable, impossible to deal with; we’re looking at debt levels that a number of advanced countries, the U.S. included, have had in the past, and dealt with.
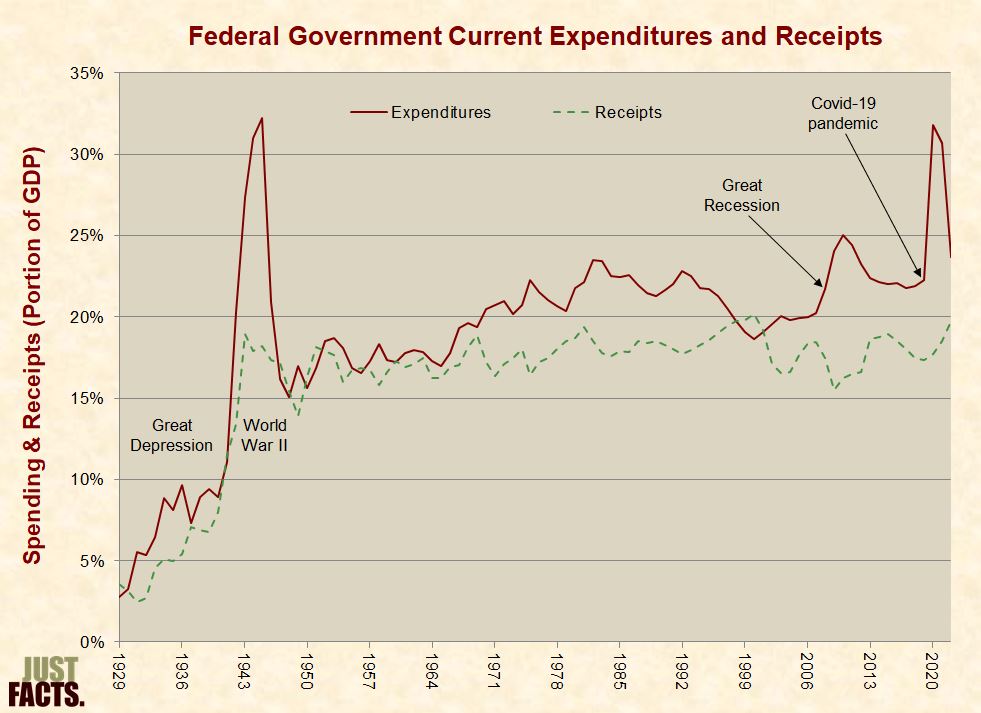
* In the 40 years that followed the end of World War II (1946–1985):
- federal spending as a percent of GDP averaged 42% lower than the last year of the war.
- publicly held debt as a percent of GDP decreased by 72 percentage points.
* In 2010, around the time when the statements above were written, the Congressional Budget Office projected that under current policy and a sustained economic recovery over the next 40 years:
- federal spending as a percent of GDP will average over 78% higher than in the four decades that followed World War II.
- publicly held debt as a percent of GDP will rise by 277 percentage points.
* As alternatives to the CBO’s current policy projections detailed above, the CBO also ran projections for scenarios such as these:
1) Current law:
- Federal revenues will incrementally increase from 17.6% of GDP in 2014 to 18.0% in 2020, 19.9% in 2044, and 23.5% in 2084. At this point, federal revenues (i.e., taxes) will be 35% higher than the average of the previous 40 years.
- Federal spending on all government functions will incrementally increase from 20.4% of GDP in 2014 to 21.5% in 2020, and 26.0% in 2040. At this point, spending will be 27% higher than the average of the previous 40 years.
- Payments for Medicare services will undergo reductions that will likely cause “severe problems with beneficiary access to care.”
2) Republican Congressman Paul Ryan’s 2014 budget resolution, called the “The Path to Prosperity”:
- Starting in 2024, Medicare beneficiaries will have a choice to enroll in private plans paid for by Medicare or remain in the traditional Medicare program. Also starting in 2024, the eligibility age for Medicare benefits will incrementally rise to correspond with Social Security’s retirement age. Compared to the projections under the current policy scenario, Medicare spending will be 0.5% lower in 2016, 2% lower in 2020, and 4% lower in 2024.
- Federal Medicaid spending will be converted to an “allotment that each state could tailor to meet its needs, indexed for inflation and population growth.” The expansion of Medicaid manadated by the Affordable Care Act (a.k.a. Obamacare) will be repealed. Compared to the projections under the current policy scenario, Medicaid spending will be 9% lower in 2016, 19% lower in 2020, and 24% lower in 2024.
- All federal spending related to Obamacare’s exchange subsidies will be repealed.
- Spending on all government functions except for interest payments on the national debt will incrementally decline from 18.9% of GDP in 2015 to 16% in 2025 before increasing to 16.4% in 2035. (The average of the previous 40 years is 18.3%).
- Revenues will increase from 18.2% of GDP in 2015 to 18.4% in 2025, 19% in 2032 and stay constant thereafter. (The average of the previous 40 years is 17.4%.)
* Combining historical data on the national debt with CBO’s projections for current policy, current law, and the Ryan plan yields the following results:
* A poll conducted by NBC News and the Wall Street Journal in February 2011 found that:
- 80% of Americans are concerned “a great deal” or “quite a bit” about federal budget deficits and the national debt.
- if the deficit cannot be eliminated by cutting wasteful spending, 35% of Americans prefer to cut important programs while 33% prefer to raise taxes.
- 22% think cuts in Social Security spending will be needed to “significantly reduce the federal budget deficit,” 49% do not, and 29% have no opinion or are not sure.
- 18% think cuts in Medicare spending will be needed to “significantly reduce the federal budget deficit,” 54% do not, and 28% have no opinion or are not sure.
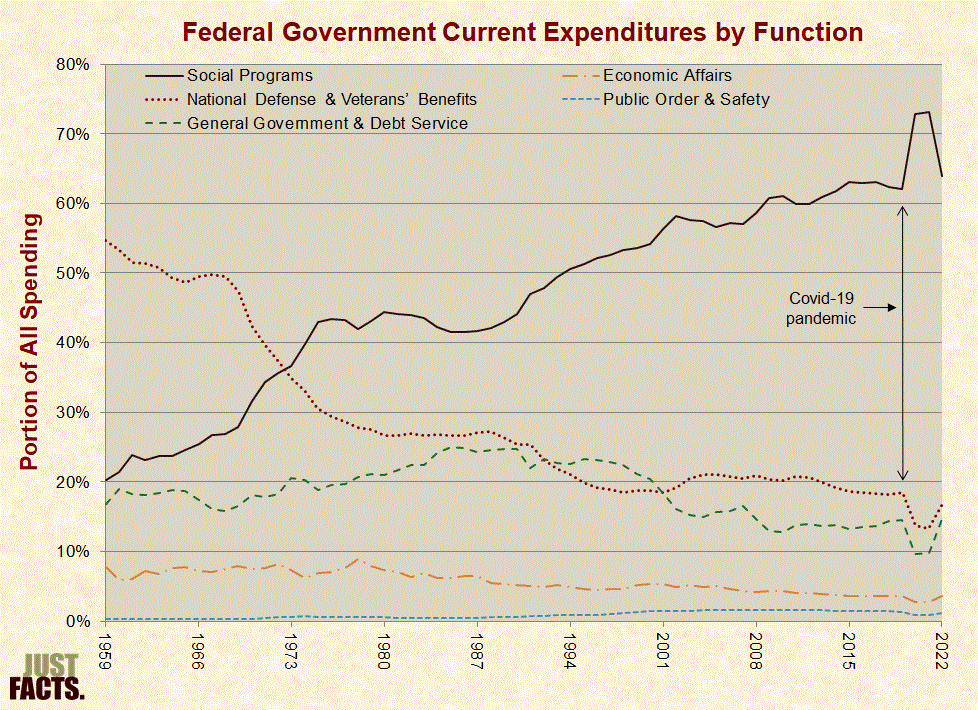
* Other than interest on the national debt, most of the long-term growth in federal spending (as a percent of GDP) under the CBO’s current policy and current law scenarios stems from Social Security, Medicare, Medicaid, the Children’s Health Insurance Program, and Affordable Care Act (a.k.a. Obamacare) subsidies.
* A poll conducted in November 2010 by the Associated Press and CNBC found that:
- 85% of Americans are worried that the national debt “will harm future generations.”
- 56% think “the shortfalls will spark a major economic crisis in the coming decade.”
- when asked to choose between two options to balance the budget, 59% prefer to cut unspecified government services, while 30% prefer to raise unspecified taxes.
* A poll conducted in July 2005 by the Associated Press and Ipsos found that:
- 70% of Americans were worried about the size of the federal deficit.
- 35% were willing to cut government spending.
- 18% were willing to raise taxes.
- 1% were willing to cut government spending and raise taxes.
* During the first session of the 113th Congress (January–December 2013), U.S. Representatives and Senators introduced 168 bills that would have reduced spending and 828 bills that would have raised spending.
* The table below quantifies the costs and savings of these bills by political party. This data is provided by the National Taxpayers Union Foundation:
* Click here to look up any member of Congress and see the annual costs or savings from the legislation he or she has sponsored or cosponsored.
* The table below quantifies the net agendas of the political parties in previous Congresses:
* In February 2001, Republican President George W. Bush stated:
Many of you have talked about the need to pay down our national debt. I listened, and I agree. We owe it to our children and grandchildren to act now, and I hope you will join me to pay down $2 trillion in debt during the next 10 years. At the end of those 10 years, we will have paid down all the debt that is available to retire. That is more debt, repaid more quickly than has ever been repaid by any nation at any time in history.
* From the time that Congress enacted Bush’s first major economic proposal (June 7, 2001) until the time that he left office (January 20, 2009), the national debt rose from 53% of GDP to 74%, or an average of 2.7 percentage points per year.
* During eight years in office, President Bush vetoed 12 bills, four of which were overridden by Congress and thus enacted without his approval. These bills were projected by the Congressional Budget Office to increase the deficit by $26 billion during 2008–2022.
* In February 2009, Democratic President Barack Obama stated:
I refuse to leave our children with a debt that they cannot repay—and that means taking responsibility right now, in this administration, for getting our spending under control.
* From the time that Congress enacted Obama’s first major economic proposal (February 17, 2009) until September 30, 2016, the national debt rose from 74% of GDP to 105%, or an average of 4.0 percentage points per year.
* As of November 4, 2016, President Obama has vetoed twelve bills, one of which has been overridden by Congress and thus enacted without his approval. This bill is projected by the Congressional Budget Office to “have no significant effect on the federal budget.”