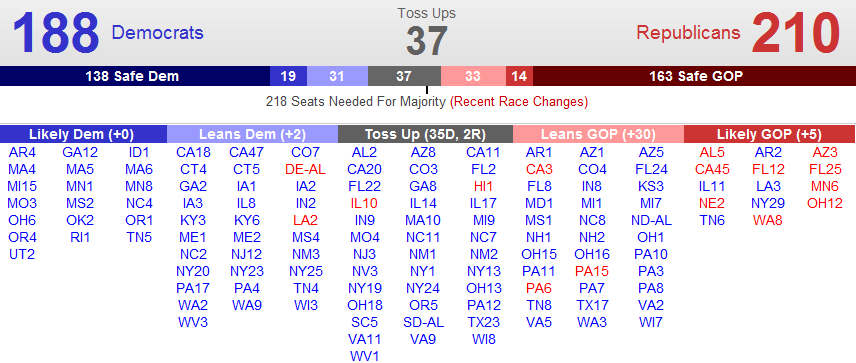
American People’s No Confidence Voting Wave Wipes Out Democrats–It’s The Economy Stupid!–Videos
Republican Governors 35
Republican Senators 51
Republican Representatives 255

The Republicans will pickup a net total of 77 seats in House of Representatives for a total of 255.
The Republicans will also pickup a net total of 10 seats in the Senate for a total of 51 seats.
The American people want to stop the massive Government spending, deficits and bailouts and rising National debt of the Obama Administration.
Stop Spending Our Future – The Crisis
Issue number 1 is jobs and the economy with nearly thirty million Americans looking for a full-time job and continuing high rates of unemployment.

Issue number 2 is massive Federal Government spending, deficits, bailouts and a rising National debt.
The National Debt Road Trip
The Trillion $$$ Dollar U.S. Economic Deficit Caused By Our Government

U.S. Debt Clock
Issue number 3 is Obamacare– the American people want it repealed as soon as possible and no money bills or appropriations to fund Obamacare.
Fight Obamacare Texas
Issue number 4 is illegal immigration–the American people want it stopped by immigration law enforcement and a completed border fence that is heavily patrolled.
What Are True Costs And Benefits Of Illegal Immigration?
Stop Illegal Immigration
The American people expect the Republican Party to balance the Federal Budget by significantly reducing Government spending and permanently closing Federal Departments including Agriculture, Commerce, Education, Energy, Health and Human Services, Housing and Urban Renewal, Interior, Labor, and Transportation.
The number of Federal employees should be cut from over 2,000,000 to less than 1,000,000.
3 Reasons Public Sector Employees are Killing the Economy
 The American people expect the Republican Party to make the Bush tax cuts permanent for all taxpayers and pass the FairTax–it is time!
The FairTax: It’s Time
Should the Republican Party fail to balance the budget and cut the size and scope of the Federal Government by permanently shutting down the above departments, these Republicans will be wiped out by the 2012 wave of tea party patriots.

Background Articles and Videos
Editor in Chief Insights: Obama’s Job Approval Trajectory
President Obama Heads into Midterms at Lowest Approval Rating of Presidency
Two-thirds of Americans believe country going off on the wrong track
“…Currently, two-thirds of Americans (67%) have a negative opinion of the job President Obama is doing while just over one-third (37%) have a positive opinion. This continues the president’s downward trend and he is now at the lowest job approval rating of his presidency.
These are some of the results of The Harris Poll of 3,084 adults surveyed online between October 11 and 18, 2010 by Harris Interactive.
It’s perhaps not surprising that nine in ten Republicans (90%) and Conservatives (89%) give the job the president is doing negative ratings. What may be surprising is that one-third of Democrats (34%) and Liberals (33%) also give him negative ratings, as do seven in ten Independents (70%) and six in ten Moderates (60%).
Americans who give the president the highest positive ratings are those with a post-graduate education (48%), a college education (47%), and those living in the West (42%). On the other end of the spectrum, almost three-quarters of those with a high school education or less (72%) and two-thirds of Midwesterners (66%) and Southerners (66%) give the President negative marks on his overall job.
While the president is at a low point, there is a political body with ratings much lower than his. Just one in ten Americans (11%) give Congress positive ratings on the job they are doing while nine in ten (89%) give them negative marks. While Congress may be under Democratic control, even four in five Democrats (81%) give them negative ratings.
Part of this negativity may have to do with the way Americans believe the country as a whole is going. Just one-third of U.S. adults (34%) say the country is going in the right direction while two-thirds (66%) say it is going off on the wrong track. While not close to the low it was before the 2008 election (11% said things were going in the right direction), this is one of the lower points of this year. …”
http://www.harrisinteractive.com/Hi_assets/TopHitPageNews.html
Rasmussen Reports
Trust on Issues
Voters Trust Republicans More on Eight of 10 Key Issues
“…Voters now trust Democrats over Republicans in only two areas – government ethics and corruption by a 41% to 36% margin and education where Democrats have a slight 42% to 40% edge.
The economy continues to be the most important issue on voters’ minds this election, and 49% place their trust in Republicans to handle this issue. Thirty-nine percent (39%) trust Democrats more. These findings show little change from early June 2009.
On the issue of health care, which voters place second on the list of important issues, Republicans hold a modest 47% to 40% advantage. Democrats were trusted more on this issue until the debate over a proposed national health care bill began to heat up in early September of last year.
Most voters continue to favor repeal of the national health care law, but the number of voters who expect the law to increase the deficit has fallen to the lowest point since its passage by Congress in March.
(Want a free daily e-mail update? If it’s in the news, it’s in our polls). Rasmussen Reports updates are also available on Twitter or Facebook.
Two surveys of 1,000 Likely U.S. Voters each were conducted October 12-13 and October 14-15, 2010 by Rasmussen Reports. The margin of sampling error is +/- 3 percentage points with a 95% level of confidence. Field work for all Rasmussen Reports surveys is conducted by Pulse Opinion Research, LLC. See methodology.
Government ethics and corruption rate number three in terms of overall importance, but voters have been narrowly divided for the past several months over which party to trust more on this issue. Democrats have held small leads since February.
As for education, both parties have held very modest leads on the issue at different times for months now.
Forty-eight percent (48%) of voters nationwide place their trust in the hands of Republicans when it comes to the issue of taxes. Thirty-nine percent (39%) would rather the Democrats handle this issue. The GOP has held a solid lead over Democrats on this issue since early July 2009.
But most voters believe that Democrats in Congress want to raise taxes and spending, while Republicans in Congress want to cut taxes and spending.
When it comes to immigration, 45% trust Republicans, while 33% trust the Democrats more. The gap between the two parties has widened since the beginning of January as the debate over the immigration law in Arizona intensified. At the beginning of the year, voters were essentially evenly divided on which party to trust.
Voters feel more strongly than ever that the federal government is encouraging illegal immigration and that states like Arizona have the answer to the problem, but the Obama administration is challenging the Arizona law in federal court.
Republicans continue to be trusted more on national security issues and the war on terror, with 49% of voters trusting the GOP versus 39% who trust the Democrats more. When it comes the war in Afghanistan, Republicans hold a six-point advantage, 42% to 36%.
Similarly, voters trust Republicans more than Democrats to handle the war in Iraq, 43% to 37%. …”
http://www.rasmussenreports.com/public_content/politics/mood_of_america/trust_on_issues
Historical Federal Workforce Tables
Executive Branch Civilian Employment Since 1940
(end-of-fiscal-year count, excluding Postal Service, in thousands)
| Fiscal Year | Total Executive Branch | Department of Defense | Civilian Agencies | |||||||||
|---|---|---|---|---|---|---|---|---|---|---|---|---|
| Total | Agriculture | HHS, Education, Social Sec. 1 | Homeland Security | Interior | Justice | Transportation | Treasury | Veterans | Other | |||
| 1940 | 699 | 256 | 443 | 98 | 9 | 18 | 46 | 11 | … | 45 | 40 | 176 |
| 1941 | 1,081 | 556 | 525 | 91 | 10 | 20 | 50 | 15 | … | 52 | 43 | 244 |
| 1942 | 1,934 | 1,291 | 643 | 95 | 11 | 20 | 49 | 22 | … | 55 | 44 | 348 |
| 1943 | 2,935 | 2,200 | 735 | 109 | 11 | 21 | 43 | 23 | … | 69 | 53 | 406 |
| 1944 | 2,930 | 2,246 | 683 | 78 | 11 | 21 | 42 | 21 | … | 81 | 51 | 378 |
| 1945 | 3,370 | 2,635 | 736 | 82 | 11 | 20 | 45 | 19 | … | 84 | 65 | 409 |
| 1946 | 2,212 | 1,416 | 795 | 97 | 12 | 20 | 51 | 17 | … | 95 | 169 | 335 |
| 1947 | 1,637 | 859 | 777 | 88 | 12 | 20 | 53 | 17 | … | 82 | 217 | 288 |
| 1948 | 1,569 | 871 | 698 | 82 | 13 | 18 | 57 | 20 | … | 79 | 196 | 233 |
| 1949 | 1,573 | 880 | 694 | 87 | 12 | 19 | 59 | 19 | … | 77 | 195 | 226 |
| 1950 | 1,439 | 753 | 686 | 84 | 13 | 20 | 66 | 20 | … | 76 | 188 | 219 |
| 1951 | 1,974 | 1,235 | 738 | 81 | 16 | 21 | 65 | 25 | … | 79 | 183 | 269 |
| 1952 | 2,066 | 1,337 | 729 | 79 | 15 | 22 | 61 | 25 | … | 75 | 175 | 278 |
| 1953 | 2,026 | 1,332 | 694 | 78 | 35 | 22 | 59 | 23 | … | 71 | 178 | 226 |
| 1954 | 1,875 | 1,209 | 666 | 76 | 35 | 21 | 56 | 24 | … | 67 | 179 | 207 |
| 1955 | 1,860 | 1,187 | 673 | 86 | 40 | 21 | 54 | 24 | … | 65 | 178 | 206 |
| 1956 | 1,864 | 1,180 | 684 | 89 | 46 | 20 | 53 | 24 | … | 64 | 177 | 210 |
| 1957 | 1,869 | 1,161 | 708 | 96 | 53 | 20 | 55 | 24 | … | 65 | 174 | 222 |
| 1958 | 1,817 | 1,097 | 720 | 101 | 55 | 20 | 56 | 24 | … | 64 | 172 | 227 |
| 1959 | 1,805 | 1,078 | 727 | 97 | 59 | 20 | 55 | 23 | … | 63 | 171 | 238 |
| 1960 | 1,808 | 1,047 | 761 | 99 | 62 | 21 | 56 | 24 | … | 62 | 172 | 265 |
| 1961 | 1,825 | 1,042 | 782 | 103 | 70 | 20 | 59 | 25 | … | 67 | 175 | 265 |
| 1962 | 1,896 | 1,070 | 827 | 111 | 77 | 20 | 63 | 25 | … | 69 | 177 | 284 |
| 1963 | 1,911 | 1,050 | 861 | 116 | 81 | 21 | 73 | 25 | … | 73 | 173 | 300 |
| 1964 | 1,884 | 1,030 | 855 | 108 | 83 | 21 | 70 | 26 | … | 72 | 172 | 302 |
| 1965 | 1,901 | 1,034 | 867 | 113 | 87 | 21 | 71 | 27 | … | 74 | 167 | 307 |
| 1966 | 2,051 | 1,138 | 913 | 119 | 100 | 21 | 75 | 27 | … | 76 | 170 | 324 |
| 1967 | 2,251 | 1,303 | 949 | 122 | 106 | 24 | 77 | 27 | 52 | 79 | 173 | 289 |
| 1968 | 2,289 | 1,317 | 972 | 123 | 117 | 23 | 78 | 29 | 56 | 79 | 176 | 292 |
| 1969 | 2,301 | 1,342 | 960 | 125 | 113 | 21 | 75 | 30 | 58 | 79 | 175 | 283 |
| 1970 | 2,203 | 1,219 | 983 | 118 | 112 | 23 | 75 | 33 | 62 | 84 | 169 | 308 |
| 1971 | 2,144 | 1,154 | 989 | 120 | 115 | 25 | 72 | 38 | 66 | 86 | 180 | 288 |
| 1972 | 2,117 | 1,108 | 1,009 | 118 | 114 | 29 | 72 | 40 | 65 | 90 | 184 | 295 |
| 1973 | 2,083 | 1,053 | 1,030 | 113 | 128 | 29 | 74 | 43 | 66 | 90 | 198 | 289 |
| 1974 | 2,140 | 1,070 | 1,070 | 116 | 142 | 30 | 77 | 46 | 68 | 97 | 202 | 292 |
| 1975 | 2,149 | 1,042 | 1,107 | 121 | 147 | 31 | 80 | 47 | 69 | 101 | 213 | 297 |
| 1976 | 2,157 | 1,010 | 1,147 | 128 | 155 | 32 | 82 | 48 | 71 | 105 | 222 | 303 |
| 1977 | 2,182 | 1,009 | 1,173 | 132 | 159 | 32 | 87 | 48 | 70 | 107 | 224 | 313 |
| 1978 | 2,224 | 1,000 | 1,225 | 138 | 161 | 37 | 84 | 49 | 70 | 110 | 229 | 348 |
| 1979 | 2,161 | 960 | 1,201 | 128 | 161 | 40 | 78 | 48 | 67 | 102 | 226 | 352 |
| 1980 | 2,161 | 960 | 1,201 | 129 | 163 | 40 | 77 | 48 | 66 | 102 | 228 | 346 |
| 1981 | 2,143 | 984 | 1,159 | 129 | 162 | 38 | 76 | 47 | 54 | 100 | 232 | 321 |
| 1982 | 2,110 | 990 | 1,121 | 121 | 153 | 38 | 79 | 48 | 57 | 98 | 236 | 291 |
| 1983 | 2,157 | 1,026 | 1,131 | 124 | 152 | 39 | 80 | 50 | 57 | 104 | 239 | 286 |
| 1984 | 2,171 | 1,044 | 1,127 | 119 | 150 | 39 | 79 | 53 | 57 | 109 | 240 | 283 |
| 1985 | 2,252 | 1,107 | 1,145 | 122 | 147 | 40 | 80 | 55 | 56 | 110 | 247 | 286 |
| 1986 | 2,175 | 1,068 | 1,108 | 113 | 138 | 39 | 74 | 56 | 56 | 114 | 240 | 277 |
| 1987 | 2,232 | 1,090 | 1,142 | 117 | 132 | 44 | 74 | 60 | 57 | 125 | 250 | 284 |
| 1988 | 2,222 | 1,050 | 1,172 | 121 | 128 | 48 | 78 | 63 | 58 | 135 | 245 | 297 |
| 1989 | 2,238 | 1,075 | 1,162 | 122 | 127 | 49 | 78 | 66 | 60 | 126 | 246 | 289 |
| 1990 | 2,250 | 1,034 | 1,216 | 123 | 129 | 49 | 78 | 71 | 61 | 132 | 248 | 326 |
| 1991 | 2,243 | 1,013 | 1,230 | 126 | 135 | 50 | 82 | 77 | 64 | 139 | 256 | 302 |
| 1992 | 2,225 | 952 | 1,274 | 128 | 136 | 56 | 85 | 82 | 64 | 133 | 260 | 329 |
| 1993 | 2,157 | 891 | 1,266 | 124 | 135 | 56 | 85 | 82 | 63 | 127 | 268 | 326 |
| 1994 | 2,085 | 850 | 1,235 | 120 | 133 | 55 | 81 | 83 | 59 | 128 | 262 | 315 |
| 1995 | 2,012 | 802 | 1,210 | 113 | 132 | 56 | 76 | 87 | 58 | 128 | 264 | 297 |
| 1996 | 1,934 | 768 | 1,166 | 110 | 130 | 62 | 71 | 88 | 58 | 118 | 251 | 279 |
| 1997 | 1,872 | 723 | 1,149 | 107 | 131 | 64 | 71 | 93 | 59 | 112 | 243 | 270 |
| 1998 | 1,856 | 693 | 1,163 | 106 | 130 | 68 | 72 | 95 | 59 | 112 | 240 | 281 |
| 1999 | 1,820 | 666 | 1,155 | 105 | 130 | 69 | 73 | 97 | 58 | 113 | 219 | 290 |
| 2000 | 1,778 | 651 | 1,127 | 104 | 126 | 70 | 74 | 98 | 58 | 113 | 220 | 265 |
| 2001 | 1,792 | 647 | 1,145 | 109 | 129 | 73 | 76 | 99 | 59 | 117 | 226 | 258 |
| 2002 | 1,818 | 645 | 1,173 | 98 | 130 | 76 | 77 | 96 | 96 | 118 | 223 | 258 |
| 2003 | 1,867 | 636 | 1,231 | 100 | 131 | 153 | 72 | 102 | 58 | 132 | 226 | 257 |
| 2004 | 1,882 | 644 | 1,238 | 111 | 130 | 153 | 77 | 104 | 57 | 111 | 236 | 257 |
| 2005 | 1,872 | 649 | 1,224 | 108 | 131 | 147 | 76 | 105 | 56 | 108 | 235 | 258 |
| 2006 | 1,880 | 653 | 1,227 | 105 | 129 | 154 | 72 | 107 | 54 | 107 | 239 | 260 |
| 2007 | 1,888 | 651 | 1,237 | 103 | 129 | 159 | 72 | 107 | 54 | 104 | 254 | 254 |
| 2008 | 1,960 | 670 | 1,289 | 104 | 132 | 172 | 76 | 109 | 55 | 106 | 274 | 261 |
| 2009 | 2,094 | 737 | 1,357 | 104 | 139 | 180 | 75 | 113 | 57 | 109 | 297 | 283 |
http://www.opm.gov/feddata/HistoricalTables/ExecutiveBranchSince1940.asp

You must be logged in to post a comment.