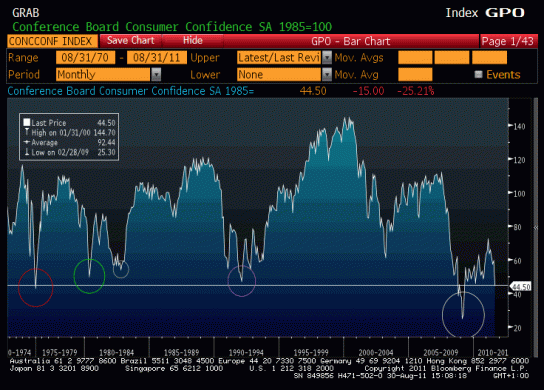
The Conference Board’s Consumer Confidence Index Craters: 59.2 In July To 44.5 In August–Lowest Since April 2009!
http://raymond-pronk65892.podomatic.com/swf/joeplayer_v18c.swf
http://econintersect.com/wordpress/?p=12471
The Conference Board Reported Consumer Confidence Fell In August
“…The Conference Board reported that consumer confidence fell in August as expectations dived, and as views on future business conditions worsened, as well as jobs and income.
The organization’s consumer-confidence index fell to 44.5 in August, which is the lowest level since April 2009, from a slightly downwardly revised 59.2 in July. Economists had expected an August reading of 51.9.
According to the director of Consumer Board’s consumer research center, Lynn Franco, “A contributing factor may have been the debt ceiling discussions since the decline in confidence was well underway before the S&P
downgrade.” …”
Spector Says Consumer Confidence Reflects Leadership
Aug. 30 (Bloomberg) — Jonathan Spector, chief executive officer of the Conference Board, talks about the group’s consumer confidence survey for August and the outlook for the U.S. economy. The Conference Board’s index slumped to 44.5, the weakest since April 2009, from a revised 59.2 reading in July. Spector speaks with Matt Miller on Bloomberg Television’s “Street Smart.” (Source: Bloomberg)
Consumer Confidence Lowest in 2 Years
Morning Market Alert for August 30, 2011
August 12th 2011 CNBC Stock Market Squawk on the Street (Consumer Sentiment)
“…Retail sales may be solid but you’d never know it judging by consumer sentiment. The Reuters/University of Michigan index fell nearly nine
points to 54.9 which is just below levels during the worst of the 2008 meltdown. This is nearly a record low, next only to the Iranian hostage
crisis and oil embargo of the late 70s and early 80s. The expectations component, which is the leading component, fell more than 10 points to
45.7, again very severely depressed and near a record low. The current conditions component fell less severely, down more than six points to
69.3.
The debt-ceiling crisis and wild movements in the financial markets are very clearly not helping the consumer’s faith in the economic outlook. Hopefully, the extension of the ceiling and recent rallies for the Dow will give a boost to this report’s month-end readings. One positive is that inflation is not a risk to the outlook with one-year expectations steady for the last month at 3.4 percent with the five-year even more firmly steady at 2.9 percent. Stocks are coming off opening gains in reaction to today’s report. …”
The Conference Board Consumer Confidence Index® Declines
“… The Conference Board Consumer Confidence Index®, which had improved slightly in July, plummeted in August. The Index now stands at 44.5 (1985=100), down from 59.2 in July. The Present Situation Index decreased to 33.3 from 35.7. The Expectations Index decreased to 51.9 from 74.9 last month.
The monthly Consumer Confidence Survey®, based on a probability-design random sample, is conducted for The
Conference Board by The Nielsen Company, a leading global provider of information and analytics around what consumers buy and watch. The cutoff date for the preliminary results was August 18th.
Says Lynn Franco, Director of The Conference Board Consumer Research Center: “Consumer confidence deteriorated sharply in August, as consumers grew significantly more pessimistic about the short-term outlook. The index is now at its lowest level in more than two years (April 2009, 40.8). A contributing factor may have been the debt ceiling discussions since the decline in confidence was well underway before the S&P downgrade. Consumers’ assessment of current conditions, on the other hand, posted only a modest decline as employment conditions continue to suppress confidence.”
Consumers’ appraisal of present-day conditions weakened further in August. Consumers claiming business conditions are “bad” increased to 40.6 percent from 38.7 percent, while those claiming business conditions are “good” inched up to 13.7 percent from 13.5 percent. Consumers’ assessment of employment conditions was more pessimistic than last month. Those claiming jobs are “hard to get” increased to 49.1 percent from 44.8 percent, while those stating jobs are “plentiful” declined to 4.7 percent from 5.1 percent.
Consumers’ short-term outlook deteriorated sharply in August. Those expecting business conditions to improve over the next six months decreased to 11.8 percent from 17.9 percent, while those expecting business conditions to worsen surged to 24.6 percent from 16.1 percent. Consumers were also more pessimistic about the outlook for the job market. Those anticipating more jobs in the months ahead decreased to 11.4 percent from 16.9 percent, while those expecting fewer jobs increased to 31.5
percent from 22.2 percent. The proportion of consumers anticipating an increase in their incomes declined to 14.3 percent from 15.9 percent.
http://www.conference-board.org/data/consumerconfidence.cfm
U.S. Consumer Confidence Index (CCI
The U.S. Consumer Confidence Index (CCI) is an indicator designed to measure consumer confidence, which is defined as the degree of optimism on the state of the economy that consumers are expressing through their activities of savings and spending. Global consumer confidence is not measured. Country by country analysis indicates huge variance around the globe. In an interconnected global economy, tracking international consumer confidence is a lead indicator of economic trends.[1]
In the United States consumer confidence is issued monthly by The Conference Board, an independent economic research organization, and is based on 5,000 households. Such measurement is indicative of consumption component level of the gross domestic product. The Federal Reserve looks at the CCI when determining interest rate changes, and it also affects stock market prices.
The Consumer Confidence Index was started in 1967 and is benchmarked to 1985=100. This year was chosen because it was neither a peak nor a trough. The Index is calculated each month on the basis of a household survey of consumers’ opinions on current conditions and future expectations of the economy. Opinions on current conditions make up 40% of the index, with expectations of future conditions comprising the remaining 60%. In the glossary on its website, The Conference Board
defines the Consumer Confidence Survey as “a monthly report detailing consumer attitudes and buying intentions, with data available by age, income and region”.
Another well-established index that measures consumer confidence is the University of Michigan Consumer Sentiment Index, run by University of Michigan‘s Institute for Social Research. …”
Calculation
In simple terms, increased consumer confidence indicates economic growth in which consumers are spending money, indicating higher consumption. Decreasing consumer confidence implies slowing economic growth, and so consumers are likely to decrease their spending. The idea is that the more confident people feel about the economy and their jobs and incomes, the more likely they are to make purchases. Declining consumer confidence is a sign of slowing economic growth and may indicate that the economy is headed into trouble.
Each month The Conference Board surveys 5,000 U.S. households. The survey consists of five questions that ask the respondents’ opinions about the following:[2]
- Current business conditions
- Business conditions for the next six months
- Current employment conditions
- Employment conditions for the next six months
- Total family income for the next six months
Survey participants are asked to answer each question as “positive”, “negative” or “neutral”. The preliminary results from the Consumer Confidence Survey are released on the last Tuesday of each month at 10am EST.
Once the data have been gathered, a proportion known as the “relative value” is calculated for each question separately. Each question’s positive responses are divided by the sum of its positive and negative responses. The relative value for each question is then compared against each relative value from 1985. This comparison of the relative values results in an “index value” for each question.
The index values for all five questions are then averaged together to form the Consumer Confidence Index; the average of index values for questions one and three form the Present Situation Index, and the average of index values for questions two, four and five form the Expectations Index. The data are calculated for the United States as a whole and for each of the country’s nine census regions.
How it is used
Manufacturers, retailers, banks and the government monitor changes in the CCI in order to factor in the data in their decision-making processes. While index changes of less than 5% are often dismissed as inconsequential, moves of 5% or more often indicate a change in the direction of the economy.
A month-on-month decreasing trend suggests consumers have a negative outlook on their ability to secure and retain good jobs. Thus, manufacturers may expect consumers to avoid retail purchases, particularly large-ticket items that require financing. Manufacturers may pare down inventories to reduce overhead and/or delay investing in new projects and facilities. Likewise, banks can anticipate a decrease in lending activity, mortgage applications and credit card use. When faced with a down-trending index, the government has a variety of options, such as issuing a tax rebate or taking other fiscal or monetary action to stimulate the economy.
Conversely, a rising trend in consumer confidence indicates improvements in consumer buying patterns. Manufacturers can increase production and hiring. Banks can expect increased demand for credit. Builders can prepare for a rise in home construction and government can anticipate improved tax revenues based on the increase in consumer spending.
Consumer Confidence Index in the United States
http://en.wikipedia.org/wiki/Consumer_Confidence_Index
University of Michigan Consumer Sentiment Index
The University of Michigan Consumer Sentiment Index Thomson Reuters/University of Michigan Surveys of Consumers is a consumer confidence index published monthly by the University of Michigan and Thomson Reuters. The index is normalized to have a value of 100 in December 1964. At least 500 telephone interviews are conducted each month of a United
States sample which excludes Alaska and Hawaii. 50 core questions are asked.[1]
The consumer confidence measures were devised in the late 1940’s by George Katona at the University of Michigan. They have now developed into an ongoing, nationally representative survey based on telephonic household interviews. The Index of Consumer Sentiment (ICS) is developed from these interviews. The Index of Consumer Expectations (a sub-index of
ICS) is included in the Leading Indicator Composite Index published by the U.S. Department of Commerce, Bureau of Economic Analysis.
Objectives
The Index was created and still is published with the following objectives:
- To assess near-time consumer attitudes on the business climate, personal finance, and spending;
- To promote an understanding of, and to forecast changes in, the national economy;
- To provide a means of incorporating empirical measures of consumer expectations into models of spending and saving behavior;
- To gauge the economic expectations and probable future spending behavior of the consumer; and
- To judge the consumer’s level of optimism/pessimism.
Inputs
The Index of Consumer Expectations seeks to find how consumers view three things:
- Their own financial situation.
- The short-term general economy.
- The long-term general economy.
Implications
This Index has implications which can influence the following:
- Stocks
- Bonds
- Dollar
http://en.wikipedia.org/wiki/University_of_Michigan_Consumer_Sentiment_Index
Univeristy of Michigan Consumer Sentiment Index
Michigan Consumer Sentiment 4th Worst on Record
Posted on 26 August 2011 by Doug Short
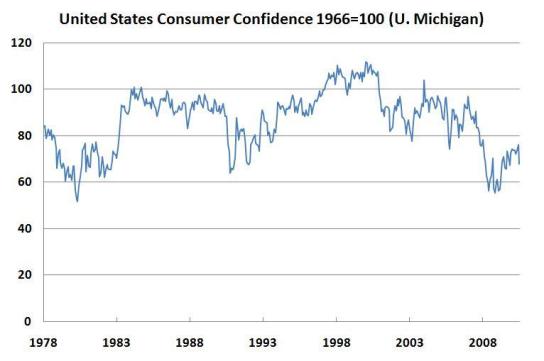
“…The University of Michigan Consumer Sentiment Index final report for
August came in at 55.7, a slight improvement over the 54.9 preliminary
reading August 12, but this is the 4th lowest monthly final since the
inception on the series in 1798. The Briefing.com consensus expectation
was for 55.8. The two lowest months (52.7 and 51.7) were at the depths
of the 1980 recession, and the third lowest was in November 2008 during
somes of the darkest days of the Financial Crisis.
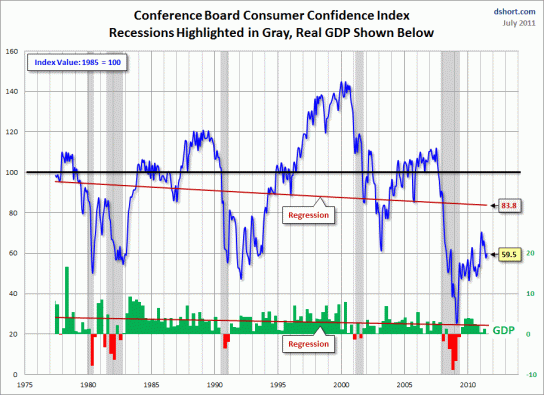
See the chart below for a long-term
perspective on this widely watched index. Because the sentiment index
has trended upward since its inception in 1978, I’ve added a linear
regression to help understand the pattern of reversion to the trend.
I’ve also highlighted recessions and included real GDP to help evaluate
the correlation between the Michigan Consumer Sentiment Index and the
broader economy. …”
http://econintersect.com/wordpress/?p=12471
Read Full Post | Make a Comment ( None so far )


You must be logged in to post a comment.